
Low Cost Big Data Solutions: The Case of Apache Spark on Beowulf
Clusters
Marin Fotache
a
, Marius-Iulian Cluci
b
and Valerică Greavu-Șerban
c
Al. I. Cuza University of Iasi, Romania
Keywords: Big Data, Beowulf Clusters, Apache Spark, Spark SQL, Machine Learning, Distributed Computing, TCP-H.
Abstract: With distributed computing platforms deployed on affordable hardware, Big Data technologies have
democratised the processing of huge volumes of structured and semi-structured data. Still, the costs of
installing and operating even relatively small cluster of commodity servers or the cost of hiring cloud
resources could prove inaccessible for many companies and institutions. This paper builds two predictive
models for estimating the main drivers of the data processing performance for one of the most popular Big
Data system (Apache Spark) deployed on gradually increased number of nodes of a Beowulf cluster. Data
processing performance was estimated by randomly generated SparkSQL queries on TPC-H database schema,
with variable number of joins (including self-joins), predicates, groups, aggregate functions and subqueries
included in FROM clause. Using two machine learning techniques, random forest and extreme gradient
boosting, predictive models tried to estimate the query duration on predictors related to cluster setup and
query structure and also to assess the importance of predictors for the outcome variability. Results were
positive and encouraging for extending the cluster number of nodes and the database scale.
1 INTRODUCTION
Before Big Data advent, massive data processing and
analysis was accessible to only big companies and
institutions. Both Big Data and Cloud Computing
opened the gates for data processing “democracy”.
Cloud computing has provided scalable storage and
processing platforms with prices depending on
consumed or rented resources (Josep et al., 2010;
Yang, 2017). The umbrella of technologies labelled
as Big Data provided, among other options, the
possibility to create data processing infrastructures by
deploying distributed storage and computing on
commodity hardware (Assunção, 2015; Van Dijck,
2014; Hashem et al., 2015).
While dramatically decreasing the cost for
operating private/organisational data centers, the
necessary hardware for deploying private Big Data
systems is far from negligible. Also costs associated
with hiring big data resources in cloud can steeply
increase when data volume and processing
complexity amplify (GCP, 2019).
a
https://orcid.org/0000-0002-5873-159X
b
https://orcid.org/0000-0002-8427-5436
c
https://orcid.org/0000-0003-2619-4598
For many categories of non-critical data
processing and data analysis tasks, deploying big data
clusters on the organisation’s workstations and using
them when they are idle (off the office hours) can be
appealing, especially when building and testing
prototypes, summarise/aggregate data, develop/apply
algorithms etc. (Fotache et. al, 2018b; Cluci et al.,
2019).
This paper tries to assess the data processing
performance of a popular big data platform (Apache
Spark) installed on small, but gradually extended
Beowulf cluster. Data processing performance is
expressed by the duration of a series of various
SparkSQL (Spark’s SQL dialect) queries executed on
different settings of the cluster and different sizes of
the database. In order to ensure data variability and
appropriateness for statistical analysis, queries were
generated randomly, using a module developed by the
authors. Resulted queries varied in terms of length,
number of joins, number of subqueries in FROM
clause, predicates included in WHERE clause,
groups, etc.
Fotache, M., Cluci, M. and Greavu-¸Serban, V.
Low Cost Big Data Solutions: The Case of Apache Spark on Beowulf Clusters.
DOI: 10.5220/0009407903270334
In Proceedings of the 5th International Conference on Internet of Things, Big Data and Security (IoTBDS 2020), pages 327-334
ISBN: 978-989-758-426-8
Copyright
c
2020 by SCITEPRESS – Science and Technology Publications, Lda. All rights reserved
327

Collected data was subsequently examined. Two
series of predictive models were fitted and assessed
through repeated cross-validation using random
forests and extreme gradient boosting. Models not
only estimated the query duration on various cluster,
database and query parameters, but also assessed the
importance of the predictors in explaining the
variability of the outcome.
2 RELATED WORK
Apache Spark (Spark, 2019) is a unified analytics
engine with excellent performances in large-scale
data processing (Gopalani & Arora, 2015; Armbust et
al., 2018; Lin & Hsu, 2019). SparkSQL module
provides support for running SQL queries on top of
the Spark framework by exploiting the cluster
capabilities and DAG optimizations. It can ingest data
from various sources such as .csv files, Avro, Parquet,
Hive tables, and many NoSQL and SQL data stores.
Ilias (2017) showed that SparkSQL is faster than
Apache Hive (a big data processing contender), since
Spark has a set of techniques to reduce reads and
writes to disk. Moving the core of data processing
from disc to memory makes Spark suitable for
Beowulf clusters since they usually lack impressive
hardware resources.
Similar to other types of computer clusters,
Beowulf clusters share storage and processing among
nodes, but they can be deployed on commodity
hardware. Unfortunately, studies on deploying Spark
on Beowulf clusters are sparse, since this big data
architecture is less glamorous and performs poorer.
Huamaní et al. (2019) deployed an experimental
cluster to test big data features using workstations
similar to the study described in this article. They
assess the cluster performance based on the
calculation of prime numbers. Other research
approached the parallel processing performance of
non-commodity hardware devices, such as Raspberry
Pi (Papakyriakou, et. al., 2018) or were concerned
with low energy consumption (Qureshi & Koubâa,
2019).
We share the idea that the future of parallel
processing technologies is based on cloud
technologies (public, private or hybrid), generally
accepting the costs associated with them. But, as this
study will show, the internal resources of companies
can still be cheaply and efficiently exploited in
creating models for analysing data on small and
medium datasets, or in deploying and testing features
and performance of some big data tools.
3 EXPERIMENTAL DESIGN
The paper’s main objective was to build models for
estimating (predicting) the duration of SparkSQL
queries, controlling for various parameters of the
cluster, database size and query complexity. For three
database sizes (1GB, 10 GB and 100GB) 100 queries
were randomly generated and then executed varying
the cluster manager (Standalone, YARN and Mesos
1), the available RAM on the workstations (4GB,
6GB and 8GB) and the cluster’s number of nodes (3,
6 and 9).
The setup was deployed between January and
June 2019 in a university lab off the class activities,
i.e. from 20:00 PM to 6:00 AM and also during
weekends and holidays. The idea was to use the
systems after the daily schedule, in order to assess
whether this could work in a real-life situation.
Further information about the cluster is displayed in
section 3.1, but the technical proprieties of those
machines fit our design.
Some of the queries were cancelled by the system
due to their complexity (mainly, because of large
numbers of self-joins and subqueries in FROM
clause). For the completed queries the execution time
was collected.
The second objective of the predictive models was
to identify the most important predictors for the
outcome variability. Both objectives were achieved
using two of the most popular Machine Learning
techniques, random forests and extreme gradient
boosting.
3.1 Beowulf Cluster
For this paper the cluster consisted of 10 computers
of which, one was the master and the other 9 worked
as nodes. The computers were equipped with 16GB
of DDR3 RAM, the Intel i5-4590 3.30GHz processor
with 4 cores, 4 threads and 6MB of cache memory;
the hard disk capacity was 500GB; the network was
of type 100Mbps.
Each computer had Windows 8.1 64-bit installed
and run VMs in VirtualBox 5.2.26, which is a
distribution of Linux Ubuntu 18.04 LTS (Bionic
Beaver); Ubuntu was updated with the latest patches
and fixes as of 2 February 2019. Apache Spark 2.4.3
was installed along with Hadoop 3.1.2 for transferring
data (and for its resource manager), Apache Mesos
1.8.0, Scala 2.11.12 and JDK1.8_201. Monitoring
was performed with NMON v6.0 and Ganglia 3.7.2.
The dataset used for testing was provided by TCP-
H 2.4.0, a tool used by so many scholars and
professionals for benchmarking the data processing
IoTBDS 2020 - 5th International Conference on Internet of Things, Big Data and Security
328

performance (Chiba & Onodera, 2016). Three
datasets with the scales of 1 (representing 1 GB of
hard disk space), 10 (10 GB) and 100 (100 GB) were
stored in their raw format.
Data distribution among cluster nodes was
achieved with Hadoop Distributed File System
(HDFS). The block size was set at 256 MB and the
replication factor was the same as the number of
nodes in the test scenario (3, 6 or 9 accordingly).
Depending by the test case, each working node
was configured with either 4GB, 6GB or 8GB of
RAM. We decide not to go over 8GB because some
spare RAM should be reserved for the swap memory,
disk cache/buffer, paging and other OS operation
which could hinder our research, according to the
study made by Chen et al. (2016).
3.2 Apache Spark
SQL queries was processed by the SparkSQL module
which generates directed acyclic graphs (DAG) and
chooses the most efficient execution plan for each
specific query. Thus, there was no need to translate
the queries into Scala in order to run them on the
dataset.
For each query executed, Spark records the time
needed to complete and some other details, such as
how many stages and tasks were completed or used
for intermediate results. The stages and tasks are
created according to the DAG and resembles the steps
required to get the query result; the tasks are
distributed among the nodes for distributed
processing. DAG are also useful for recovering a
resilient distributed dataset (RDD) and instrumental
for Spark’s acknowledged performance and fault
tolerance (Jinbae et al., 2019). Furthermore, the
RDDs can also tweak performance, by using
Parallelized Collections which allow parallel usage of
a chunk (also called slice) from the dataset at the same
time in parallel by avoiding locks (Spark, 2019). All
these features, plus the in-memory computing, make
Apache Spark an excellent solution for Big Data
processing.
Regardless of the how well optimized are the
default algorithms used for scheduling, some
tweaking is still needed for some of the parts in the
ecosystem, such as optimizations to the HDFS
settings, dataset, the cluster manager used and
especially to the JVM (Chiba & Onodera, 2016).
3.3 Data Processing Tasks (Queries)
One the most popular benchmark for assessing the
data processing performance of various systems is
TPC-H (TPC-H, 2018a). The benchmark provides an
8-table database schema, a tool (DBGen) for
generating random data for various scale factors
(TPC-H, 2018b) and a set of 22 pre-defined queries.
Even if the pre-defined queries were designed to
stretch the data processing capabilities of the tested
systems, they lack variability and randomness. Also,
their small number is not particularly suitable for
statistical or machine learning analysis.
Consequently, the tested queries were generated
by a special module (Fotache and Hrubaru, 2016;
Fotache et al., 2018a) which randomly builds valid
TPC-H queries in various SQL dialects. Generated
queries contain various number of tables (to be joined
or self-joined), WHERE predicates, grouping
attributes, simple HAVING predicates and
subqueries included in the FROM clause of the main
query. The values included in the predicates are
extracted (also randomly) from the records populated
with DBGen. The appendix shows a generated query.
4 METHOD, TOOLS
For each database size (scale factor) the 100-query set
was executed varying the cluster manager, the
workstations available RAM and cluster number of
nodes. Query duration of the completed queries was
collected. Next, exploratory data analysis examined
the variable distribution (trough bar plots and
histogram) and correlations among predictors (in
order to identify possible collinearities).
After data exploration, predictive models were
built using two popular machine learning techniques,
random forests and extreme gradient boosting. Model
performance was assessed with repeated cross-
validation. Both techniques also provide predictor
(variable) importance for the outcome variability.
4.1 Variables
The outcome variable of the predictive models is the
duration of each query completion. Variability of the
outcome was examined in relation to various
predictors related to the cluster setting, database size
and the query complexity.
Of the completed queries, 30% were executed on
limited 4GB-RAM workstations, 31% on limited
6GB-RAM and 39% on 8GB-RAM workstations
(predictor available_ram__gb). Grouped by the
Apache Spark cluster manager (variable
cluster_manager), 39% of the completed queries
were executed on Mesos, 35% on YARN and only
26% on Standalone manager. Also, the number of
Low Cost Big Data Solutions: The Case of Apache Spark on Beowulf Clusters
329
cluster nodes (variable n_of_nodes) was gradually
increased and the number of queries completed on
each of three settings (3-node, 6-node and 9-node
cluster) was similar.
The second group of predictors refers to the
database size (db_size__gb) and its relation to the
total memory available on the cluster (db_oversize).
Variable db_oversize signals if, when executing a
query, the database size exceeds or not the summed
cluster RAM. The class imbalance (82% frequency
for value “db < ram” and only 18% for “db >= ram”)
appears since, of the three scale factors, two had the
size smaller than the cluster total memory and only
one exceeded the cluster memory (100GB). Variable
db_size__gb had three values: 1 GB (frequency of
47%), 10GB (35%) and 100GB (18%).
The third series of predictors are related to the
query complexity and describe the structure of
SELECT, FROM, WHERE, GROUP BY, HAVING
and ORDER BY clauses. 81% of the completed
queries contain at least a filter included in WHERE
clause (predictor where_clause) and 32% contain
filters at group level included in HAVING (predictor
having_clause). The main FROM clause includes two
subqueries in 44% of the completed queries, one
subquery in 2% of the queries and no subquery for
54% of the queries (predictor sub_clauses).
Figure 1: Predictors related to query complexity (1).
In figure 1, variable aggr_functions records the
number of aggregation functions (COUNT, SUM,
MIN, MAX, AVG) appearing in the main query and
the subqueries, no matter if they are in conjunction
with GROUP BY or not; inner_joins keeps track of
the number of inner joins included in the query
syntax, whereas order_by and group_by record the
number of attributes used in ORDER BY and
GROUP BY clauses.
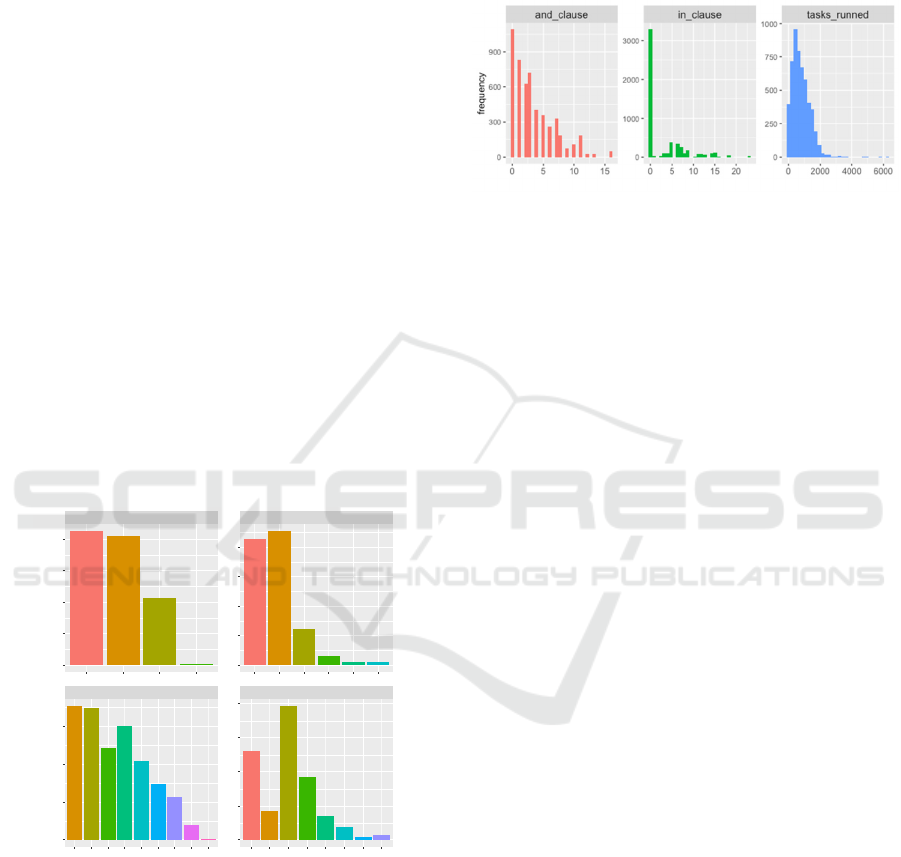
Variable and_clause (figure 2) acts as a proxy for
the number of predicates included in WHERE, since
predicates are randomly connected by AND and OR.
Variable in_clause keeps track of the number of
values included in predicates using IN option.
Figure 2: Predictors related to query complexity (2).
A special note on tasks_runned predictor (also in
figure 2): even it is not directly controllable in the
experiment, it acts as an additional proxy for query
complexity, being a consequence of the execution
plan performed by the system. It does not completely
overlap with the number of join and number of
subqueries variables, since any join could be a
“simple” join or a self-join, performed among two
tables or “chain” of tables – see the example in
appendix.
After data exploration, predictive models were
built using two popular machine learning techniques,
random forests and extreme gradient boosting. Model
performance was assessed with repeated cross-
validation. Both techniques also provide predictor
(variable) importance for the outcome variability.
4.2 Tools for Data Exploration and
Predictive Modelling
All the data processing and analysis was performed in
R (R Core Team, 2019). Data processing was
deployed using the tidyverse ecosystem of packages
(Wickham et al., 2019). Graphics were created with
ggplot2 (Wickham, H., 2016) package which is part
of the tidyverse, except the correlation plot in figure
6 generated with corrplot package (Wei & Simko,
2017).
Predictive models were built, assessed and
visualized using the tidymodels (Kuhn and Wickham,
2019) ecosystem, mainly the following packages:
rsample, recipe, parnsip and yardstick. Also, caret
(Kuhn & Johnson, 2013), ranger (Wright & Ziegler,
2017) and xgboost (Chen et al., 2019) packages were
used in model fitting and extracting the variable
importance. Package furrr (Vaughan & Dancho,
2018) helped speeding up the repeated cross-
validation of the models.
41%
39%
20%
0%
20%
20%
14%
17%
12%
8%
6%
2%
0%
41%
43%
11%
3%
1%
1%
25%
8%
37%
17%
7%
4%
1%
1%
inner_joins order_by
aggr_functions group_by
123456789 01234567
0123 012345
0
500
1000
1500
2000
0
500
1000
1500
2000
0
500
1000
1500
2000
0
300
600
900
frequency
IoTBDS 2020 - 5th International Conference on Internet of Things, Big Data and Security
330
5 RESULTS, DISCUSSION
As pointed out in previous sections, the main variable
of interest for assessing the data processing
performance of Apache Spark deployed on a basic
Beowulf cluster was the interval (in seconds)
necessary for completing every SQL (SparkSQL)
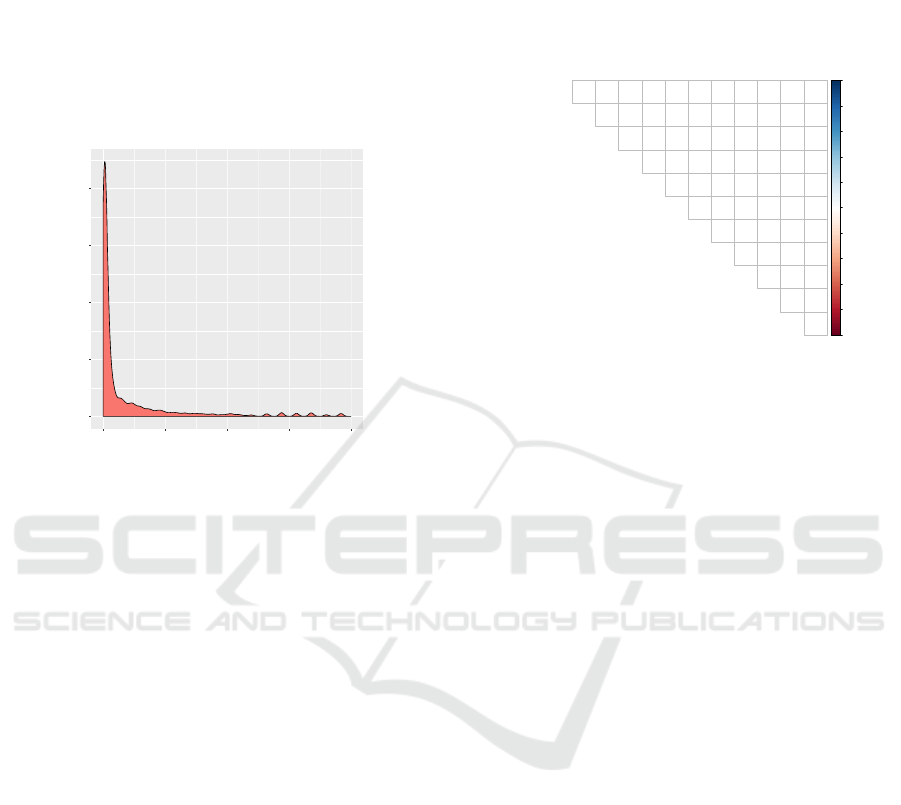
query. Figure 3 displays the density plot of the
outcome limited to [0, 1000] seconds range.
Figure 3: Outcome density plot ([0, 1000] range).
The limitation was imposed for visualization
purposes. Otherwise, the values are scattered on the
[0.013 - 19440] range. Duration median is 15.4
whereas average duration was 225 seconds, which
provides a clear imagine of the extreme distribution
asymmetry.
The imbalance of the values frequency for the
db_size__gb predictor (section 4.1) was a signal of
the decreased number of completed queries when
increasing the database size. Only 18% of the queries
launched on 100GB database were completed and this
is a consequence of having numerous queries
containing subqueries and self-joins.
The asymmetry of query duration also suggests
that, for larger database scale factors, complex
queries, involving larger number of joins, self-joins
and subqueries, queries cannot be finalized and the
number of observations containing large values of the
outcome decreased drastically.
Before proceeding to the building and assessment
of the predictive models, correlations among
predictors was examined – see figure 4. Even if
machine learning techniques are not as sensitive to
collinearity as the parametrical techniques (such as
linear regression), collinearity must be taken into
consideration.
The correlation plot shows no strong collinearity
among predictors. Due to the skewness of the
predictors, non-parametric Spearman correlation
coefficient was preferred. The largest correlation was
recorded for (sub_clause, inner_join) pair of
predictors – 0.76.
Figure 4: Correlation among predictors.
In the next step predictive models were build
using random forest and extreme gradient boosting
techniques. Both random forests and extreme gradient
boosting belong to the tree-based family. Both
techniques growth ensembles of classification or
regression trees (CART).
Random forests combine bagging sampling
approach with the random selection of features so that
it increases the prediction accuracy and reduces the
prediction variance (Breiman, 2001). Random forests
manifest both computational (fast and easy to train,
few tuning parameters, parallelizable, built-in error
estimation, high-dimensional problems handling) and
statistical (measure of variable importance, missing
value imputation, class weighting) strengths (Cutler
et al., 2012).
Extreme gradient boosting (Chen & Guestrin,
2016) is a new, regularized implementation of
gradient boosting framework (Friedman et al., 2000).
Boosting combines the predictions of several "weak"
learners (e.g. one-level trees) using a gradient
learning strategy in order to develop a "strong"
learner. Extreme gradient boosting show sometimes
similar better results than the random forests,
handling complex data with high speed and prediction
accuracy.
Repeated cross validation (n = 5, k = 10) was used
to assess the model performance. Three metrics were
collected for each fold assessment sub-set (the fold’s
assessment data) – the concordance correlation
coefficient (Lin, 1989), mean square error and r-
squared. Figure 5 displays the distribution of
performance metrics across the folds for both families
0.000
0.005
0.010
0.015
0.020
0 250 500 750 1000
duration
density
1
0.09
1
0.12
0.12
1
0.02
−0.01
0.06
1
−0.01
−0.01
−0.09
0.58
1
0.01
0.01
0.05
0.09
0.14
1
−0.02
−0.02
−0.18
0.32
0.48
0.27
1
−0.03
−0.03
−0.28
0.11
−0.01
0.06
−0.04
1
−0.01
−0.02
−0.15
0.04
−0.09
0
0.03
0.65
1
−0.01
−0.01
−0.06
0.43
0.76
0.24
0.51
−0.01
−0.01
1
−0.02
−0.01
−0.1
0.19
0.1
0.13
0.13
0.15
0.06
0.08
1
−1
−0.
8
−0.
6
−0.
4
−0.
2
0
0.2
0.4
0.6
0.8
1
n_of_nodes
available_ram__gb
db_size__gb
tasks_runned
inner_joins
in_clause
and_clause
group_by
aggr_functions
sub_clauses
order_by
n_of_nodes
available_ram__gb
db_size__gb
tasks_runned
inner_joins
in_clause
and_clause
group_by
aggr_functions
sub_clauses
order_by
Low Cost Big Data Solutions: The Case of Apache Spark on Beowulf Clusters
331
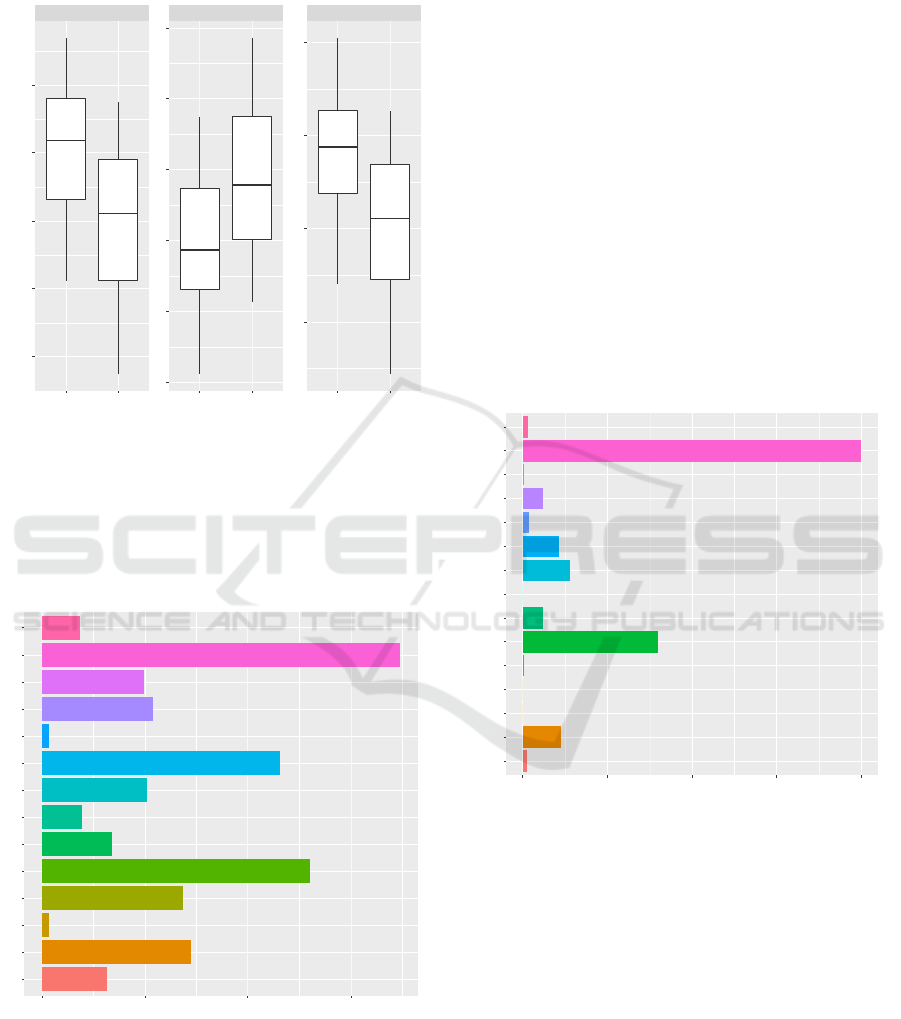
of models. Average ccc was .90 for random forests
and .88 for xgboost, whereas the average rsq was 0.84
for random forests and 0.80 for xgboost.
Figure 5: Main performance metrics for random forests and
xgboost models.
Since there was not so much variability in the
number of cluster nodes and available RAM, results
can be qualified as good. Also, for the given dataset,
random forests seem to perform better than xgboost.
Figure 6: Variable importance - Random Forests.
Both random forests and xgboost provides the
estimated importance of the predictors for the
outcome variability. Figure 6 shows the variable
importance estimated by the random forests using
permutation (Cutler et al., 2012). The most important
predictor is tasks_runned followed by the database
size. This underlines the importance of query
complexity, compared to the size of the database and
other cluster settings. The lack of importance for
predictors like number of nodes, db_oversize and the
cluster manager came as a surprise, since the quantile
regression model in (Cluci et al., 2019) identified
both the number of nodes and the cluster manager to
be statistically significant in explaining query
duration variability (admittedly, for both predictors
the Epsilon-squared and Freeman’s theta reported
small effect sizes).
Variable importance estimated by the xgboost
model is presented in figure 7. Similar to random
forest, in the xgboost final model the most important
predictor was tasks_runned, followed by
db_size__gb. Also, similar to previous chart, number
of nodes is not significant in the model. Surprisingly,
db_oversize is even less important in the xgboost
model.
Figure 7: Variable importance – xgboost.
Also, the number of joins, the presence of
WHERE and HAVING clauses are less prominent in
the xgboost model.
6 CONCLUSIONS AND
FURTHER RESEARCH
The main objective of the paper was to deploy and
assess the data processing performance (including the
performance drivers) of an Apache Spark distribution
deployed on a simple, affordable Beowulf cluster
ccc rmse rsq
r
a
n
d
o
m
f
o
r
e
s
t
x
g
b
o
o
s
t
r
a
n
d
o
m
f
o
r
e
s
t
x
g
b
o
o
s
t
r
a
n
d
o
m
f
o
r
e
s
t
x
g
b
o
o
s
t
0.75
0.80
0.85
0.90
0.7
0.8
0.9
1.0
1.1
1.2
0.84
0.86
0.88
0.90
0.92
.estimate
cluster_manager
n_of_nodes
db_size__gb
db_oversize
tasks_runned
inner_joins
where_clause
in_clause
and_clause
group_by
having_clause
aggr_functions
sub_clauses
order_by
0123
im
p
ortance
variable
tasks_runned
db_size__gb
in_clause
and_clause
inner_joins
group_by
order_by
n_of_nodes
where_clausewhere
aggr_functions
sub_clauses
db_oversizedb > ram
cluster_managerstandalone
cluster_manager yarn
having_clauseno having
0 255075100
im
p
ortance
variable
IoTBDS 2020 - 5th International Conference on Internet of Things, Big Data and Security
332

using (mainly off the office hours) a small subset of
modest organisational workstations.
Even if the variability of some predictors (such as
number of cluster nodes) was low, both machine
learning models have good results in predicting the
query duration based on main query and cluster
parameters. Random Forests model performed
slightly better than the xgboost model, with the
concordance correlation coefficient above 90% and
the R
2
about 85%.
Variable’s importance provided by both models
suggest, as expected, that the query complexity
(approximated the necessary Spark tasks for query
completion and the number of joins) is the main
driver of query performance. Also, the database size
was ranked as an important predictor.
Unexpectedly, predictors such as the cluster
number of nodes, the gap between the cluster memory
and the database size, the tuples grouping and group
filtering, the cluster manager were qualified as less
important (in the outcome variability) by the both
models.
Some further research directions may include:
Increasing the number of cluster nodes;
Running the queries on TPC-H databases with
larger sizes;
Adding Kubernetes as a cluster manager in
order to have a whole image of all the available
resource managers;
Making optimization to the JVM, the garbage
collection, and OS parameter for accelerating
Spark performance;
Assess the performance of other Spark features
such as Streaming, Machine Learning and
GraphX in order to see how they perform on a
Beowulf cluster;
Test with the dataset in other formats not just
the default generated by TCP-H: AVRO,
Parquet, blob storage and AWS S3, to see if
there are any performance gains;
Diversify the hardware resources and storage
types (e.g. add SSDs or RAID configuration);
Take into account the hardware bottlenecks
which might occur during the testing, and
quantification their effect on performance;
Run the queries on other Big Data systems (such
as Hive and Pig) to compare the performance;
Overall results suggest that running SQL queries
on Spark using modest Beowulf clusters is a viable
solution, but this need subsequent comparisons with
other Big Data solutions, on disk (e.g. Hive, Pig) or
in-memory (e.g. in-memory features of SQL servers,
MemSQL, VoltDB, Impala).
REFERENCES
Armbrust, M., Das, T., Torres, J., Yavuz, B., Zhu, S., Xin,
R., Ghodsi, A., Stoica, I. & Zaharia, M., 2018.
Structured Streaming: A Declarative API for Real-
Time Applications in Apache Spark, Proc. of the
SIGMOD'18, 601-613.
Assunção, M.D. et al., 2015. Big Data computing and
clouds: Trends and future directions. Journal of
Parallel and Distributed Computing, 2015, 79, 3-15.
Breiman, L., 2001. Random Forests, Machine Learning, 45,
pp.2-32
Chaowei, Y., Huang, Q., Li, Z., Liu, K., Hu, F., 2017. Big
Data and cloud computing: innovation opportunities
and challenges. International Journal of Digital Earth,
10, 13-53.
Chen, Q., Wang, K., Bian, Z., Cremer, I., Xu, G. and Guo,
Y., 2016. Simulating Spark Cluster for Deployment
Planning, Evaluation and Optimization, SIMULTECH
2016, SCITEPRESS, 33-43
Chen, T. & He, T., 2019. xgboost: Extreme Gradient
Boosting. R package version 0.90.0.2.,
https://CRAN.R-project.org/package=xgboost
Chen, T., Guestrin C., 2016. XGboost: a scalable tree
boosting system. Proc. of the 22nd ACM SIG KDD
International conference on Knowledge Discovery and
Data Mining. ACM Press, 785–94.
Chiba, T., Onodera, T., 2016. Workload characterization
and optimization of TPC-H queries on Apache Spark.,
Proc. of the ISPASS 2016, 112-121
Cluci, M.I., Fotache, M., Greavu-Șerban, V., 2019. Data
Processing Performance of Apache Spark on Beowulf
Clusters. An Overview. In Proc. of the 34th IBIMA
Conference
Cutler A., Cutler D.R., Stevens J.R., 2012. Random Forests.
In: Zhang C., Ma Y. (eds) Ensemble Machine Learning.
Springer, Boston, MA
Fotache, M., Hrubaru, I., 2016. Performance Analysis of
Two Big Data Technologies on a Cloud Distributed
Architecture. Results for Non-Aggregate Queries on
Medium-Sized Data. Scientific Annals of Economics
and Business, 63(SI), 21-50
Fotache, M., Tică, A., Hrubaru, I., Spînu, M.T., 2018a. Big
Data Proprietary Platforms. The Case of Oracle
Exadata, Review of Economic and Business Studies, 11
(1), 45-78
Fotache, M., Greavu-Șerban, V., Hrubaru, I., Tică, A.,
2018b. Big Data Technologies on Commodity
Workstations. A Basic Setup for Apache Impala. Proc.
of the 19th International Conference on Computer
Systems and Technologies (CompSysTech'18), ACM
Press
Friedman, J., Hastie, T., Tibshirani, R., 2000. Additive
logistic regression: a statistical view of boosting. The
Annals of Statistics, 28(2), 337–407.
GCP, 2019. Google Cloud Platform blog and
documentation, [Online], [Retrieved September 22,
2019], https://cloud.google.com/blog/products/gcp/.
Gopalani, S., Arora, R.R., 2015. Comparing Apache Spark
and Map Reduce with Performance Analysis using K-
Low Cost Big Data Solutions: The Case of Apache Spark on Beowulf Clusters
333

Means., International Journal of Computer
Applications, 113(1), 8-11.
Hashem, I.. Yaqoob, I., Anuar, N., Mokhtar, S., Gani, A.,
Khan, S., 2015. The rise of “Big Data” on cloud
computing: Review and open research issues.
Information Systems, 47, 98-115.
Huamaní, E. L., Condori, P., Roman-Gonzalez, A., 2019.
Implementation of a Beowulf Cluster and Analysis of
its Performance in Applications with Parallel
Programming. Int. J. Adv. Comput. Sci. Appl, 10(8),
522-527.
Ilias M., Eleni K., 2017. Performance evaluation of cloud-
based log file analysis with Apache Hadoop and
Apache Spark, The Journal of Systems & Software, 125,
133-151
Jinbae, L., Boabe, K. and Jong-Moon, C., 2019. Time
Estimation and Resource Minimization Scheme for
Apache Spark and Hadoop Big Data Systems with
Failures, IEEE Access, 7, 9658 – 9666.
Josep, A. D., Katz, R., Konwinski, A., Gunho, L. E. E.,
Patterson, D., Rabkin, A., 2010. A view of cloud
computing. Communications of the ACM, 53(4).
Kuhn, M., Johnson, K., 2013. Applied Predictive Modeling,
Springer. New York.
Kuhn, M., Wickham, H., 2019. tidymodels: Easily Install
and Load the 'Tidymodels' Packages. R package version
0.0.3. https://CRAN.R-
project.org/package=tidymodels
Lin, G., Hsu, I., 2019. Performance Evaluation of Fuzzy C-
means Associated with Spark based on Virtual Cloud
Computing, Bulletin of Networking, Computing,
Systems and Software, 8(1), 14-18.
Lin, L., 1989. A concordance correlation coefficient to
evaluate reproducibility. Biometrics, 45 (1), 255-268.
Papakyriakou, D., Kottou, D., Kostouros, I., 2018.
Benchmarking Raspberry Pi 2 Beowulf Cluster.
International Journal of Computer Applications, 975,
8887.
Qureshi, B., Koubâa, A., 2019. On Energy Efficiency and
Performance Evaluation of Single Board Computer
Based Clusters: A Hadoop Case Study. Electronics,
8(2), 182.
R Core Team, 2019. R: A Language and Environment for
Statistical Computing. Vienna, Austria: R Foundation
for Statistical Computing, [Retrieved October 12,
2019], https://www.R-project.org/.
Spark, 2019. Official Apache Spark documentation,
[Online], [Retrieved May 12, 2019],
https://spark.apache.org/docs/2.4.1/.
TPC, 2018a. TPC Benchmark H (Decision Support)
Standard Specification Revision 2.18.0,
http://www.tpc.org/tpc_documents_current_versions/p
df/tpc-h_v2.18.0.pdf
TPC, 2018b. TPC Benchmark H Tools,
http://www.tpc.org/TPC_Documents_Current_Version
s/download_programs/
Van Dijck, J., 2014. Datafication, dataism and
dataveillance: Big Data between scientific paradigm
and ideology. Surveillance & Society, 12(2), 197-208.
Vaughan, D., Dancho, M., 2018. furrr: Apply Mapping
Functions in Parallel using Futures. R package version
0.1.0., https://CRAN.R-project.org/package=furrr
Wei, T., Simko, V., 2017. R package "corrplot":
Visualization of a Correlation Matrix (Version 0.84).
Available from https://github.com/taiyun/corrplot
Wickham et al., 2019. Welcome to the tidyverse, Journal of
Open Source Software, 4(43), 1686,
https://doi.org/10.21105/joss.01686
Wickham, H., 2016. ggplot2: Elegant Graphics for Data
Analysis, Springer. New York. 2nd edition.
Wright, M.N., Ziegler, A., 2017. ranger: A Fast
Implementation of Random Forests for High
Dimensional Data in C++ and R. Journal of Statistical
Software, 77(1), 1-17
Yang, C., Huang, Q., Li, Z., Liu, K., Hu, F., 2017. Big Data
and cloud computing: innovation opportunities and
challenges. International Journal of Digital Earth,
10(1), 13-53.
APPENDIX
SELECT t2.s_name, t2.n_name,
SUM(t1.l_quantity * t1.l_extendedprice)
AS expr
FROM ( SELECT * FROM lineitem lineitem1
INNER JOIN partsupp partsupp1 ON
lineitem1.l_partkey =
partsupp1.ps_partkey
and lineitem1.l_suppkey =
partsupp1.ps_suppkey
INNER JOIN supplier supplier1 ON
partsupp1.ps_suppkey =
supplier1.s_suppkey) t1
inner join
( SELECT * FROM supplier supplier2
INNER JOIN nation nation2 ON
supplier2.s_nationkey =
nation2.n_nationkey
) t2 on
t1.s_suppkey = t2.s_suppkey
WHERE t1.s_suppkey < 7150 or
t1.l_commitdate between '1993-09-19' and
'1995-12-16' and t1.ps_availqty <> 2026 or
t2.n_regionkey <> 2 and t2.s_acctbal <=
2029.1
GROUP BY t2.s_name, t2.n_name
HAVING SUM(t1.l_quantity *
t1.l_extendedprice) >= 575085
ORDER B 1 DESC, 3 DESC
IoTBDS 2020 - 5th International Conference on Internet of Things, Big Data and Security
334
