
Smart Grid Reconfiguration based on Prediction Model for Technical
Teams Intervention Integration and Recovery Enhancement
Leila Ziouche
1,3
, Syrine Ben Meskina
2
, Mohamed Khalgui
1
and Laid Kahoul
4
1
National Institute of Applied Sciences and Technology, Carthage University, Tunis, Tunisia
2
Computer Science Department, ESPRIT - School of Business, Tunis, Tunisia
3
Computer Science Department, Science Faculty of Tunis, Tunis, Tunisia
4
LINFI LAB, Computer Science Department, Biskra University, Algeria
Keywords:
Smart Grid, Reconfiguration, Technical Team, Prediction Model, Recovery Enhancement.
Abstract:
To overcome the problem of critical failures recovery and improve reliability, quality of service and recovery
performance, it is essential to provide and apply a new oriented solution for smart grid reconfiguration. This
solution allows for resolving the problem of the late intervention of technical teams and the insufficiency of
energy for recovery, by implementing a prediction model that assists the integration of a number of technical
teams. In addition, it estimates the newly added number of emergency lines coming from new integrated
renewable sources. This heuristic is programmed based on the linear programming and the simplex algorithm.
This approach is implemented in python as a tool called SGREP, then tested and validated at run-time on four
real different smart grids. Thereby, the proposed solution improves the guaranteed gains in terms of power
availability, waiting time and financial cost.
1 INTRODUCTION
The smart grid is defined as a real meshed power net-
work of electrical components and lines, specifically
it includes three voltage levels: high, medium and
low. In the context of failures detection and restora-
tion, a study in (Iqbal and Kütt, 2018) has investi-
gated the power demands of clients by establishing
a new model that estimates power quality characteris-
tics in residential buildings. They have measured the
consumer energy demand using the web of things for
personalized loads forecasting in (Ding et al., 2014).
Authors in (Ben Meskina et al., 2016) have su-
pervised and controlled smart grids through a multi-
agent system with variant smart devices and sensors
and integrates new emergency lines coming from a
central power plant. In (James et al., 2017), a pro-
posed scheme is provided for determining the fault
type, phase, and location for the protection of micro-
grid and the recovery of failures. In (Ben Meskina
et al., 2018), a reconfiguration solution is proposed to
identify consumers that may play the role of feeders
by adding new emergency lines between consumers.
However, researchers in (Bhalshankar and Thorat,
2016) have addressed the effective role of the integra-
tion of renewable sources to improve the growth of
power demand. Researchers in (Abidi et al., 2017)
have created a mathematical model that works for en-
ergy balancing between the production and the con-
sumption of loads in micro-grids. In (Worighi et al.,
2019), authors have briefly proposed a virtual system
for the integration of solar power generation units and
battery storage systems with the proposed architec-
ture along with control strategies.
Authors in (Nefedov et al., 2018) have developed
an electric vehicle that uses renewable energy sources
to support great prosumer buildings in case of in-
terruptions and outages. In (Ziouche et al., 2019a),
workers have provided a linear regression prediction
model that defines the accurate number of new inte-
grated renewable sources to a studied smart grid ac-
cording to a given budget by the electricity market.
In (Ziouche et al., 2019b), researchers have imple-
mented a new cloud-based architecture for smart grid
rebuilding where we have worked on scheduling tech-
nical teams interventions and estimation of available
renewable energy in sources for failures recovery.
In (Vaidya and Kasturiwale, 2016), researchers
have dealt with giving the solution of solving two-
phase problems with the simplex methods that work
for the resolution of linear programming problems.
Nowadays, smart power systems aim to enhance
382
Ziouche, L., Ben Meskina, S., Khalgui, M. and Kahoul, L.
Smart Grid Reconfiguration based on Prediction Model for Technical Teams Intervention Integration and Recovery Enhancement.
DOI: 10.5220/0009406703820389
In Proceedings of the 15th International Conference on Evaluation of Novel Approaches to Software Engineering (ENASE 2020), pages 382-389
ISBN: 978-989-758-421-3
Copyright
c
2020 by SCITEPRESS – Science and Technology Publications, Lda. All rights reserved

security, reliability, recovery performance and quality
of service. Critical clients such as hospitals, commer-
cial buildings and research laboratories suffer from a
miss of electricity in case of blackouts and outages,
which causes a set of problems such that:
• The insufficient number and late intervention of
technical teams because they are not specialized
or busy in repairing other urgent failures.
• The slow intervention of technical teams that
causes the growth of total waiting time.
• The self-insufficiency of available energy for re-
covery of critical failures in repairing.
In order to resolve the above problems, we propose a
global reconfiguration that is applied in two steps:
• The first step is to integrate and predict the ac-
curate number of expert and technician teams
needed to fix all the failures in the smart grid, then
apply run-time scheduling.
• The second step is to provide a new number of
emergency lines to reduce clients waiting time
without electricity.
Based on this contribution, we propose in this paper a
new approach that permits (i) to cover multiple un-
covered failures, (ii) to bring a defined number of
technical teams: « expert teams that works for hard
failures maintenance and technician teams that repair
easy failures », and (iii) to integrate new emergency
lines at real-time from renewable sources. We imple-
ment a tool called SGREP for smart grid reconfigura-
tion and to demonstrate the effectiveness and robust-
ness of this strategy in order to guarantee best recov-
ery in terms of power availability and waiting time.
The remainder of this paper is organized as fol-
lows: Section 2 surveys the formalized requirements
of the problematic. Section 3 discusses the contribu-
tion of reconfiguring strategy. Section 4 considers a
case study and shows the obtained gains in terms of
power availability and total waiting time. Section 5
concludes the paper and provides a brief suggestions
for the future work.
2 SMART GRID MODEL
In this section, we formalize the smart grid structure
and parameters.
2.1 Smart Grid Formalization
A smart grid SG is considered as a graph of electrical
components and electrical lines, i.e.,
SG = G(C,L) (1)
where C is the set of electrical components that in-
cludes a set of power generators PG, a set of trans-
formers T RANS and a set of consumers CONS, i.e.,
C = PG ∪ T RANS ∪CONS
PG = PS ∪ RS
T RANS = MV T ∪ LV T
CONS = MC ∪ LC
(2)
where PS is the central power plant and RS is the set
of existing renewable sources in the smart grid, MV T
and LVT are respectively the sets of medium and low
voltage transformers, MC and LC refer to the sets of
medium and low consumers. L is the set of electrical
lines, it involves a set of principal lines PL that are
activated pertinently and a set of emergency lines EL
activated in case breakdowns and interruptions, i.e.,
L = PL ∪ EL. (3)
2.1.1 Failures
Smart grids can face a global list of failures
GFL(SG). A failure f (x
k
) ∈ GFL(SG) represents the
malfunction of a component or line x
k
that may cause
multiple propagated failures. Hence, the recorded
failures list GFL(SG) is categorized into «dominant»
or «equivalent» that allows reducing the number of
failures to be maintained and resolved as cited in
(Ben Meskina et al., 2016) where we define a short
fault list SFL(SG) ⊆ GFL(SG), with |SFL(SG)| ≤
|GFL(SG)| as mentioned in Equation (4).
SFL(SG) = { f (x
1
),.., f (x
k
),.., f (x
N
f
)} (4)
where N
f
is the number of recorded failures in SG.
Let us suppose that f (x
k
) ∈ SFL(SG) is characterized
by: (i) a required load ReqL
f (x
k
)
, (ii) a priority com-
paring with other failures Pr
f (x
k
)
, (iii) a needed re-
covery time RT
f (x
k
)
, and (iv) the waiting time with-
out electricity W T
f (x
k
)
. Also, every failure f (x
k
) ∈
SFL(SG) is defined by: (i) its class in classification,
(ii) a fixing time FT
f (x
k
)
, (iii) the proposed technical
team for repairing, (iv) its waiting time for the arrival
of technical team W TA
f (x
k
)
, (v) the recovery available
time RTA
rs
j
and (vi) recovery available energy de-
mand E
rs
j
by recovery source rs
j
. Thereby, SFL(SG)
can be classified into:
(i) uncritical failures list NCF(SG): includes the to-
tally covered failures by an emergency line coming
from a renewable source or central power plant, i.e.,
NCF(SG) = { f (x
k
)/RT
f (x
k
)
≤ RTA
rs
j
} (5)
(ii) critical failures list CF(SG): contains the uncov-
ered or insufficiently covered failures by a renewable
source, i.e.,
CF(SG) = { f (x
k
)/RT
f (x
k
)
> RTA
rs
j
} (6)
Smart Grid Reconfiguration based on Prediction Model for Technical Teams Intervention Integration and Recovery Enhancement
383

2.1.2 Failures Recovery Sources
Every failure f (x
k
) ∈ SFL(SG) may have 0, 1 or
N
EL
f (x
k
)
recovery sources, in the form of electrical
emergency lines coming from the power plant or ex-
isting renewable sources. We suppose that EL
PS
is
the set of emergency lines coming from power plant
and EL
RS
is the set of emergency lines coming from
existing renewable sources, i.e.,
EL = EL
PS
∪ EL
RS
(7)
Thus, the existing renewable sources are in the form
of solar panels, wind turbines, and batteries, i.e.,
RS = {pv
1
,..., pv
N
1
,wt f
1
,...,wt f
N
2
,bt
1
,...,bt
N
3
} (8)
where N
1
, N
2
, and N
3
are respectively the existing
numbers of solar panels, wind turbines, and batteries.
The total recovery time T RAT
RS
and the total recov-
ery energy TRA
RS
of the existing renewable sources
in the smart grid are defined both in Equation (9).
(
T RTA
RS
=
∑
N
RS
j=1
RTA
rs
j
T RA
RS
=
∑
N
RS
j=1
E
rs
j
(9)
where N
RS
is the number of renewable sources: N
RS
=
N
1
+N
2
+N
3
, with j = 1,.., N
RS
. Every proposed sub-
set of recovery source rs
j
⊆ RS is defined by: (i) the
generated energy E
rs
j
= E
pv
∗a
1
+E
wt f
∗a
2
+E
bt
∗a
3
,
and (ii) the recovery available time RTA
rs
j
= RT
pv
∗
a
1
+ RT
wt f
∗ a
2
+ RT
bt
∗ a
3
, where E
pv
, E
wt f
and E
bt
refer respectively to generated loads by a solar panel,
a wind turbine or a battery. RT
pv
, RT
wt f
and RT
bt
are
recovery times of a solar panel, wind turbine and a
battery respectively. a
1
, a
2
and a
3
refer to the percent-
age of energy transformed through emergency lines to
cover assigned components by f (x
k
). Hence, we ver-
ify the sufficiency of available energy by calculating
the remaining load Q
k, j
= E
rs
j
− ReqL
f (x
k
)
.
2.1.3 Failures Maintenance
The maintenance phase is applied by specialized
groups, working together for failures repairing, in
smart grid called technical teams T T (SG), i.e.,
T T (SG) = {T T
1
,..,T T
i
,..,T T
N
tt
}
T T (SG) = Exp(SG) ∪Tech(SG)
(10)
Every single technical team T T
i
∈ T T (SG) is defined
by: (i) a scheduling table Sched
T T
i
, (ii) a total fixing
time T FT
T T
i
and (iii) a budget P
T T
i
that defines the
salary to be paid and the materials to be used dur-
ing failures maintenance, with i = 1,..,N
tt
and N
tt
is
the total number of teams: N
tt
= N
Exp
+ N
Tech
, where
N
Exp
and N
Tech
are the numbers of expert and techni-
cian teams.
Expert Teams Exp(SG): they are experted teams in
repairing critical and hard failures with the highest
priorities over components and lines in SG.
Technician Teams Tech(SG): they are the teams that
move to maintain medium, easy and fully recovered
failures over lines in SG.
After defining the chosen technical team to repair
a determined failure f (x
k
), we apply the proposed
scheduling algorithm in (Ziouche et al., 2019b) to
compute the total fixing time of failures for each tech-
nical team that must be equivalent or almost closest.
2.2 Problems
According to the existing researches on smart grids
recovery enhancing, the insufficient number of tech-
nical teams that may intervene quickly to maintain
failures causes a problem of: (i) long waiting time
for the arrival of technical teams, and (ii) critical
failures increasing due to the growth of the waiting
time of clients without energy regarding covered fail-
ures with renewable energy sources, (iii) the inabil-
ity of technician teams to repair some failures that
need the fast intervention of an expert team, (iv) the
least number of expert teams and their inability to
intervene because of their occupation in other loca-
tions, and (v) the insufficiency of energy for recov-
ery causes power and financial losses (e.g., We sup-
pose that f (x
k
) is a recorded failure and it has no re-
covery source RTA
rs
j
= 0h, it needs a recovery time
from an emergency source for RT
f (x
k
)
= 5h. Also, the
number of teams in this smart grid is N
tt
= 2 where
N
Exp
= 1 and N
Tech
= 1. The technician team tried
to fix this failure, but it needs the fast intervention of
an expert team with experted material while the ex-
pert team is busy in repairing another failure. In this
case, f (x
k
) should wait for the arrival of technical
team for W TA
f (x
k
)
= 3h, it stays without electricity
for W T
f (x
k
)
= 5h).
3 CONTRIBUTION: SMART
GRID RECONFIGURATION
In order to reduce the waiting time for the arrival of
teams and to minimize the waiting time without elec-
tricity, we brought in Figure 1 an approach that en-
hances failures recovery and permits to guarantee bet-
ter power availability during failures maintenance.
3.1 Failures Classification
The categorization of global list of failures GFL(SG)
into « dominant or equivalent » failures allows re-
ENASE 2020 - 15th International Conference on Evaluation of Novel Approaches to Software Engineering
384
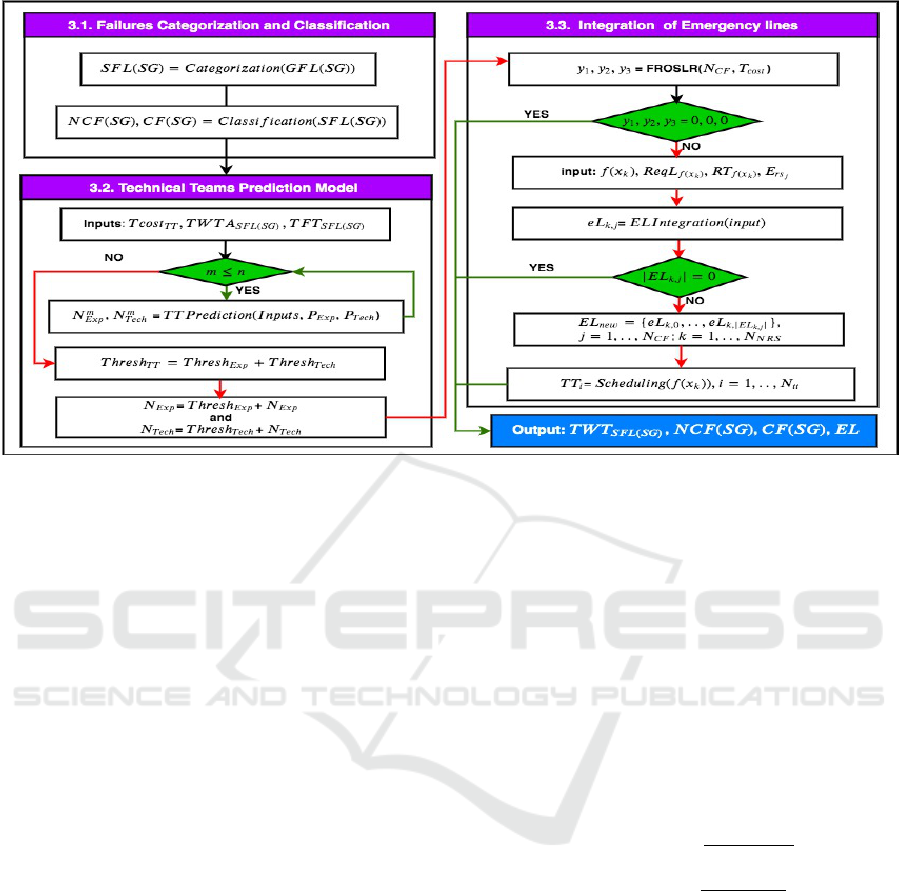
Figure 1: Smart grid Reconfiguration Architecture for availability Enhancement.
ducing the number of failures into a short fault list
SFL(SG). These failures are then classified into: (i)
critical CF(SG) and (ii) uncritical NCF(SG) failures
as explained in formulas (5) and (6) to determine the
failures that need the fast intervention of technical
teams and new recovery emergency lines.
3.2 Technical Teams Prediction Model
In order to realize the fast maintenance of failures,
we aim to build a prediction model based on linear
programming and simplex (Vaidya and Kasturiwale,
2016) that allows defining the new integrated number
of technical teams according to a given budget by the
electrical market. We define using equation system
(11) the minimized accurate numbers of expert and
technician teams.
Minimize N
m
tt
= N
m
Tech
+ N
m
Exp
N
m
Tech
∗ P
Tech
+ N
m
Exp
∗ P
Exp
≤ T cost
T T
N
m
Tech
∗ T FT
Tech
+ N
m
Exp
∗ T FT
Exp
≤ β
N
m
Tech
,N
m
Exp
≥ 0
(11)
where N
m
Tech
and N
m
Exp
refer respectively to the num-
bers of technician and expert teams, P
Tech
and P
Exp
refer respectively to the total salaries and used mate-
rials prices of a technician team and an expert team,
T cost
T T
is the given budget to pay new integrated
technical teams. T FT
Tech
and T FT
Exp
are the total
fixing times spent by a technician team and an expert
team, and β = T FT
m
SFL(SG)
+ TW TA
m
SFL(SG)
where
T FT
m
SFL(SG)
is the total fixing time of failures and
TW TA
m
SFL(SG)
is the total waiting time for the arrival
of teams. Then, we adjust the constraints by adding
the slack variables e
1
and e
2
, i.e.,
N
m
Tech
∗ P
Tech
+ N
m
Exp
∗ P
Exp
+ e
1
= T cost
T T
N
m
Tech
∗ T FT
Tech
+ N
m
Exp
∗ T FT
Exp
+ e
2
= β
N
m
Tech
,N
m
Exp
,e
1
,e
2
≥ 0
(12)
This system is resolved at each month using the sim-
plex algorithm where after a number of iterations I,
we get the values of N
m
Tech
and N
m
Exp
.
After that, we compute the accurate threshold num-
bers of technician and expert teams to be integrated,
respectively T hresh
Tech
and T hresh
Exp
, i.e.,
T hresh
Tech
=
∑
n
m=1
N
m
Tech
n
T hresh
Exp
=
∑
n
m=1
N
m
Exp
n
(13)
where n refers to the number of months that defines
the historic period of study, N
m
Tech
and N
m
Exp
are the
numbers of technician and expert teams at m
th
month.
After getting the accurate values of thresholds, we
build for each team a scheduling table.
3.3 Integration of Emergency Lines
To define the number of new added emergency lines
into a smart grid, we take the set of critical failures
CF(SG) that suffer from electricity missing during
blackouts, and sort them according to failure prior-
ity. We briefly indicate the set of new integrated re-
newable sources NRS(SG) that includes respectively
Smart Grid Reconfiguration based on Prediction Model for Technical Teams Intervention Integration and Recovery Enhancement
385
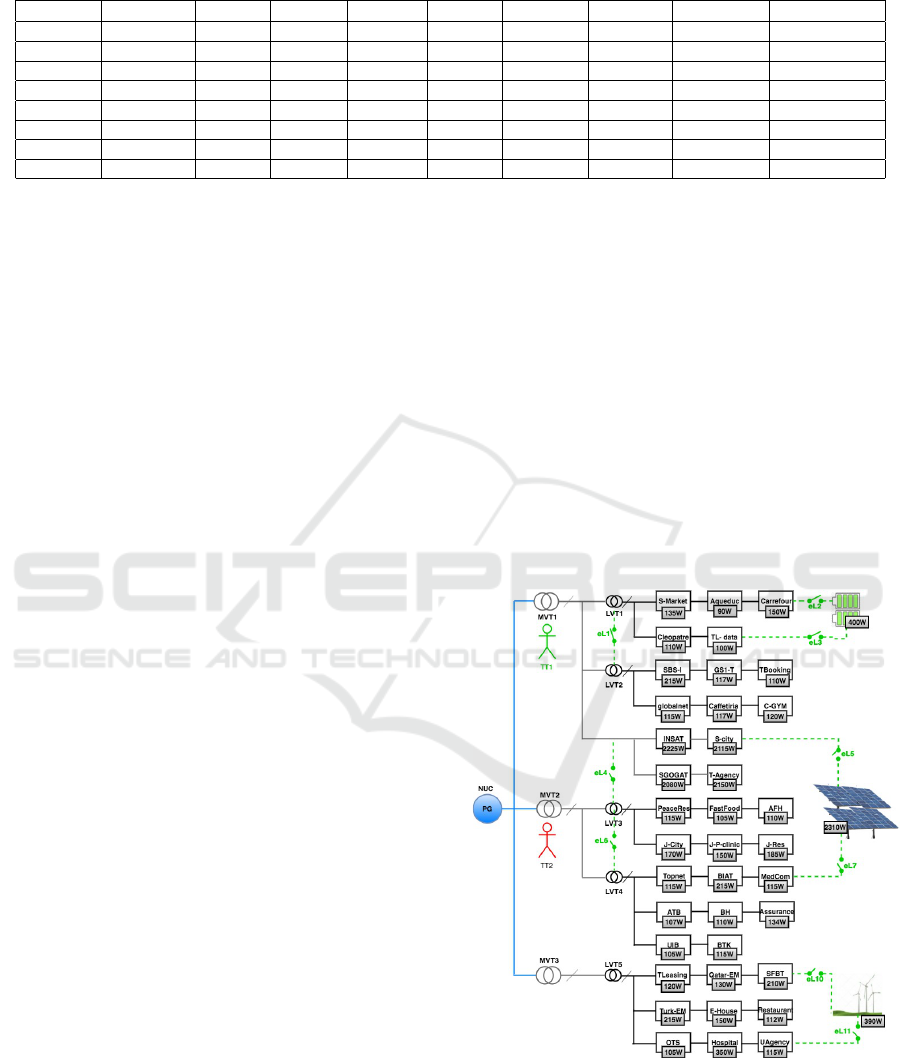
Table 1: Detailed information about observed critical failures.
f (x
k
) ReqL
f (x
k
)
RT
f (x
k
)
FT
f (x
k
)
W T
f (x
k
)
T RA
RS
T RTA
RS
T RA
NRS
T RTA
NRS
a
1
+ a
2
+ a
3
f (L
24
) 220W 2h 2h 2h 0 0h 220W 2h 0.67+0+0
f (ML
6
) 2150W 9h 9h 9h 0 0h - - -
f (LV T
5
) 1507W 14h 8h 8h 690W 6h 817W 6h 2.12+0+0.51
f (L
21
) 351W 4h 3h 4h 0 0h 185W 2h 0.56+0+0
f (L
6
) 442W 6h 3h 6h 0 0h 442W 6h 1+0.49+0
f (L
31
) 262W 4h 4h 4h 0 0h 262W 4h 0.03+0+1.21
f (L
15
) 535W 4h 4h 4h 0 0h 535W 4h 1.62+0+0
f (LV T
1
) 558W 8h 5h 2h 400W 6h 158W 2h 0+0+0.79
y
1
solar panels, y
2
wind turbines and y
3
batteries as
reported in (Ziouche et al., 2019a). In order to max-
imize the number of added emergency lines coming
from renewable sources that satisfy the required load
of f (x
k
) and cover it during the intervention of tech-
nical teams, we certify the following constraints, i.e.,
Maximize N
EL
f (x
k
)
= a
1
+ a
2
+ a
3
a
1
+ a
2
+ a
3
≤ N
NRS
E
pv
∗ a
1
+ E
wt f
∗ a
2
+ E
bt
∗ a
3
≥ ReqL
f (x
k
)
RT
pv
∗ a
1
+ RT
wt f
∗ a
2
+ RT
bt
∗ a
3
≥ α
a
1
,a
2
,a
3
≥ 0
(14)
where α = W TA
f (x
k
)
+ FT
f (x
k
)
is the needed time for
coverage by renewable sources.
To adjust the proposed constraints, we add the
three slack variables respectively e
1
, e
2
and e
3
, i.e.,
a
1
+ a
2
+ a
3
+ e
1
= N
NRS
E
pv
∗ a
1
+ E
wt f
∗ a
2
+ E
bt
∗ a
3
− e
2
= ReqL
f (x
k
)
RT
pv
∗ a
1
+ RT
wt f
∗ a
2
+ RT
bt
∗ a
3
− e
3
= α
a
1
,a
2
,a
3
,e
1
,e
2
,e
3
≥ 0
(15)
We apply simplex algorithm to resolve the equation
systems. We re-compute the remaining numbers of
y
1
, y
2
, y
3
and the remaining total available load of new
renewable sources T RA
NRS
of the existing failure in
the critical failures list. The used percentage of energy
load from a new renewable source indicates adding a
new emergency line going from the defined source to
its final destination. Finally, we can build the new set
of added emergency lines EL
new
= {eL
k, j
/Q
k, j
≥ 0}
with eL
k, j
is the new emergency line that connects the
k
th
failure and j
th
integrated renewable source.
Then, we apply the scheduling algorithm pro-
posed in (Ziouche et al., 2019b) to build final schedul-
ing tables, and we re-define the value of TW T
SFL(SG)
and the critical CF(SG), uncritical failures NCF(SG).
4 IMPLEMENTATION &
RESULTS
In order to evaluate the proposed prediction model,
we have implemented a tool called SGREP that is ap-
plied to a real case study. Then, we have validated the
obtained gains through real-time experimental study.
4.1 Case Study
The proposed contribution is demonstrated and illus-
trated through the following real-time study. We con-
sider the real meshed power network -North Urban
Center SG (Tunis, Tunisia)- as presented in Figure 2.
Figure 2: Case study on North Urban center smart grid.
SG is composed of a power generator PG, eight trans-
formers: 3 MV T and 5 LV T , thirty-eight consumers:
4 MC and 34 LC, with nine emergency lines EL: 3
EL
PS
and 6 EL
RS
. We assume that there are two
technical teams that intervene to repair failures in
ENASE 2020 - 15th International Conference on Evaluation of Novel Approaches to Software Engineering
386

SG (N
Exp
= 1 and N
Tech
= 1). SG is supervised and
controlled through smart agents and devices that de-
tect and isolate malfunctioned lines as explained in
(Ben Meskina et al., 2016).
Table 2: Observed values of studied smart grid.
Month Jan Feb Mar Apr May Jun
N
f
15 9 13 14 12 10
N
CF
8 4 7 8 6 5
T ReqL
CF
6.03 2.65 5 5.02 2.29 4.06
TW T
CF
39h 21h 30h 14h 21h 25h
T FT
CF
53h 38h 41h 50h 32h 40h
T RTA
RS
12h 12h 6h 0h 0h 10h
After a deep supervision of six successive months,
we consider (i) the number of recorded failures N
f
,
(ii) the number of critical failures N
CF
, (iii) the
total required load (in kilowatts), (iv) total fixing
time (hours), (v) total waiting time (hours), and (vi)
the total available recovery time as shown in Ta-
ble 2 (e.g., In January, the recorded number of crit-
ical failures is N
CF
= 8. These last need a total
required load of T ReqL
CF
= 6.03kWh. Technical
teams spend T FT
SFL(SG)
= 53h to fix these failures
where the initial total waiting time without energy
is TW T
SFL(SG)
= 39h). Thereby, we suppose that
the given budget by the electricity market to inte-
grate a new number of renewable sources in SG is
T
cost
= 6000$. The given budget to pay the newly
added number of technical teams is T cost
T T
= 3000$
and the paid salaries to a technician and an expert
team are in order: P
Exp
= 1200$, P
Tech
= 770$. Also,
we suppose that the quantity of generated energy by a
solar panel, a wind turbine, and a battery are succes-
sively: E
pv
= 330W , E
wt f
= 230W and E
bt
= 200W ,
the prices of a solar panel, a wind turbine and a
battery are respectively: P
pv
= 710$, P
wt f
= 600$,
P
bt
= 450$, and the recovery times available by a so-
lar panel, a wind turbine and a battery are in order:
RT
pv
= 3h, RT
wt f
= 2h and RT
bt
= 3h.
Step 1: Failures Classification. Let us suppose that
SFL(SG) includes fifteen failures, we use the formu-
las (5) and (6) to classify failures into:
CF(SG) = { f (L
24
), f (L
21
), f (ML
6
), f (LV T
1
), f (L
6
),
f (L
31
), f (LV T
5
), f (L
15
)}, NCF(SG) = { f (LV T
3
),
f (ML
1
), f (ML
2
), f (L
19
), f
(
L
24
), f (L
4
), f (L
38
)}. The
proposed scheduling tables allow computing the total
waiting times without electricity and for the arrival
of technical teams respectively: TW T
CF
= 39h and
TW TA
SFL(SG)
= 115h.
Step 2: Technical Teams Prediction Model. The
growth total waiting time without electricity of
recorded failures and total fixing time of failures show
that the existing two technical teams for failures main-
tenance in SG are insufficient. Thus, we apply the
proposed prediction model in Section 3.2 on January
to define the minimum number of teams to be inte-
grated into SG. Based on the proposed linear pro-
gramming system in formulas (11) and (12), we com-
pute using simplex algorithm the accurate values of
expert and technician teams. We find: N
Exp
= 1 and
N
Tech
= 2. We re-apply the same process on the five
remaining months to predict the accurate thresholds
of expert and technician teams with the help of for-
mula (13), we find: T hresh
Exp
= 1, and Thresh
Tech
=
2. The total numbers of technician and expert teams
are respectively N
Tech
= 3 and N
Exp
= 2.
Step 3: Integration of Emergency Lines. Based
on the implemented tool FROSLR in (Ziouche et al.,
2019a), we can predict the accurate threshold of in-
tegrated renewable sources T hresh
NRS
= 9 with the
accurate values of added solar panels y
1
= 6, wind tur-
bines y
2
= 1 and batteries y
3
= 2. The total recovery
time available T RTA
NRS
= 26h and total available en-
ergy for recovery T RA
NRS
= 2610W . Then, we com-
pute the maximized number of emergency lines using
formulas (14) and (15) and simplex algorithm.
Table 1 illustrates the detailed information of criti-
cal failures recovery after integrating a new number
of renewable sources in January month (e.g., A fail-
ure occurred on LV T
1
requires a load of 558W for 8h.
Technical teams must spend 5h to fix this failure, the
clients of this region wait without electricity for 2h, it
is covered through available renewable sources for 6h
and after adding one emergency line coming from a
battery N
EL
new
( f (LV T
5
)) = 1, where T RA
NRS
= 158W
and T RTA
NRS
= 2h). Hence, the application of the
proposed reconfiguring strategy is applied in the same
way on the five rest months to determine the numbers
of critical and uncritical failures and emergency lines.
They are respectively equal to N
NCF
= 13, N
CF
= 2
and N
EL
new
= 13.
The system applies a scheduling algorithm to assign
priorities and teams to all existing failures. We get at
the end five scheduling tables where the total fixing
times are almost equal. The obtained scheduling ta-
bles are: Sched
Exp
1
= { f (ML
6
), f (LV T
3
), f (L
1
)}
Sched
Exp
2
= { f (LV T
5
), f (ML
2
), f (L
19
)}
Sched
Tech
1
= { f (L
24
), f (L
31
), f (LV T
3
), f (L
4
)}
Sched
Tech
2
= { f (L
21
), f (LV T
1
), f (ML
1
)}
Sched
Tech
3
= { f (L
6
), f (L
15
), f (L
38
)}
Hence, we get: TWT
CF
= 11h and TW TA
CF
= 5h.
4.2 Performance Evaluation
To illustrate the obtained gains using simulated tool
SGREP, we define for every smart grid SG two met-
rics that are the total availability rate and the total
Smart Grid Reconfiguration based on Prediction Model for Technical Teams Intervention Integration and Recovery Enhancement
387
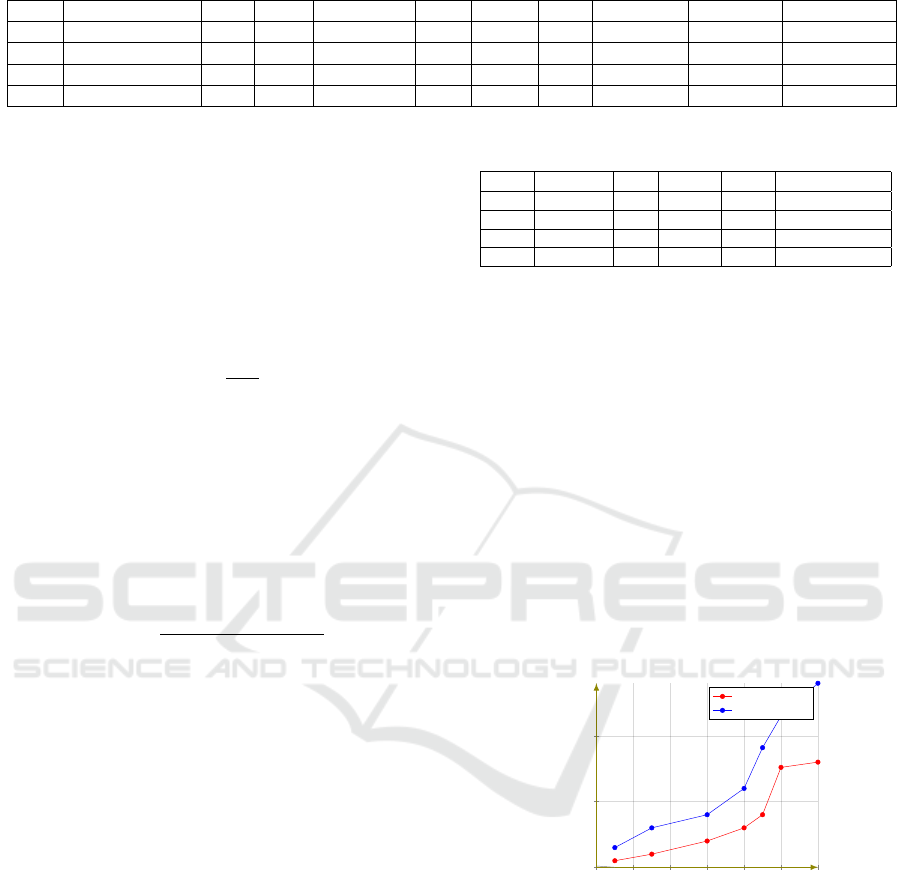
Table 3: The structure of investigated smart grids.
SG |CONS| N
f
|EL| T ReqL
CF
N
RF
N
NRF
N
RS
σ
init
(SG) σ
RB
(SG) σ
Froslr
(SG)
SG
1
34LC+4MC 38 12 2.06 kWh 16 18 3 47.06% 70.58% 85.29%
SG
2
75LC+8MC 83 25 4.25 kWh 41 42 5 49.36% 71.08% 79.51%
SG
3
122LC+28MC 150 54 5.67 kWh 78 72 7 52% 71.33% 78%
SG
4
142LC+38MC 180 65 6.87 kWh 98 62 10 54.44% 72.78% 81.11%
waiting time rate.
4.2.1 Total Availability Rate
-Denoted by σ
SG
-, it represents the rate of the total
number of covered failures thanks to the proposed re-
configuration for integrating a new number of techni-
cal teams and emergency lines, i.e.,
σ
SG
=
N
RF
N
f
(16)
where N
RF
is the number of recovered failures.
4.2.2 Total Waiting Time Rate
-Denoted by ρ
SG
-, it refers to the rate between the ini-
tial and final total waiting time before and after apply-
ing the new reconfiguring strategy, i.e.,
ρ
SG
=
TW T
END
(SFL(SG))
TW T
init
(SFL(SG))
(17)
where TW T
init
(SFL(SG)) refers to the initial total
waiting time and TW T
END
(SFL(SG)) refers to the
waiting time after applying the new heuristic.
In case study, we have σ
SG
= 80% and ρ
SG
= 47%.
In order to reduce the number of non-recovered fail-
ures through smart grids, an experimental study is
applied to four real meshed power networks of the
Tunisian power systems cited in (Ziouche et al.,
2019b). They have different sizes: SG
1
and SG
2
are
two small smart grids, SG
3
is a medium one, and SG
4
is large. They include different numbers of electri-
cal components and lines, the structure of this power
grids is investigated completely in Table 3 by defining
(i) the number of consumers |CONS|, (ii) the num-
ber of existing emergency lines |EL|, (iii) the num-
ber of recorded failures N
f
, (iv) the total required
load of critical failures T ReqL
CF
, (v) N
RF
is the num-
ber of recovered failures, (vi) N
NRF
is the number of
non-recovered failures, and (vii) N
RS
is the number
of available renewable sources in the smart grid (e.g.,
SG
2
is a small smart grid, it includes 83 consumers,
the number of recovered consumers in smart grid is
about 41 and non-recovered is 42, and the number of
existing renewable sources is 5).
Table 4: The structure of simulated smart grids by SGREP.
SG |EL
new
| N
tt
N
NRS
N
RF
σ
SGREP
(SG)
SG
1
13 5 9 28 87.8%
SG
2
20 7 12 61 81.49%
SG
3
28 10 18 110 83.33%
SG
4
36 12 21 135 85%
Table 4 represents the structure of simulated smart
grids using the software tool SGREP, we define (i)
the new number of emergency lines |EL
new
|, (ii)
the predicted number of technical teams N
tt
, (iii)
the new number of recovered failures N
RF
, and (iv)
the integrated number of renewable sources through
FROSLR N
NRS
. The addition of emergency lines and
technical teams allow to enhance the power avail-
ability rate (e.g., SG
2
needs a total required load of
4.25 kWh, where the number of new added renew-
able sources is 12, it permits to integrate 20 renewable
sources and 7 technical teams: N
Tech
=4 and N
Exp
=3.
Thanks to proposed reconfiguration, we remark an in-
creasing in term of total availability rate from 85.29%
to 87.8%, besides a reduction in the term of waiting
time to 48%).
0 2 4
6
8 10 12
0
50
100
Simulation time(per Month)
Money cost in (10
3
$)
without SGREP
with SGREP
Figure 3: Financial gains due to SGREP simulator.
Moreover, The prediction of the number of technical
teams increases the number of fixed failures. Fig-
ure 3 shows a comparative study in term of the fi-
nancial cost before and after applying the reconfig-
uration. We identify a remarked increasing to more
than 135 ∗ 10
3
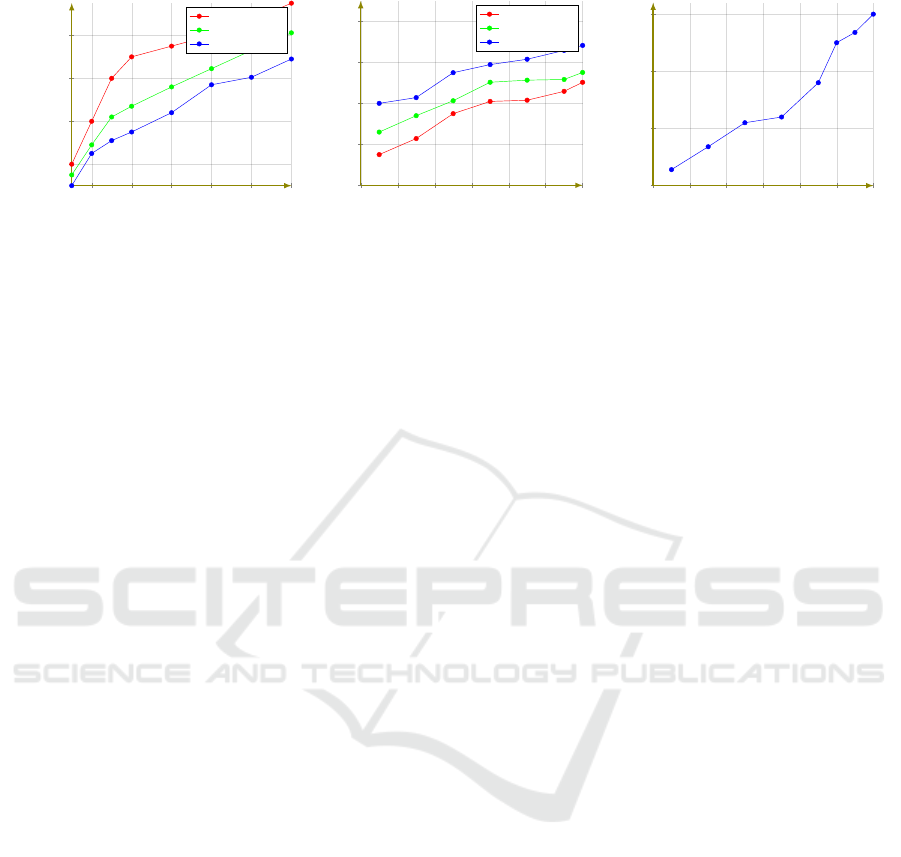
$ per year. Figure 4a represents the
cumulative waiting time of clients during the inter-
vention of technical teams, it reports a comparison
of the waiting times using SGCS-RB, FROSLR and
SGREP. Thereby, we supervise a remarked reduction
in the term of waiting time. Figure 4b compares the
growth in term of the total availability of energy dur-
ENASE 2020 - 15th International Conference on Evaluation of Novel Approaches to Software Engineering
388
2 4
6
8 10 12
20
40
60
80
Simulation time(per Month)
Total waiting time ρ(SG)(h)
cumulative waiting time
with SGCS-RB
with FROSLR
with SGREP
(a) Total waiting time reduction.
0 2 4
6
8 10 12
20
40
60
80
100
Simulation period (per Month)
Total availability σ(SG)(%)
Total availability performance evaluation
with SGCS-RB
with FROSLR
with SGREP
(b) Total availability enhancement.
0 2 4
6
8 10 12
0
50
100
150
Simulation time(per Month)
Renewable energy (kWh)
Emergency lines performance evaluation in Tunis
(c) Emergency lines number increasing.
Figure 4: Performance Evaluation due to Reconfiguring Simulator SGREP.
ing failures recovery in SG
1
after applying different
contributions. Thus, the addition of the new num-
ber of emergency lines coming from added renewable
sources allows for increasing the recovery of failures.
Figure 4c shows the annual increase of use of renew-
able sources by integrating a new number of emer-
gency lines that allow to better enhance the recovery
of the power network. So that, the implemented sim-
ulator SGREP helps electricity markets to satisfy the
recovery and maintenance of recorded critical failures
and encourages the use of renewable sources.
Furthermore, SGREP permits to improve the per-
formed rates in term of power availability and total
waiting time thanks to implemented prediction model.
5 CONCLUSIONS
To guarantee the accurate integrated numbers of tech-
nical teams and emergency lines for best improve-
ment of failures recovery and maintenance in smart
grids, we have proposed a reconfiguration approach
that permits to predict the integrated number of ex-
pert and technician teams, besides the addition of a
new number of emergency lines which allows increas-
ing the total availability of energy during interruptions
and outages of more than 2% with the reduction of
total waiting time without energy to the half. This
approach permits to reduce economic losses during
blackouts. In the future work, we aim to secure trans-
mitted data in the smart grid proposed architecture,
beside verifying formally the proposed strategies.
REFERENCES
Abidi, M., Ben Smida, M., Khalgui, M., Li, Z., and Wu, N.
(2017). Multi agent oriented solution for forecasting
based control strategy with load priority of microgrids
in an island mode case study: Tunisian petroleum plat-
form. Electric Power Systems Research, 152:411–
423.
Ben Meskina, S., Doggaz, N., Khalgui, M., and Li, Z.
(2016). Multiagent framework for smart grids recov-
ery. IEEE SMC, 47:1284–1300.
Ben Meskina, S., Doggaz, N., Khalgui, M., and Li, Z.
(2018). Reconfiguration based methodology for im-
proving recovery performance of faults in smart grids.
Information Sciences, 454:73–95.
Bhalshankar, S. S. and Thorat, C. (2016). Integration of
smart grid with renewable energy for energy demand
management: Puducherry case study. pages 1–5.
Ding, Y., Neumann, M. A., Kehri, Ö., Ryder, G., Riedel,
T., and Beigl, M. (2014). From load forecasting to
demand response-a web of things use case. pages 28–
33.
Iqbal, M. N. and Kütt, L. (2018). End-user electricity con-
sumption modelling for power quality analysis in res-
idential building. pages 1–6.
James, J., Hou, Y., Lam, A. Y., and Li, V. O. (2017). In-
telligent fault detection scheme for microgrids with
wavelet-based deep neural networks. IEEE Transac-
tions on Smart Grid, 10(2):1694–1703.
Nefedov, E., Sierla, S., and Vyatkin, V. (2018). Internet of
energy approach for sustainable use of electric vehi-
cles as energy storage of prosumer buildings. Ener-
gies, 11:2165.
Vaidya, N. and Kasturiwale, N. (2016). Application
of quick simplex method on two phase method.
British Journal of Mathematics & Computer Science,
16(1):1–15.
Worighi, I., Maach, A., Hafid, A., Hegazy, O., and
Van Mierlo, J. (2019). Integrating renewable energy
in smart grid system. Sustainable Energy, Grids and
Networks, 18:100226.
Ziouche, L., Ben Meskina, S., Khalgui, M., and Kahloul,
L. (2019a). An optimized linear regression machine
for prediction and integration of renewable sources in
smart grid. ESM, 8(6).
Ziouche, L., Ben Meskina, S., Khalgui, M., Kahloul, L.,
and Li, Z. (2019b). Smart grid rebuilding based on
cloud computing architecture. IEEE SMC, 8(8).
Smart Grid Reconfiguration based on Prediction Model for Technical Teams Intervention Integration and Recovery Enhancement
389
