
Big Data Processing Tools Navigation Diagram
Martin Macak
1,2
, Hind Bangui
1,2
, Barbora Buhnova
1,2
, Andr
´
as J. Moln
´
ar
3,4
and Csaba Istv
´
an Sidl
´
o
4
1
Institute of Computer Science, Masaryk University, Brno, Czech Republic
2
Faculty of Informatics, Masaryk University, Brno, Czech Republic
3
Christian-Albrechts-University Kiel, Computer Science Institute, Kiel, Germany
4
Institute for Computer Science and Control (SZTAKI), Budapest, Hungary
Keywords:
Big Data, Processing Tools, Tool Selection, Navigation Diagram.
Abstract:
Big Data processing has become crucial in many domains because the amount of the produced data has enor-
mously increased almost everywhere. The effective selection of the right Big Data processing tool is hard due
to the high number and large variety of the available state-of-the-art tools. Many research results agree that
there is no one best Big Data solution for all needs and requirements. It is therefore essential to be able to
navigate more efficiently in the world of Big Data processing tools. In this paper, we present a map of current
Big Data processing tools, recommended according to their capabilities and advantageous properties identi-
fied in previously published academic benchmarks. This map—as a navigation diagram—is aimed at helping
researchers and practitioners to filter a large amount of available Big Data processing tools according to the
requirements and properties of their tasks. Additionally, we provide recommendations for future experiments
comparing Big Data processing tools, to improve the navigation diagram.
1 INTRODUCTION
Several domains, such as the Internet of Things (IoT),
smart grids, e-health, and transportation (Oussous
et al., 2018a), have to deal with the phenomenon of
Big Data, with its large data volume, great variety,
and the speed with which the data is being gener-
ated (Fang et al., 2015a). Big Data tools are used, for
example, in data mining, machine learning, predictive
analytics, and statistics, supporting numerous differ-
ent software tasks (Oussous et al., 2018b). Software
engineers integrate Big Data tools and techniques in
their systems on an increasingly common basis. How-
ever, the proper selection of the right Big Data pro-
cessing tool for the given problem is a tedious task,
due to the number and variety of the available solu-
tions.
Practitioners, as well as researchers, would highly
benefit from aiding navigation among the tools, sum-
marizing the knowledge about which processing tool
is better in specific situations. Based on the proper-
ties of their problem, practitioners would be able to
navigate to the suitable solution more easily, using a
visual, easily readable diagram.
Although some help for such a diagram can be
found in Big Data surveys, these do not focus primar-
ily on tools and technologies, but rather on algorithms
and approaches used to process Big Data. When Big
Data processing tools are included in the compari-
son (G
¨
okalp et al., 2017a; Oussous et al., 2018b),
the comparison is still on the level of tool features
rather than tool effectiveness and efficiency on realis-
tic problems. In (Gessert et al., 2017), a decision tree
mapping requirements to NoSQL databases is pro-
vided for the context of Big Data storage, based on
theoretical knowledge. These attempts towards a de-
cision tree of Big Data processing tools are missing
so far, and practitioners hence need to study various
benchmarks to gain insight.
In this paper, we aim at creating a navigation di-
agram for Big Data processing tools, whose purpose
is to visualize the findings of existing benchmarks of
Big Data processing tools, visualizing the findings of
previous related comparative research papers. The
main contribution of this diagram is that it aids re-
searchers and practitioners to navigate among many
different Big Data processing tools and help them to
find a candidate which best fits the requirements.
The remainder of the paper is structured as fol-
lows. Section 2 discusses the state of the art and
related work. Then, in Section 3, we describe the
methodology used for this research. Section 4 con-
304
Macak, M., Bangui, H., Buhnova, B., Molnár, A. and Sidló, C.
Big Data Processing Tools Navigation Diagram.
DOI: 10.5220/0009406403040312
In Proceedings of the 5th International Conference on Internet of Things, Big Data and Security (IoTBDS 2020), pages 304-312
ISBN: 978-989-758-426-8
Copyright
c
2020 by SCITEPRESS – Science and Technology Publications, Lda. All rights reserved

tains and describes the Big Data processing tool nav-
igation diagram. In Section 5, we discuss the results
and provide recommendations for future experiments,
aiming at enhancing the quality of the diagram. Sec-
tion 6 describes threats to validity of the presented
diagram. Finally, Section 7 concludes the paper by
summarizing the results and outlining future work.
2 RELATED WORK
Big data tools are recently being developed so rapidly
that maintaining a list of available tools and choosing
the best option for a sophisticated Big Data problem
is a very complicated and lengthy task. We can see it,
for example, in an application-oriented landscape of
current solutions (Turck, 2019). To explore genuinely
how current research results support this process, we
have selected the surveys that focus on reviewing and
comparing Big Data tools.
Based on examining the related surveys (Table 1),
we found that the Big Data ecosystem is plentiful, and
there is no one solution that would meet all needs,
imposing robust interoperability between the existing
Big Data solutions. In other words, beyond the choice
of a particular Big Data tool for a given problem, it is
essential to be able to navigate towards best fitting Big
Data tools. For example, in (Gessert et al., 2017), the
authors created a decision tree that might help with
navigation among Big Data storage options, specifi-
cally NoSQL databases. The practitioners can filter
the significant number of storage tools based on their
requirements on the database. However, this compar-
ison is only in the context of Big Data storage, and the
results are solely based on theoretical knowledge, not
supported by experiments.
On the other hand, based on our review, we have
found that the existing works do not provide clear
guidelines recommending Big Data tools. For ex-
ample, in (G
¨
okalp et al., 2017b), the authors have
provided a comprehensive review of open source Big
Data tools, with an attempt to propose a strategy to
choose suitable Big Data tools based on a list of crite-
ria, which are: computation time, data size, interoper-
ability, and data storage model. However, the authors
found that it is crucial to decide which tool is most
suitable for the inherent characteristics and require-
ments of a given Big Data problem since most of the
open source Big Data tools are implemented based on
their breakthrough publications. Likewise, in (Ulusar
et al., 2020), the authors have considered the trade-
offs that exist between usability, performance, and al-
gorithm selection when reviewing different Big Data
solutions. They have noticed that there is no single
Table 1: Big Data tools survey papers.
Category of
survey
Papers
General
(Ramadan, 2017)
(G
¨
okalp et al., 2017a)
(Oussous et al., 2018b)
(Fang et al., 2015b)
(Acharjya and Ahmed,
2016)
Storage
(Mazumdar et al., 2019)
(Corbellini et al., 2017)
(Gessert et al., 2017)
(Almassabi et al., 2018)
(Siddiqa et al., 2017)
(Lourenc¸o et al., 2015)
(Płuciennik and Zgorzałek,
2017)
(Makris et al., 2016)
(Chen et al., 2014)
Processing
(Oussous et al., 2018a)
(Ulusar et al., 2020)
(Landset et al., 2015)
(Habeeb et al., 2019)
(Inoubli et al., 2018)
(Liu et al., 2014)
Visualization (Raghav et al., 2016)
framework that covers all or even the majority of Big
Data processing tasks. Furthermore, the majority of
tools focuses on solving the data processing require-
ments without considering the scalability issues. The
setting of the guidelines hence remains problematic.
In this paper, we take a different approach, fo-
cusing on the visualization of the findings of existing
benchmarks among Big Data processing tools, given
various problems and properties. Despite the great
academic efforts (Table 1), we have not found any
research paper summarizing and visualizing the Big
Data processing tool benchmarks. The selected pa-
pers (Table 1) have focused on providing a compre-
hensive review of available Big Data tools and ana-
lyzing the general advantages and drawbacks of each
tool. They do not give clear guidance in Big Data
tool selection that would help developers to under-
stand how to use Big Data tools together to build a
robust architecture capable of processing Big Data ef-
ficiently and effectively.
3 METHODOLOGY
In this section, we describe the step-by-step process
of building the visual representation of the identified
benchmarks into a so-called navigation diagram. The
process is illustrated in Figure 1.
First, we identified the relevant benchmark papers
by searching academic databases and well-known
Big Data Processing Tools Navigation Diagram
305

Identify
benchmark
papers
Design
categories
Assign
papers into
categories
Extract
tools from
papers
Extract
results from
papers
Build
navigation
diagram
Figure 1: Methodology of this work.
publishers such as ScienceDirect, Google Scholar,
ACM Digital Library, IEEE Xplore Digital Library,
Springer as well as general Google search with these
keywords: Big Data (processing OR machine learn-
ing) tools (benchmark OR performance comparison
OR performance evaluation OR case study compari-
son). We limited our search to the papers published in
the last five years, which is from 2014 to 2019. The
search resulted in papers that compare two or more
Big Data processing tools by experiments. A detailed
description of the experiments and results needs to ex-
ist in the papers. We paid special attention to the pa-
pers that compare several Big Data processing tools.
In total, 24 papers ended up in the selection.
In the next step, we have grouped the papers
into categories reflecting their purpose (the domain
of Big Data processing). As the basis for the cat-
egories, we have used the approach by Sakr (Sakr,
2016), which suggests grouping Big Data processing
tools into general-purpose, SQL, graph processing,
and stream processing categories. General-purpose
processing systems were designed for multiple types
of data processing scenarios (e.g., batch, stream, and
graph processing). SQL systems provide a high-level
declarative language for easier querying of structured
data. Graph processing systems were designed for
large-scale graph processing, and stream processing
systems can process streams of Big Data.
In our classification, we have adopted three cate-
gories from (Sakr, 2016), which are stream process-
ing, graph processing, and SQL systems. Moreover,
we have added the machine learning category because
of its popularity in Big Data processing and also its
occurrence in comparison benchmarks. As each iden-
tified benchmark could be assigned to a single pur-
pose (category), there was no need for the general-
purpose category. Instead, each general-purpose tool
might be included in multiple categories. Moreover,
as some papers are comparing tools on large static
data, we added the batch processing category. There-
fore, we ended up with five categories: batch process-
ing, stream processing, graph processing, SQL, and
machine learning.
Then we assigned the found papers into de-
signed categories and extracted the tools that were
compared in each paper. These tools are Hadoop
MapReduce, Spark, Flink, Storm, Giraph, Hama,
GraphChi, GraphLab, GraphX, Pregel, Pregel+,
GPS, Mizan, Impala, Hive, Spark SQL, HAWQ,
Drill, Pesto, Pheonix, Mahout, MLlib, TensorFlow,
H2O, SAMOA, Theano, Torch, Caffe, CNTK, and
Deeplearning4j. The list of extracted tools for each
categorized paper can be found in Table 2. Then we
extracted the results of those papers, specifically the
list of triplets that contain the information about the
tool that outperformed the other, the tool that fell be-
hind, and the feature driving the experiment. One pa-
per could result in multiple of these triplets. For ex-
ample, in (Chintapalli et al., 2016), Flink had better
latency than Spark, Spark had better throughput than
Storm, etc. From this information, we were able to
build the navigation diagram presented in Section 4.
The complete data that were used for the construction
of this diagram can be found in Appendix.
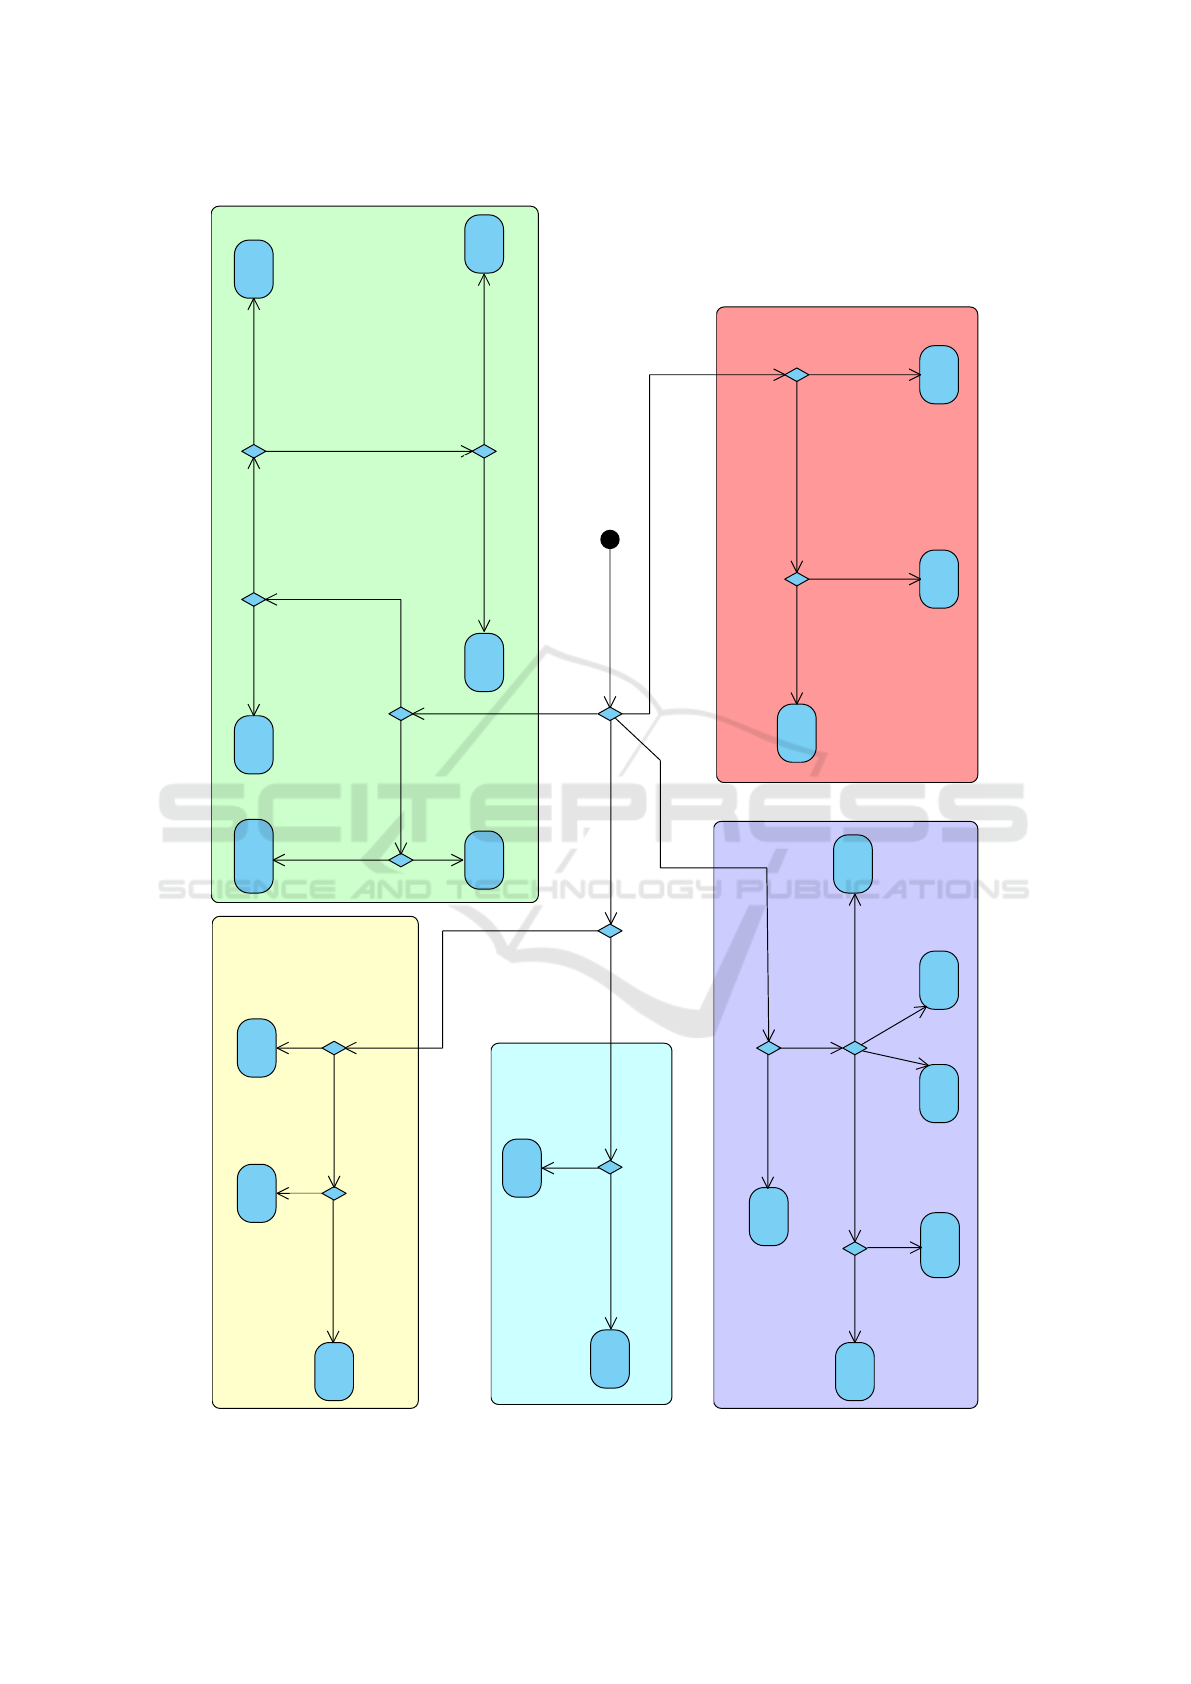
4 PROCESSING TOOLS
NAVIGATION DIAGRAM
This chapter contains the map of the results based on
the current knowledge from benchmarks of Big Data
processing tools, in the form of a diagram. This di-
agram (in Figure 2) can be used to filter the possi-
ble Big data processing tools for a given Big Data
problem. The practitioners can navigate through it,
and based on the features of a given problem, can see
which tools might be relevant.
The diagram is illustrated as follows. The black
dot is the initial node, diamonds are decision nodes,
and arrows represent the control flow. The labels of
the arrows navigate towards the tool that outperforms
another in that characteristic according to a bench-
mark cited within the label. Each labeled arrow is
supported by a published benchmark. The citation
number within the label corresponds to the number
of the paper in Table 2. Note that papers with num-
bers 8 and 9 are not included in the diagram because
their results are not strong enough to be relevant for
the diagram. Unlabeled arrows navigate directly to
the linked tools (meaning that at that point, the tool
is the best solution according to literature). If more
benchmarks represented with arrows from the same
decision node contradict each other, we put the papers
with the opposite results on these arrows in parenthe-
ses (as visible in the stream processing part).
The user can traverse this diagram and end up with
multiple candidates for the solution of a given prob-
IoTBDS 2020 - 5th International Conference on Internet of Things, Big Data and Security
306
TensorFlow
MLlib
Storm
Spark
Theano
SAMOA
Mahout
H2O
Flink
Flink
Impala
HAWQ
Presto
Giraph
GraphX
Hama
GPS
GraphLab
Pregel+
Spark
latency, throughput [6]
performance [5,7]
performance [13]
latency [1, 4]
performance [11]
scalability [10]
speed [10, 12]
latency [12]
memory efficiency [12]
performance [7, 10, 11, 13, 14]
performance [17]
performance [15, 16, 18]
performance on
~30 GB dataset [15]
latency [1, 4],
(throughput [3])
performance, scalability [2],
fault tolerance [3, 4],
(throughput [1, 4])
throughput [1, 3, 4]
graph processing
SQL
batch processing
coverage [21], performance [22]
extensibility, scalability, usability,
fault tolerance, speed [19]
extensibility, scalability, usability,
speed [19, 21], maturity [20, 22]
coverage [21]
fault tolerance [19]
accuracy,
complexity [23]
flexibility [22]
stream processing
extensibility, scalability,
usability, speed [19]
latency [20]
machine learning
performance [24]
Figure 2: Big Data Processing Tools Navigation Diagram.
Big Data Processing Tools Navigation Diagram
307

Table 2: The benchmarks of processing tools.
# Paper Category List of compared tools
1 (Chintapalli et al., 2016) stream Spark, Flink, Storm
2 (Veiga et al., 2016) stream Hadoop MapReduce, Spark, Flink
3 (Lopez et al., 2016) stream Spark, Storm, Flink
4 (Qian et al., 2016) stream Spark, Storm
5 (Verma and Patel, 2016) batch Hadoop MapReduce, Spark
6 (Samadi et al., 2016) batch Hadoop MapReduce, Spark
7 (Marcu et al., 2016) batch / graph Spark, GraphX, Flink
8 (Koschel et al., 2016) graph Giraph, Hadoop MapReduce
9 (Lu and Thomo, 2016) graph Giraph, GraphChi
10 (Siddique et al., 2016) graph Giraph, Hama
11 (Batarfi et al., 2015) graph Giraph, GraphChi, GraphLab, GraphX, GPS
12 (Han et al., 2014) graph Giraph, GraphLab, Pregel, GPS, Mizan
13 (Lu et al., 2014) graph Giraph, GraphChi, GraphLab, Pregel+, GPS
14 (Wei et al., 2016) graph GraphLab, Spark
15 (Rodrigues et al., 2019) SQL Impala, Hive, Spark, HAWQ, Drill, Presto
16 (Qin et al., 2017) SQL Impala, Hive, Spark SQL
17 (Santos et al., 2017) SQL Hive, Spark, Drill, Presto
18 (Tapdiya and Fabbri, 2017) SQL Impala, Spark SQL, Drill, Phoenix
19 (Richter et al., 2015) ML Mahout, MLlib, H2O, SAMOA
20 (Aziz et al., 2018) ML Mahout, MLlib
21 (Landset et al., 2015) ML Mahout, MLlib, H2O, SAMOA
22 (Kochura et al., 2017) ML TensorFlow, H2O, Deeplearning4j
23 (Kovalev et al., 2016) ML Tensorflow, Theano, Torch, Caffe, Deeplearning4j
24 (Shatnawi et al., 2018) ML TensorFlow, Theano, CNTK
lem. For the more comfortable usability of this di-
agram, we provide the list of the used features and
their descriptions in Table 3.
5 DISCUSSION
The most commonly used Big Data tools in bench-
marks are Spark for batch and stream processing, Gi-
raph for graph processing, Impala for querying, and
Mahout, MLlib, and TensorFlow for machine learn-
ing. That might also indicate that these tools are pop-
ular among scholars, or they are easy to run and oper-
ate.
The category of graph processing has the most
comparative papers published, while batch process-
ing and SQL systems are less frequent. Regarding the
years, the majority of benchmarks were performed in
2016. Then, only four benchmarks were published in
2017, two in 2018, and one in 2019.
The diagram consists of five areas corresponding
to the categories discussed in Section 3: batch pro-
cessing, stream processing, graph processing, SQL,
and machine learning. The smallest and the least
complicated parts are batch processing and SQL. The
reason might be the lower number of tools tested (in
case of batch processing tools) or that few tools pre-
vail against the many others (in case of SQL sys-
tems). The biggest and the most complex categories
are graph processing and machine learning, contain-
ing six tools and many choices.
Another observation from the diagram is that the
number of leaves in the diagram is smaller than the
number of Big Data processing tools that were tested
in the benchmark papers. The reason is that the miss-
ing tools did not result as the recommended option in
either of the experiments. Also, the benchmark papers
do not cover all of the available Big Data processing
tools. For example, HPCC, Samza, Gearpump, Beam,
and GraphJet were not covered by any of these papers.
As visible in Table 2, there are not so many re-
search papers comparing Big Data processing tools
based on experiments, therefore some aspects in our
diagram might have a higher level of uncertainty. We
would like to encourage researchers to perform more
experiments in this area, so that the knowledge about
the most suitable Big Data processing tools for each
specific situation might be improved.
We propose the following list of experiments as
future work:
• to compare the tools like Hadoop MapReduce,
Spark, and Flink in batch processing with more
detailed experiments,
• to compare the throughput of Spark and Storm,
because currently there are papers that contradict
each other,
• to compare the general-purpose tools with the spe-
IoTBDS 2020 - 5th International Conference on Internet of Things, Big Data and Security
308
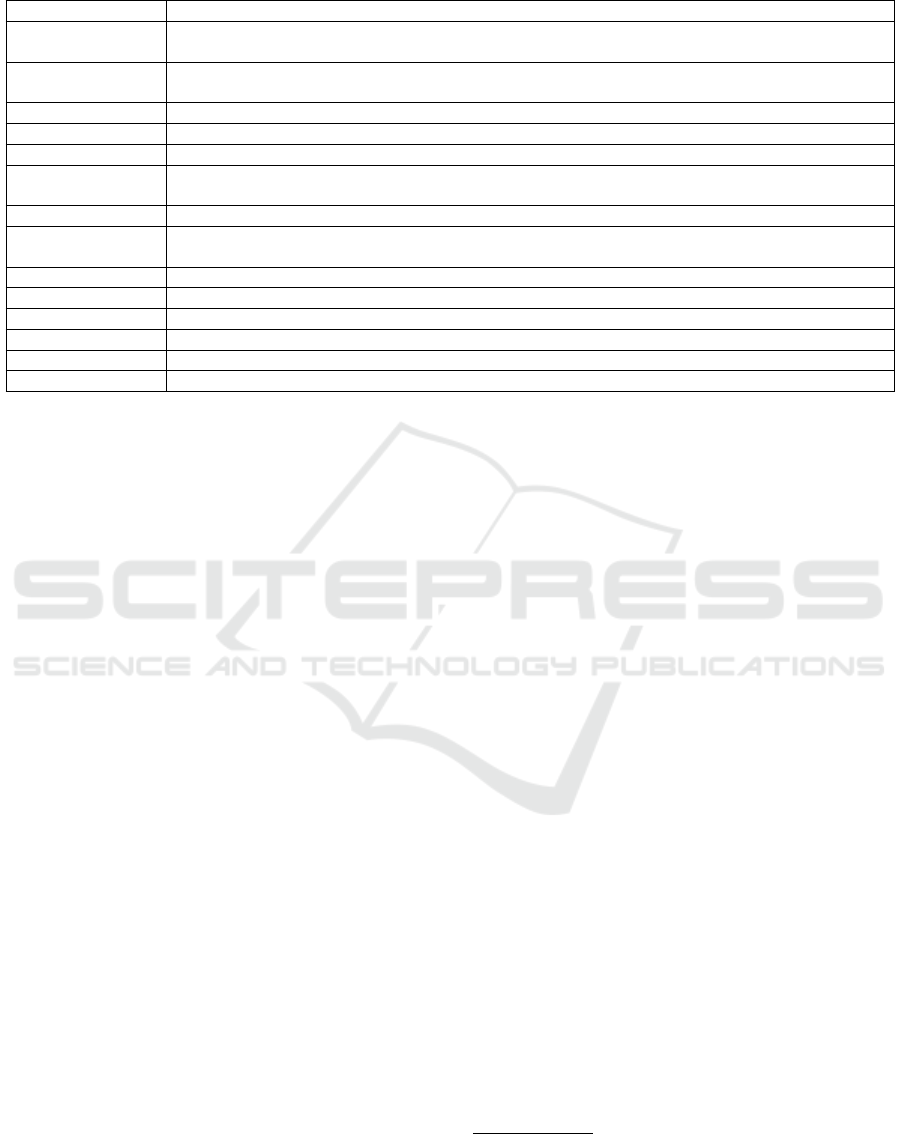
Table 3: Features and their descriptions.
Feature Description
Performance
The ability of a tool to accomplish its functionality within a time-interval. The lower the comple-
tion time (or lower than a certain threshold), the higher the performance of the tool.
Scalability
The ability of a tool to adopt to a given problem size and use its resources effectively as data size
grows.
Fault tolerance The ability of a tool to cope with failures that cause an adverse effect on the entire workflow.
Flexibility The capability of a tool to deal with the changing requirements of data processing.
Accuracy The ability of a tool to produce realistic data values close to the true values modeled.
Complexity
It measures how well the features of a tool are divided into different modules and how to implement
them with other programming interfaces.
Extensibility The ability of a tool to integrate with other frameworks in its totality or partially.
Usability
It describes how the usage of a tool could satisfy users’ requirements, such as the ease of use,
availability of documentation, and programming language interfaces.
Coverage The range of modules contained in a tool and the variety of features of each module.
Maturity The the number of deployments that the tool has obtained.
Speed The execution time needed to accomplish tasks.
Latency The amount of time between starting a task and getting the related outcome.
Throughput The amount of tasks done over a given time period.
Memory efficiency The ability of a tool to handle memory economically as data size grows.
cialized variants (e.g., Flink with graph process-
ing tools),
• to compare the current tools that were not used in
any of the mentioned benchmarks with other vari-
ants (e.g., HPCC in batch processing or Samza in
stream processing),
• to compare the graph processing tools against
each other, specifically Hama, GraphLab,
GraphX, and Pregel+, which were compared to
the other only in one or no paper,
• add more qualitative measures of the tools (e.g., is
it easier to work with Impala or Presto?).
6 THREATS TO VALIDITY
Before concluding the paper, we would like to dis-
cuss the construct validity threats for our diagram.
The benchmarks that we found might not necessar-
ily use the best configuration of the compared tools,
which could influence the results. In addition, there
might be other factors, like the cluster size or hard-
ware specification, which could have an impact on
the results of benchmarks. Moreover, there are miss-
ing experimental comparisons between some tools, so
some parts of the diagram might not be fully repre-
sentative (e.g., the navigation between GraphX and
Pregel+). Furthermore, some transitions in this dia-
gram contradict each other, so further investigation in
this direction is needed (e.g., the navigation between
Spark and Storm).
The fact that Big Data processing tools are evolv-
ing is problematic, while comparisons might use dif-
ferent versions of the same tool. This might lead
to more contradictions. Similarly, if the tools are
tested in different scenarios or on different testbeds,
the results might contradict each other. Although this
clearly indicates that more benchmarks and research
is needed in this direction, to further extend the dia-
gram, we find it valuable that this work has shed light
on these gaps and discrepancies.
Development is so fast in the area that some of
the tools might have changed in the last few years
to a great extent—e.g., the development of Apache
Hama slowed down
1
, GraphLab has become Turi
2
,
and the GraphChi project seems to be abandoned
3
.
These fundamental changes represent another threat,
while research papers tend to react to these changes
slower than industrial resources. As this paper’s fo-
cus is only on academic papers, in the future, it might
be beneficial to extend the diagram by other sources
that can be considered reliable, like technical reports
or weblogs. This extension might increase the accu-
racy of the proposed diagram.
Nevertheless, given all this, we believe that the
presented visualization can be highly beneficial for
researchers as well as practitioners, and stimulate fur-
ther steps and experiments extending the state of the
art.
1
Latest news and releases on http://hama.apache.org are
2016 and 2018 at the time of writing.
2
See https://turi.com.
3
See https://github.com/GraphChi.
Big Data Processing Tools Navigation Diagram
309

7 CONCLUSION
In this paper, we have constructed a Big Data Pro-
cessing Tools Navigation Diagram, which summa-
rizes and illustrates the results of the Big Data pro-
cessing tools benchmarks from 2014 to 2019. We
believe that this first attempt to create such a visual
knowledge summary and tool navigation can help re-
searchers and practitioners to filter a large number
of possible Big Data processing tools for their prob-
lems. We have created this diagram by first identi-
fying proper benchmark papers, then designing five
categories, and assigning the papers to them. After
that, we have extracted tools and results from those
papers, and based on them, constructed the diagram.
We have identified and recommend further possi-
ble comparative experiments still missing from litera-
ture, which would improve this diagram significantly.
We also mentioned several issues in the current ver-
sion of the diagram, which should be addressed in the
future. Furthermore, we believe that it would be ben-
eficial to merge the practical knowledge in this paper
with the theoretical knowledge of selected tools that
could be derived from the survey papers referenced in
Section 2.
ACKNOWLEDGEMENTS
The work was supported from European Regional De-
velopment Fund Project CERIT Scientific Cloud (No.
CZ.02.1.01/0.0/0.0/16 013/0001802).
REFERENCES
Acharjya, D. P. and Ahmed, K. (2016). A survey on big data
analytics: challenges, open research issues and tools.
International Journal of Advanced Computer Science
and Applications, 7(2):511–518.
Almassabi, A., Bawazeer, O., and Adam, S. (2018). Top
newsql databases and features classification. Inter-
national Journal of Database Management Systems
(IJDMS), 10(2):11–31.
Aziz, K., Zaidouni, D., and Bellafkih, M. (2018). Big data
processing using machine learning algorithms: Mllib
and mahout use case. In Proceedings of the 12th Inter-
national Conference on Intelligent Systems: Theories
and Applications, page 25. ACM.
Batarfi, O., Shawi, R. E., Fayoumi, A. G., Nouri, R., Be-
heshti, S.-M.-R., Barnawi, A., and Sakr, S. (2015).
Large scale graph processing systems: survey and
an experimental evaluation. Cluster Computing,
18(3):1189–1213.
Chen, M., Mao, S., and Liu, Y. (2014). Big data: A survey.
Mobile Networks and Applications, 19(2):171–209.
Chintapalli, S., Dagit, D., Evans, B., Farivar, R., Graves,
T., Holderbaugh, M., Liu, Z., Nusbaum, K., Patil, K.,
Peng, B. J., and Poulosky, P. (2016). Benchmark-
ing streaming computation engines: Storm, flink and
spark streaming. In 2016 IEEE International Paral-
lel and Distributed Processing Symposium Workshops
(IPDPSW), pages 1789–1792.
Corbellini, A., Mateos, C., Zunino, A., Godoy, D., and
Schiaffino, S. (2017). Persisting big-data: The nosql
landscape. Information Systems, 63:1 – 23.
Fang, H., Zhang, Z., Wang, C. J., Daneshmand, M., Wang,
C., and Wang, H. (2015a). A survey of big data re-
search. IEEE Network, 29(5):6–9.
Fang, H., Zhang, Z., Wang, C. J., Daneshmand, M., Wang,
C., and Wang, H. (2015b). A survey of big data re-
search. IEEE Network, 29(5):6–9.
Gessert, F., Wingerath, W., Friedrich, S., and Ritter, N.
(2017). Nosql database systems: a survey and deci-
sion guidance. Computer Science - Research and De-
velopment, 32(3):353–365.
G
¨
okalp, M. O., Kayabay, K., Zaki, M., Koc¸yi
˘
git, A., Eren,
P. E., and Neely, A. (2017a). Big-data analytics ar-
chitecture for businesses: a comprehensive review on
new open-source big-data tools. Cambridge Service
Alliance: Cambridge, UK.
G
¨
okalp, M. O., Kayabay, K., Zaki, M., Koc¸yi
˘
git, A., Eren,
P. E., and Neely, A. (2017b). Big-data analytics ar-
chitecture for businesses: a comprehensive review on
new open-source big-data tools. no. October.
Habeeb, R. A. A., Nasaruddin, F., Gani, A., Hashem, I.
A. T., Ahmed, E., and Imran, M. (2019). Real-time
big data processing for anomaly detection: A sur-
vey. International Journal of Information Manage-
ment, 45:289 – 307.
Han, M., Daudjee, K., Ammar, K.,
¨
Ozsu, M. T., Wang,
X., and Jin, T. (2014). An experimental compari-
son of pregel-like graph processing systems. PVLDB,
7:1047–1058.
Inoubli, W., Aridhi, S., Mezni, H., Maddouri, M., and
Nguifo, E. M. (2018). An experimental survey on big
data frameworks. Future Generation Computer Sys-
tems, 86:546 – 564.
Kochura, Y., Stirenko, S., Alienin, O., Novotarskiy, M.,
and Gordienko, Y. (2017). Comparative analysis of
open source frameworks for machine learning with
use case in single-threaded and multi-threaded modes.
In 2017 12th International Scientific and Technical
Conference on Computer Sciences and Information
Technologies (CSIT), volume 1, pages 373–376.
Koschel, A., Heine, F., Astrova, I., Korte, F., Rossow,
T., and Stipkovic, S. (2016). Efficiency experi-
ments on hadoop and giraph with pagerank. In 2016
24th Euromicro International Conference on Parallel,
Distributed, and Network-Based Processing (PDP),
pages 328–331.
Kovalev, V., Kalinovsky, A., and Kovalev, S. (2016). Deep
learning with theano, torch, caffe, tensorflow, and
deeplearning4j: Which one is the best in speed and
accuracy?
Landset, S., Khoshgoftaar, T. M., Richter, A. N., and
Hasanin, T. (2015). A survey of open source tools for
IoTBDS 2020 - 5th International Conference on Internet of Things, Big Data and Security
310

machine learning with big data in the hadoop ecosys-
tem. Journal of Big Data, 2:1–36.
Liu, X., Iftikhar, N., and Xie, X. (2014). Survey of real-time
processing systems for big data. In Proceedings of
the 18th International Database Engineering &
Applications Symposium, IDEAS ’14, pages 356–361,
New York, NY, USA. ACM.
Lopez, M. A., Lobato, A. G. P., and Duarte, O. C. M. B.
(2016). A performance comparison of open-source
stream processing platforms. In 2016 IEEE Global
Communications Conference (GLOBECOM), pages
1–6.
Lourenc¸o, J. R., Cabral, B., Carreiro, P., Vieira, M., and
Bernardino, J. (2015). Choosing the right nosql
database for the job: a quality attribute evaluation.
Journal of Big Data, 2(1):18.
Lu, J. and Thomo, A. (2016). An experimental evaluation
of giraph and graphchi. In 2016 IEEE/ACM Inter-
national Conference on Advances in Social Networks
Analysis and Mining (ASONAM), pages 993–996.
Lu, Y., Cheng, J., Yan, D., and Wu, H. (2014). Large-scale
distributed graph computing systems: An experimen-
tal evaluation. Proceedings of the VLDB Endowment,
8(3):281–292.
Makris, A., Tserpes, K., Andronikou, V., and Anagnos-
topoulos, D. (2016). A classification of nosql data
stores based on key design characteristics. Procedia
Computer Science, 97:94 – 103. 2nd International
Conference on Cloud Forward: From Distributed to
Complete Computing.
Marcu, O., Costan, A., Antoniu, G., and P
´
erez-Hern
´
andez,
M. S. (2016). Spark versus flink: Understanding per-
formance in big data analytics frameworks. In 2016
IEEE International Conference on Cluster Computing
(CLUSTER), pages 433–442.
Mazumdar, S., Seybold, D., Kritikos, K., and Verginadis,
Y. (2019). A survey on data storage and placement
methodologies for cloud-big data ecosystem. Journal
of Big Data, 6(1):15.
Oussous, A., Benjelloun, F.-Z., Lahcen, A. A., and Belfkih,
S. (2018a). Big data technologies: A survey. Journal
of King Saud University - Computer and Information
Sciences, 30(4):431 – 448.
Oussous, A., Benjelloun, F.-Z., Lahcen, A. A., and Belfkih,
S. (2018b). Big data technologies: A survey. Journal
of King Saud University - Computer and Information
Sciences, 30(4):431 – 448.
Płuciennik, E. and Zgorzałek, K. (2017). The multi-model
databases – a review. In Kozielski, S., Mrozek, D.,
Kasprowski, P., Małysiak-Mrozek, B., and Kostrzewa,
D., editors, Beyond Databases, Architectures and
Structures. Towards Efficient Solutions for Data Anal-
ysis and Knowledge Representation, pages 141–152,
Cham. Springer International Publishing.
Qian, S., Wu, G., Huang, J., and Das, T. (2016). Bench-
marking modern distributed streaming platforms. In
2016 IEEE International Conference on Industrial
Technology (ICIT), pages 592–598.
Qin, X., Chen, Y., Chen, J., Li, S., Liu, J., and Zhang,
H. (2017). The performance of sql-on-hadoop sys-
tems - an experimental study. In 2017 IEEE Inter-
national Congress on Big Data (BigData Congress),
pages 464–471.
Raghav, R. S., Pothula, S., Vengattaraman, T., and Ponnu-
rangam, D. (2016). A survey of data visualization
tools for analyzing large volume of data in big data
platform. In 2016 International Conference on Com-
munication and Electronics Systems (ICCES), pages
1–6.
Ramadan, R. (2017). Big data tools-an overview. Inter-
national Journal of Computer Science and Software
Engineering, 2.
Richter, A. N., Khoshgoftaar, T. M., Landset, S., and
Hasanin, T. (2015). A multi-dimensional comparison
of toolkits for machine learning with big data. In 2015
IEEE International Conference on Information Reuse
and Integration, pages 1–8. IEEE.
Rodrigues, M., Santos, M. Y., and Bernardino, J. (2019).
Experimental evaluation of big data analytical tools.
In Themistocleous, M. and Rupino da Cunha, P., ed-
itors, Information Systems, pages 121–127, Cham.
Springer International Publishing.
Sakr, S. (2016). Big data 2.0 processing systems: a survey.
Springer.
Samadi, Y., Zbakh, M., and Tadonki, C. (2016). Compara-
tive study between hadoop and spark based on hibench
benchmarks. In 2016 2nd International Conference
on Cloud Computing Technologies and Applications
(CloudTech), pages 267–275.
Santos, M. Y., Costa, C., Galv
˜
ao, J. a., Andrade, C., Mart-
inho, B. A., Lima, F. V., and Costa, E. (2017). Evalu-
ating sql-on-hadoop for big data warehousing on not-
so-good hardware. In Proceedings of the 21st Inter-
national Database Engineering & Applications Sym-
posium, IDEAS 2017, page 242–252, New York, NY,
USA. Association for Computing Machinery.
Shatnawi, A., Al-Bdour, G., Al-Qurran, R., and Al-Ayyoub,
M. (2018). A comparative study of open source deep
learning frameworks. In 2018 9th International Con-
ference on Information and Communication Systems
(ICICS), pages 72–77.
Siddiqa, A., Karim, A., and Gani, A. (2017). Big data stor-
age technologies: a survey. Frontiers of Information
Technology & Electronic Engineering, 18(8):1040–
1070.
Siddique, K., Akhtar, Z., Yoon, E. J., Jeong, Y., Dasgupta,
D., and Kim, Y. (2016). Apache hama: An emerging
bulk synchronous parallel computing framework for
big data applications. IEEE Access, 4:8879–8887.
Tapdiya, A. and Fabbri, D. (2017). A comparative analysis
of state-of-the-art sql-on-hadoop systems for interac-
tive analytics. In 2017 IEEE International Conference
on Big Data (Big Data), pages 1349–1356.
Turck, M. (2019). A turbulent year: The 2019 data &
ai landscape. https://mattturck.com/Data2019/. Ac-
cessed: 2019-12-20.
Ulusar, U. D., Ozcan, D. G., and Al-Turjman, F. (2020).
Open source tools for machine learning with big data
in smart cities. In Smart Cities Performability, Cogni-
tion, & Security, pages 153–168. Springer.
Veiga, J., Exp
´
osito, R. R., Pardo, X. C., Taboada, G. L.,
and Tourifio, J. (2016). Performance evaluation of
Big Data Processing Tools Navigation Diagram
311
big data frameworks for large-scale data analytics. In
2016 IEEE International Conference on Big Data (Big
Data), pages 424–431.
Verma, J. P. and Patel, A. (2016). Comparison of mapre-
duce and spark programming frameworks for big data
analytics on hdfs. International Journal of Computer
Science & Communication, 7(2).
Wei, J., Chen, K., Zhou, Y., Zhou, Q., and He, J. (2016).
Benchmarking of distributed computing engines spark
and graphlab for big data analytics. In 2016 IEEE Sec-
ond International Conference on Big Data Computing
Service and Applications (BigDataService), pages 10–
13.
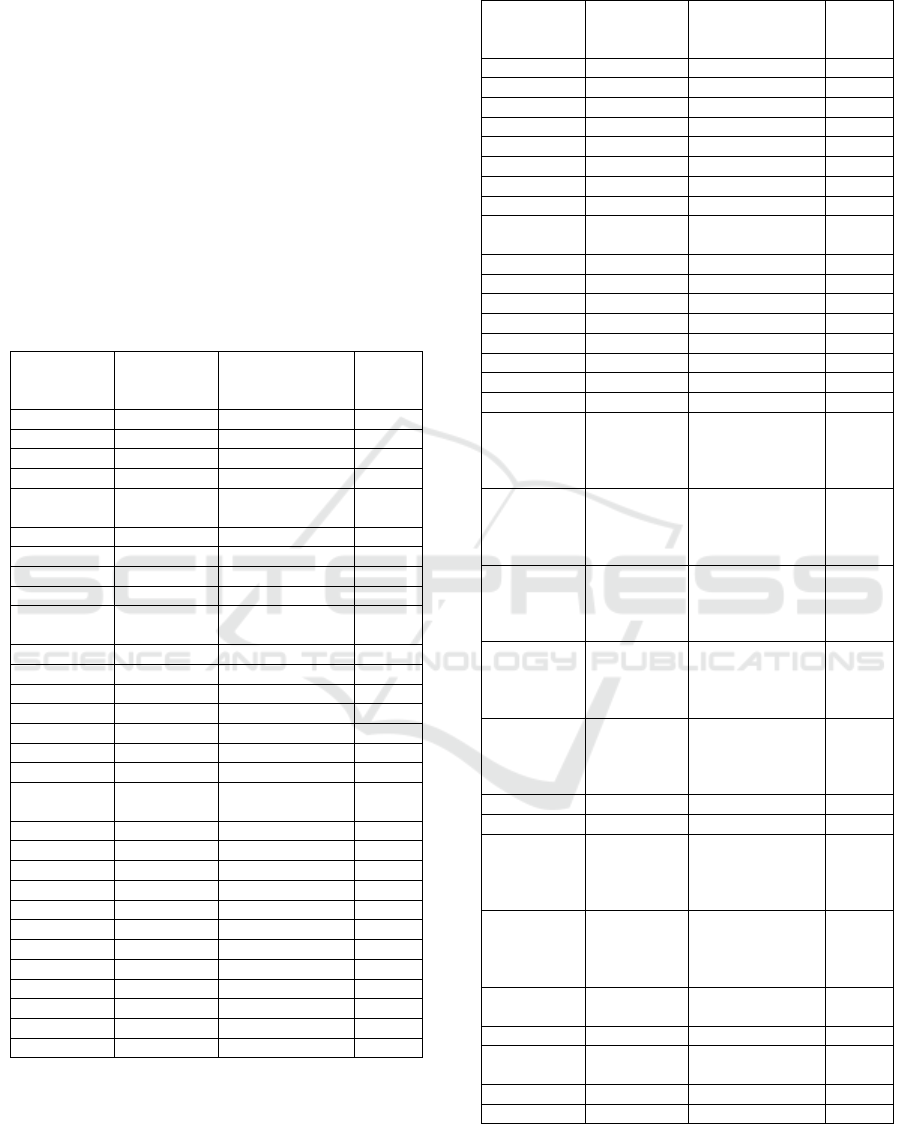
APPENDIX
Table 4: Results from the benchmarks.
Tool that
performed
better
Tool that fell
behind
Mentioned factors
of the comparison
# of
paper
Storm Spark latency 1
Flink Spark latency 1
Spark Storm throughput 1
Spark Flink throughput 1
Spark Flink
performance,
scalability
2
Storm Flink throughput 3
Storm Spark throughput 3
Spark Storm fault tolerance 3
Spark Flink fault tolerance 3
Spark Storm
fault tolerance,
throughput
4
Storm Spark latency 4
Spark Hadoop perfomance 5
Spark Hadoop latency, throughput 6
GraphX Flink performance 7
Flink Spark performance 7
Giraph Hadoop performance 8
Giraph GraphChi performance 9
Hama Giraph
performance,
scalability, speed
10
GraphX GraphChi performance 11
GraphX Giraph performance 11
GraphX GPS performance 11
GraphX GraphLab performance 11
GPS Giraph memory efficiency 12
GPS GraphLab memory efficiency 12
GPS Mizan memory efficiency 12
Giraph GraphLab latency 12
Giraph GPS latency 12
Giraph Mizan latency 12
GraphLab Giraph speed 12
GraphLab GPS speed 12
Table 4: Results from the benchmarks (cont.).
Tool that
performed
better
Tool that fell
behind
Mentioned factors
of the comparison
# of
paper
GraphLab Mizan speed 12
Pregel+ Giraph performance 13
GPS GraphLab performance 13
Pregel+ GraphLab performance 13
GPS Giraph performance 13
GraphLab Spark performance 14
Impala HAWQ performance 15
Impala Hive performance 15
HAWQ Impala
performance on 30
GB dataset
15
Impala Hive speed 16
Impala Spark SQL speed 16
Presto Hive performance 17
Presto Spark SQL performance 17
Presto Drill performance 17
Impala Drill performance 18
Impala Spark SQL performance 18
Impala Phoenix performance 18
Mahout MLlib
extensibility,
scalability, usability,
fault tolerance,
speed
19
H2O SAMOA
extensibility,
scalability, usability,
fault tolerance,
speed
19
MLlib SAMOA
extensibility,
scalability, usability,
fault tolerance,
speed
19
Mahout SAMOA
extensibility,
scalability, usability,
fault tolerance,
speed
19
Mahout H2O
extensibility,
scalability, usability,
fault tolerance,
speed
19
MLlib Mahout latency 20
Mahout MLlib stability, maturity 20
H2O MLlib
speed, usability,
scalability,
coverage,
extensibility
21
SAMOA Mahout
speed, usability,
scalability,
extensibility,
coverage
21
H2O Deeplearning4j
performance,
maturity
22
TensorFlow Deeplearning4j flexibility 22
Theano Deeplearning4j
speed, accuracy,
complexity
23
TensorFlow CNTK performance 24
Theano CNTK performance 24
IoTBDS 2020 - 5th International Conference on Internet of Things, Big Data and Security
312
