
Network Traffic Characterization in the Control Network of OpenStack
based on Virtual Machines State Changes
Adnei W. Donatti
a
, Guilherme P. Koslovski
b
, Maur
´
ıcio A. Pillon
c
and Charles C. Miers
d
Graduate Program in Applied Computing (PPGCA), Santa Catarina State University (UDESC), Brazil
Keywords:
Cloud Computing, OpenStack, Network Traffic, Characterization.
Abstract:
The adoption of private clouds is an option for optimizing the use and organization of computing resources.
Although the cloud benefits are been known for some time, there are still questions on how to plan the cloud
infrastructure in order to avoid basic network performance issues. OpenStack is one of the most widely used
open source solutions for building private Infrastructure as a Service (IaaS) clouds. OpenStack distributes
network traffic across multiple interfaces and virtualized networks, which connect hosts to its cloud services,
divided into the domains: control, public, or guest. The present work aims to characterize network traffic in the
OpenStack control domain produced by changing the state of virtual machines (VMs). There are few works
related to the network infrastructure scenario on private clouds, research in this area is generally focused on
public domain or guest domain operations. In this sense, we performed a characterization in the OpenStack
administrative network. In order to perform OpenStack network characterization, experimentation methods
were used to identify operating services as well as to measure network traffic in the OpenStack control domain
during a set of common operations in VMs.
1 INTRODUCTION
Private cloud computing operates on its own infras-
tructure, maintained by the organization which owns
it. Thus, all cloud maintenance as well as the secu-
rity / performance aspects are responsibility of this
organization. In addition, private clouds aims to meet
the necessities of the owner organization, and are ac-
cessible only by authorized users, ensuring the orga-
nization control over its resources (Jadeja and Modi,
2012). In this context, network traffic analysis / char-
acterization is relevant to discover information re-
garding to cloud security and performance.
OpenStack in an open source software which al-
lows to create and manage private or public IaaS
clouds. IaaS private clouds using OpenStack typically
have VMs as their base unit, but it also available con-
tainer and bare metal capabilities. Inside the cloud
provider’s infrastructure, multiple network interfaces
and virtualized networks are employed to ensure net-
work traffic isolation. However, this isolation is also
necessary to avoid some cloud administrative opera-
a
https://orcid.org/0000-0002-4085-9640
b
https://orcid.org/0000-0003-4936-1619
c
https://orcid.org/0000-0001-7634-6823
d
https://orcid.org/0000-0002-1976-0478
tion affect the network performance from the users of
these cloud services and/or other cloud provider ad-
ministrative operations. For example, the process of
creating a new instance of a VM typically involves
copying the VM image from one computer to another
and this could mean a network traffic volume of over
10Gb. OpenStack provides methods for cloud ad-
ministrators to manage the cloud performance (Open-
Stack, 2019c).
There are few studies related to the analysis of
the cloud providers administrative network traffic.
Mainly, the works in this area focused on the user per-
spective (Chaudhary et al., 2018,Alenezi et al., 2019),
relinquishing the internal operations, and behavior of
the cloud provider. Thus, this paper aims to study
the provider’s infrastructure, specially its networking
layer related to how the most common user operations
over an VM instance (e.g., create, stop, etc.) impacts
on the administrative network of the provider using
OpenStack. An accurate traffic analysis and charac-
terization enables an efficient management of the net-
work resources (e.g., accurate bandwidth allocation).
This article is organized as follows. Section 2
presents a cloud computing overview and introduces
OpenStack aspects. Section 3 explains the problem
motivation, and related work. Section 4 discusses the
characterization approach adopted and scenario. Sec-
Donatti, A., Koslovski, G., Pillon, M. and Miers, C.
Network Traffic Characterization in the Control Network of OpenStack based on Virtual Machines State Changes.
DOI: 10.5220/0009404203470354
In Proceedings of the 10th International Conference on Cloud Computing and Services Science (CLOSER 2020), pages 347-354
ISBN: 978-989-758-424-4
Copyright
c
2020 by SCITEPRESS – Science and Technology Publications, Lda. All rights reserved
347
tion 5 shows our experiments and results. Finally,
Section 6 presents our analysis and characterization.
2 CLOUD COMPUTING &
OpenStack
Cloud computing allows an optimized and on de-
mand way of offering and consuming computational
resources such as processing, storage and networking.
Cloud solutions comprise the orchestration and man-
agement of several well established technologies, e.g.,
virtualization, Network File System (NFS), Software
Defined Networking (SDN), etc. Moreover, virtual-
ization is one of the most relevant techniques for the
cloud computing paradigm. Virtualization provides
the capability of better exploiting physical hardware,
which is one of core concepts in cloud computing.
In this context, there are several open source
cloud solution software, e.g., OpenStack, CloudStack,
and Open Nebula. In fact, OpenStack adoption has
evolved in multiple industries (OpenStack, 2018a)
making it a very popular cloud solution.
OpenStack is an operating system for clouds al-
lowing to control a large pool of resources through-
out a data center (OpenStack, 2019c). Currently,
OpenStack has twenty releases and a new release is
launched every six months. OpenStack is a modular
solution providing a wide range of services, and sev-
eral optional modules. Among the most fundamental
OpenStack modules are:
• Horizon: provides a dashboard service used for
cloud overview and management.
• Nova: Responsible for the distribution and man-
agement of instances, e.g., initialization, schedul-
ing, and deallocation of VMs;
• Neutron: provides network connectivity for
OpenStack services and user instances;
• Glance: manages the storage and retrieval images
of VMs and containers;
• Swift: responsible for the storage and retrieval of
unstructured objects;
• Cinder: provides persistent block storage for run-
ning instances; and
• Keystone: provides authentication and authoriza-
tion services.
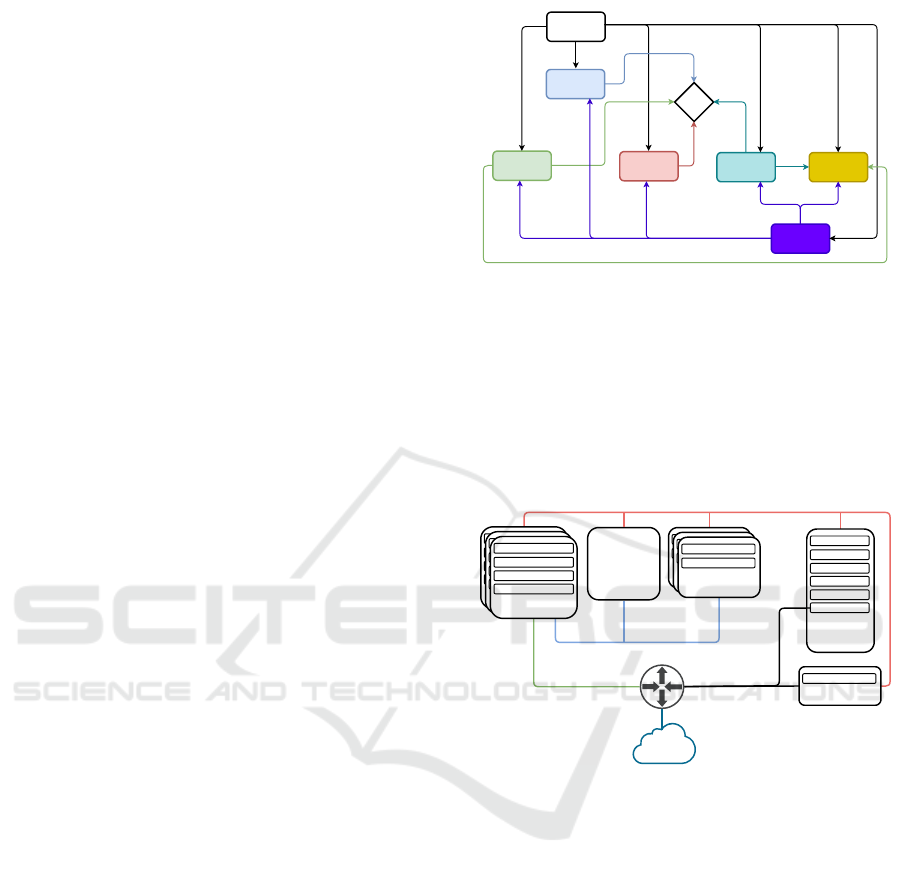
OpenStack services can be distributed all the way
through the data center hosts, but they still interact
with each other in order to provide cloud services
(e.g., VM access and configuration, Figure 1). Thus,
Horizon
Neutron
Cinder
Nova
Keystone
Glance Swift
VM
Provides dashboard
interface
Provides
connectivity
for
Provisions
Provides
images
for
Stores
images
Provides
authorization
Stores
volumes
Provides
volumes
Figure 1: Services interaction related do VM operation.
the services distribution must be planned in order to
meet the consumer performance requirements.
Figure 2 shows the OpenStack network connec-
tivity organization (OpenStack, 2019b). OpenStack
deployment may be more or less complex due to the
scenario and consumer requirements.
Servidor de rede
neutron-metadata-
agent
neutron-DHCP-agent
neutron-L3-agent
neutron-*-plugin-agent
Servidor de rede
neutron-metadata-
agent
neutron-DHCP-agent
neutron-L3-agent
neutron-*-plugin-agent
Servidor de
Computação
nova-compute
neutron-plugin-agent
SDN Service
Node
Servidor de
Computação
nova-compute
neutron-plugin-agent
Compute Node
nova-compute
neutron-plugin-agent
Cloud
Controller
Node
neutron-server
SQLdb
nova-scheduler
keystone
AMPQ
nova-api
Dashboard
Horizon
API
Internet
External
Guest
Network Node
neutron-metadata-agent
neutron-DHCP-agent
neutron-L3-agent
neutron-*-plugin-agent
Management
Figure 2: OpenStack networking setup (OpenStack, 2019a).
A short explanation about the networking setup
presented on Figure 2 (OpenStack, 2019a):
• Management Network: most internal network,
it should be reachable only within the data cen-
ter. OpenStack components communicate over
the Management network and it is considered the
Management Security Domain. All communica-
tions and calls between services are performed
through this network. VM images and miscel-
laneous requests are transmitted through this do-
main, as well as the access to data stored on vol-
umes (i.e., Cinder, Glance, and Swift) access and
status checks.
• Guest Network: used for VM communication
within the cloud deployment. This network is
considered the Guest Security Domain. User net-
work traffic is typically isolated using VLANs.
• External Network: the addresses on this network
CLOSER 2020 - 10th International Conference on Cloud Computing and Services Science
348

may be reachable by the Internet. Depending on
the deployment configurations, the External net-
work is used to provide VMs with Internet access.
This network is in of the Public Security Domain.
• API Network: this network is used in order to
expose all OpenStack Application Programming
Interfaces (APIs) to tenants, thus it’s reachable by
the internet as well. The API network may be
the same network as the External network and it’s
considered the Public Security Domain.
OpenStack cloud solution is very flexible and al-
lows several ways of deployment. It’s important to
keep in mind that inter-services communications oc-
cur no matter which topology is chosen. Thus, mes-
saging between services is an essential process for
correct operation of the cloud environment. The min-
imal setup requires two kinds of nodes, one of them
is the Cloud Controller node and the other one is the
Cloud Compute node (Figure 3).
SQL Server
(MariaDB /
MySQL)
RabbitMQ
Apache
nova-scheduler
nova-api
glance-api
glance-registry
Keystone
neutron-server
neutron-*-agent
Swift
Cinder
Horizon
Hypervisor
neutron-
openvswitch-
agent
nova-compute
Network Service
Storage Service
External
Technology
Compute Service
Other Services
Controller Node /
Network Node
Compute Node
Storage
Technology (LVM,
etc)
Figure 3: Minimal topology for OpenStack deployment.
OpenStack services can be distributed across var-
ious types of nodes (Figure 4) and these can be
replicated to increase the horizontal scalability of the
cloud. The Compute Node replication is the most
common approach.
SQL Server
(MariaDB / MySQL)
RabbitMQ
Apache
nova-scheduler
nova-api
glance-api
glance-registry
Keystone
neutron-server
neutron-*-agent
swift-proxy
cinder-api
cinder-scheduler
Horizon
Hypervisor
neutron-
openvswitch-agent
nova-compute
swift-object
swift-account
swift-container
Storage Technology
(LVM, etc)
cinder-backup
cinder-volume
Network Service
Storage Service
External Technology
Compute Service
Other Services
Controller Node /
Network Node
Compute Node
Storage Node
Figure 4: Basic topology for OpenStack deployment.
Figure 4 shows an example of a topology in which
the block storage service (Cinder) and object storage
were moved to a Storage Node. The planning com-
plexity of the network topology increases when deal-
ing with more than two types of nodes.
3 MOTIVATION & RELATED
WORK
The cloud provider infrastructure is essential to guar-
antee a satisfactory operation, high performance,
and scalability. Cloud provider infrastructure com-
prises several computer, switches, routers, and stor-
age which can be organized / connected using sev-
eral different approaches. Although the organization
of the provider’s infrastructure is not a popular re-
search subject, there is no doubts there are many ques-
tions about which criteria should be used to guide
a cloud infrastructure design. Moreover, most re-
search in this area focus on analyzing the cloud in-
frastructure from the user perspective (Aishwarya. K
and Sankar, 2015,Shete and Dongre, 2017,Chaudhary
et al., 2018,Alenezi et al., 2019), relinquishing the in-
ternal operations and behavior of the cloud provider.
Thus, there is a lack of information regarding how
tasks submitted by the consumers (e.g., VM launch)
may impact the behavior of the management network.
OpenStack has several services which can be re-
lated to perform a consumer request over a VM in-
stance (Figure 1). These services (listed in Fig-
ures 3 and 4) can be specifically developed for Open-
Stack (e.g., Nova, Cinder, Horizon, etc.) or External
Services (e.g., Apache, Xen, KVM, MariaDB, Rab-
bitMQ, etc.) used by OpenStack services to accom-
plish its tasks. Although it is simple for the consumer
to request a VM instance to launch by simple com-
mand (API or Horizon, Figure 2), on the provider in-
frastructure this means the smooth execution of var-
ious tasks between OpenStack Services and External
Services using several interfaces (network and soft-
ware). However, if any service is allocated to a spe-
cific node (e.g., Cinder - Figure 4) communication
will continue to exist but will be between nodes.
Cloud performance depend on analyzing its be-
havior while the cloud is being used (Bruneo, 2014).
There is the need for identifying relevant cloud opera-
tions. Several cloud operations comprises some tasks
in the networking layer, and demand analysis of what
is being transmitted through the network and its fi-
nality. Thus, the problem here being discussed lays
upon the lack of information about operations occur-
ring within the cloud providers networking layer (spe-
cially the internal network traffic). Network traffic
Network Traffic Characterization in the Control Network of OpenStack based on Virtual Machines State Changes
349

Table 1: Related work comparison.
Criteria
(Sankari et al.,
2015)
(Flittner and Bauer,
2017)
(Gustamas and
Shidik, 2017)
(Venzano and
Michiardi, 2013)
(Sciammarella
et al., 2016)
CR1-Collect traffic on the OpenStack cloud management network
Partially. The
document focus
on analyzing the
SDN traffic of data
centers
No Yes No Yes
CR2-Classify the network traffic regarding the state changes in the virtual machine No No No No
Partially. Only VM
creation and termi-
nation
CR3-Analyze the collected traffic in order to identify which service the packets are related No No No No No
CR4-Store the characterized traffic into a database
Not informed by the
author
Not informed by the
authors
No
Not informed by the
authors
Not informed by the
authors
CR5-Identify the timing in which packet was collected (timestamp) Yes
Not informed by the
authors
No
Not informed by the
authors
Yes
characterization helps on this understanding by using
techniques and methods which enable a systematized
network traffic measurement and identification.
In this sense, this paper proposes an analysis and
characterization of the network traffic in the provider
infrastructure, specifically in the management net-
work, related to VM operations triggered by the con-
sumers (i.e., end users) on an OpenStack cloud.
Regarding the related work, we defined five crite-
ria which are used to compare our analysis and char-
acterization to other works (Table 1). The work of
(Sciammarella et al., 2016) is the most related one
to our proposal. However, the authors (Sciammarella
et al., 2016) focus only on the network traffic amount
generated by creating and destroying multiple VM in-
stances in geo-distributed collaborative clouds. The
authors do not separate traffic between services, nor
do they try to identify the time to perform operations
and the amount of calls for each OpenStack service.
4 CHARACTERIZATION &
PROPOSAL
Traffic classification and characterization is not a new
research topic. In this context, traffic characterization
has been a task of considerable importance in the area
of network management and security. Thus, through
the use of traffic classification / characterization tech-
niques, benefits such as increased accuracy for net-
work resource allocation can be achieved. Therefore,
traffic characterization is also a task used to under-
stand and solve performance issues in computer net-
works (Dainotti et al., 2006).
In general, the study of network traffic is sepa-
rated into two steps (Dainotti et al., 2006): (i) mea-
surement: the collection of data traveling on the
network; and (ii) traffic analysis is performed to
identify/classify characteristics relevant to the prob-
lem. The traffic measurement can employ several
tools to capture the data traveling across the net-
work (e.g., TCPdump, and Wireshark). Depending
on how measurement is realized, it can be classified
as (Williamson, 2001): Active (network traffic cre-
ation by the monitoring system, inducing specific sit-
uations) and Passive (capture only existing network
traffic). The most significant techniques used in Inter-
net traffic classification are (Dainotti et al., 2012, Fin-
sterbusch et al., 2014):
• Port-based. Most common method for traffic clas-
sification. Consists on parsing the communication
ports of the TCP / UDP header in order to create
an association with the applications/services.
• Statistical. Uses of packet load independent pa-
rameters such as size, time between arrivals and
packet flow duration. This method has broader
application than other methods which require ac-
cess to the payload of the packet, since in certain
scenarios access to the payload is restricted.
• Pattern matching. Based on Deep Packet Inspec-
tion (DPI), which is recurrent in both traffic clas-
sification and implementation of NIDS. In this
sense, it is possible to compare the contents of
packages with a pre-assembled rule set.
• Protocol Decoding. Based on session state re-
construction and application information obtained
from package contents. Protocol identification
is based on protocol header characteristics and
packet sequences.
In the context of OpenStack management network
it’s possible to deploy a port-based approach, since
the OpenStack environment allows it. It comprises
all administrative traffic and may separate traffic from
some services into VLANs or network interfaces. By
default, on minimal installation, all this traffic is on
a single VLAN or NIC. Since management network
is a core network in OpenStack infrastructure, we’re
working on a very specific scenario in which the ser-
vices must be related to OpenStack operation, so there
are no worries about protocols using cryptography
and services have well defined ports.
We adopted an Active measurement of the con-
sumer operations on a VM instance. Since we found
no information to serve as a baseline for operations
on VM instances, we chose the Active approach and
defined the sequence of operations. This sequence of
operations performed by a consumer in the state of the
CLOSER 2020 - 10th International Conference on Cloud Computing and Services Science
350
VM is called: induced VM lifecycle. OpenStack has a
total of 12 possible states in which a VM instance can
assume (OpenStack, 2018b). However, by analyzing
the operations of our user on our private OpenStack
cloud, we find out the vast majority of our users typi-
cally have their VMs in only 6 states (Figure 5).
INITIALIZED
ACTIVE
STOPPED
SUSPENDED
SHELVEDSHELVED_OFFLOADED
1.CREATE()
2.SUSPEND()
3.RESUME()
4.STOP()
5.SHELVE()
Figure 5: Induced VM lifecycle.
For each state change we collect traffic to iden-
tify the amount of data transmitted, the elapsed op-
eration time, and the number of API calls. This data
is collected by OpenStack Services, and the External
Services. This data is used to perform our traffic char-
acterization.
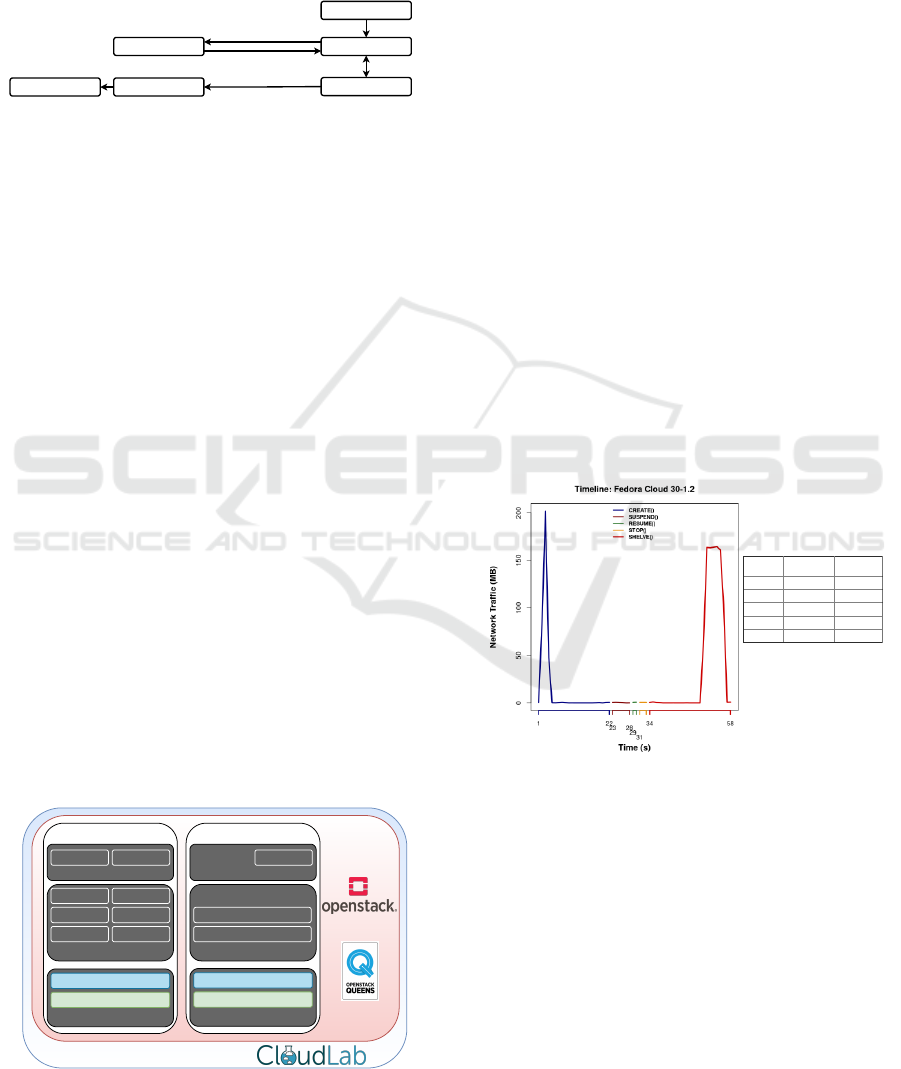
5 TESTBED, EXPERIMENTS &
RESULTS
We used CloudLab (http://cloudlab.us) testbed for de-
ploying OpenStack release Queens. CloudLab allows
servers to be allocated to one of their top three clus-
ters, Utah, Clemsom, or Wisconsin. On average, each
server has 256GB of memory and two 2.4Ghz pro-
cessors each, totaling 16 cores. We use the flavor
m1.small - 1vCPU, 2 GB RAM and 20GB disk stor-
age. It is also possible to choose network between
1Gb/s and 10Gb/s, we use 1Gb/s.
The two nodes topology (Figure 6) was adopted
since it was enough to configure the networks as well
identify the communication between nodes. We col-
lected a traffic measurement from controller server
by collecting traffic from management network inter-
face (VLAN1, Figure 6) and loopback interface, since
there are services running in the Controller Node.
Controller Node
SQLDB AMQP
External Services
KEYSTONE HORIZON
NEUTRON GLANCE
NOVA-API
NOVA-
SCHEDULER
OpenStack Services
Network Interface Card
VLAN1 - Management
VLAN2 - Guest / Public
VLAN1 - Management
VLAN2 - Guest / Public
Compute Node
NEUTRON-PLUGIN-AGENT
NOVA-COMPUTE
Network Interface Card
OpenStack Services
OpenStack Services
AMQP
External Services
Figure 6: CloudLab testbed setup.
We developed a tool for the automation of ex-
periments. Packet capture was implemented with a
tool developed in Python which uses of OpenStack
APIs (especially the novaclient). This tool is used
to capture packets using TCPdump, perform state
change operations on VM instance, and measure the
elapsed time for each operation. In order to avoid
use of cached information, after a experiment the en-
tire cloud is terminated and a new one is created for
the next experiment (Clean-slate approach). Each ex-
periment was run 10 times, deviation was below 2%.
ETC category in tables represents External Services
and most of this is composed of RabbitMQ traffic.
We performed experiments using eight different
operating system (OS) images for instances of VMs,
but due to paper limit of pages we are showing the
results only for the most usual images:
1. GNU/Linux Fedora Cloud: version 30-1.2, 319
MB, and QCOW2 image file format;
2. GNU/Linux Ubuntu Server: version 18.04 LTS,
329 MB, and QCOW2 image file format; and
3. MS-Windows Server: version 2012 R2, 6150
MB, and QCOW2.GZ image file format.
Figure 7 shows the experiment timeline for
GNU/Linux Fedora Cloud 30-1.2 OS image.
Operation
Elapsed time
(seconds)
Total Traffic
(MB)
CREATE 21 337.964
SUSPEND 5 2.192
RESUME 1 1.425
STOP 2 1.890
SHELVE 24 988.089
Figure 7: GNU/Linux Fedora Cloud 30-1.2 OS image.
Tables 2 and 3 show measured traffic classified by
service and API calls respectively. It is possible to in-
fer from Figure 7: measured traffic increases between
seconds 2 and 4, during CREATE operation. The to-
tal traffic between seconds 2 and 4 sums up to around
to 334 MB. Table 2 shows Glance is responsible for
333 MB during CREATE operation. Thus, this peak
represents the OS image transfer. Same behavior hap-
pens to SHELVE operation. It’s possible to infer a
peak between seconds 51 and 56, totaling 919 MB of
networking traffic. According to Table 2, Glance is
responsible for 983 MB. Thus, this peak means the
snapshot transfer through the network.
Network Traffic Characterization in the Control Network of OpenStack based on Virtual Machines State Changes
351
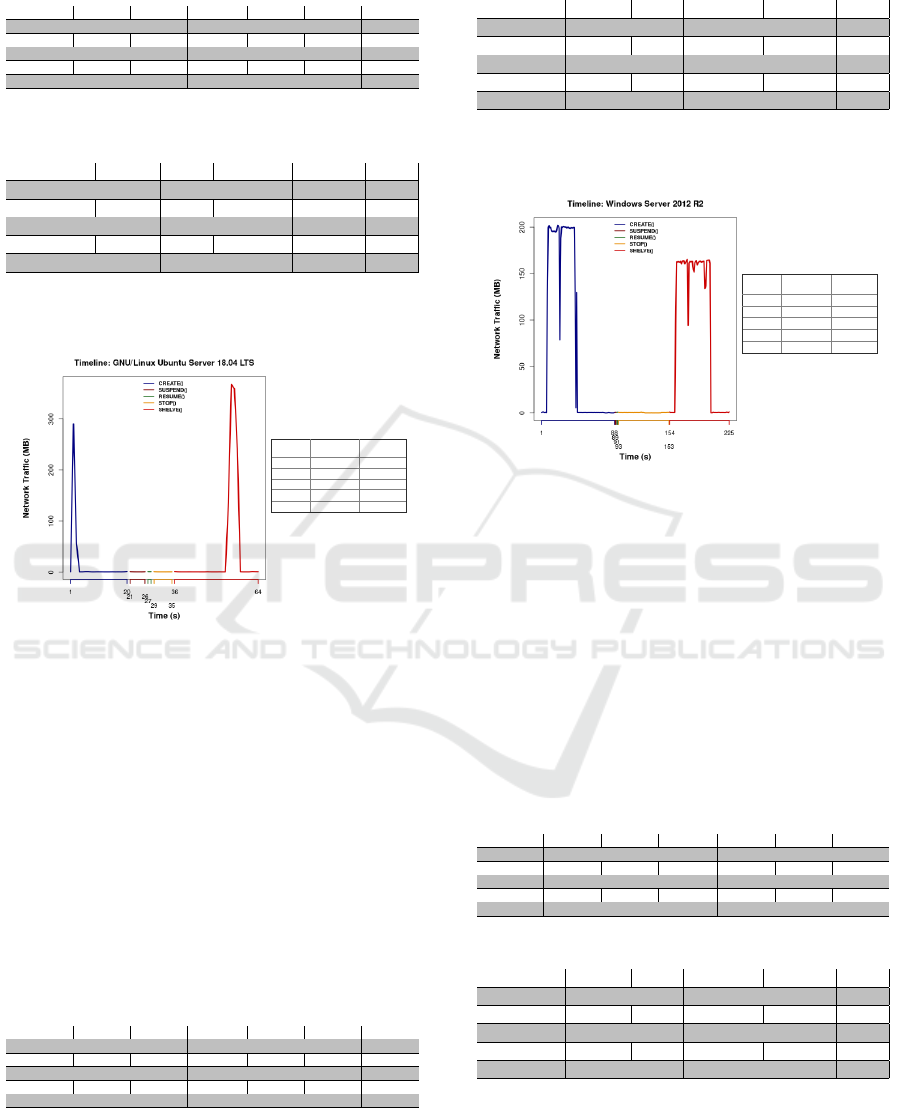
Table 2: Measured traffic in management and loopback in-
terface for GNU/Linux Fedora Cloud 30-1.2 (MB).
Glance Nova Keystone Neutron ETC Total
CREATE 333.0054 0.00552 0.059566 0.03646 4.857366 337.9643
SUSPEND 0.000208 0.001823 0.001036 0.000208 2.188956 2.192231
RESUME 0 0.001169 0 0.007437 1.416463 1.425069
STOP 0 0.00117 0.011781 0 1.877207 1.890158
SHELVE 983.0146 0.00207 0.035559 0.011514 5.025322 988.0891
Table 3: API calls by service - GNU/Linux Fedora Cloud
30-1.2 .
Glance Nova Keystone Neutron Total
CREATE 1 3 5 15 24
SUSPEND 0 0 0 0 0
RESUME 0 0 0 2 2
STOP 0 0 0 0 0
SHELVE 12 0 3 10 25
Figure 8 shows the experiment timeline for
GNU/Linux Ubuntu Server 18.04 LTS OS image.
Operation
Elapsed time
(seconds)
Total Traffic
(MB)
CREATE 19 357.605
SUSPEND 5 3.683
RESUME 1 1.828
STOP 6 4.041
SHELVE 28 1118.964
Figure 8: GNU/Linux Ubuntu Server 18.04 LTS.
Tables 4 and 5 show measured traffic classified by
service and API calls respectively. CREATE opera-
tion registered a peak at second 2. Measured traffic at
second 2 is around to 290 MB. On second 3 measured
traffic is 57 MB. In the other hand, during SHELVE
operation measured traffic from second 54 to 57 is
higher than the rest in the operation. Measured traf-
fic from second 54 to 57 is around to 1105 MB. Both
peaks, from CREATE and SHELVE operations, are
due to the image and snapshot transfer, respectively.
Since Table 4 shows that Glance is responsible for
most networking traffic during these operations.
Table 4: Network traffic (MB): management and loopback
interface - GNU/Linux Ubuntu Server 18.04 LTS (MB).
Glance Nova Keystone Neutron ETC Total
CREATE 344.1754 0.003027 0.057792 0.035739 13.33273 357.6047
SUSPEND 0.000208 0.00117 0.011826 0.000104 3.669552 3.68286
RESUME 0 0.001169 0 0.005117 1.821232 1.827518
STOP 0 0.00117 0.011937 0.000104 4.028234 4.041445
SHELVE 1102.15 0.001377 0.011982 0.014614 16.78581 1118.964
Table 5: API calls by service - GNU/Linux Fedora Cloud
30-1.2.
Glance Nova Keystone Neutron Total
CREATE 1 2 3 15 21
SUSPEND 0 0 0 0 0
RESUME 0 0 0 0 0
STOP 0 0 0 0 0
SHELVE 8 1 1 10 20
Figure 9 shows the experiment timeline for MS-
Windows Server 2012 R2 OS image.
Operation
Elapsed time
(seconds)
Total Traffic
(MB)
CREATE 87 6648.902
SUSPEND 1 1.247
RESUME 1 1.512
STOP 60 22.352
SHELVE 71 6649.295
Figure 9: Results using MS-Windows Server 2012 R2.
Tables 6 and 7 show measured traffic classified
by service and API calls respectively. Similarly the
other experiments, CREATE and SHELVE operations
take longer to execute and they produce more traffic
than the others. CREATE operation produces around
to 6600 MB of which 6500 MB are measured be-
tween second 8 and 43. SHELVE operation produces
around to 6600 MB as well and the period between
162 and 202 seconds is responsible for 6400 MB. Ta-
ble 6 shows Glance is once again responsible for most
of the measured traffic in CREATE and SHELVE.
Table 6: Measured traffic in management and loopback in-
terface for MS-Windows Server 2012 R2 (MB).
Glance Nova Keystone Neutron ETC Total
CREATE 6615.86 0.004698 0.035729 0.030551 32.97104 6648.902
SUSPEND 0 0.000507 0 0 1.246532 1.247039
RESUME 0.000104 0 0 0.007438 1.504655 1.512197
STOP 0.00052 0.002282 0.013943 0.007958 22.32741 22.35211
SHELVE 6619.848 0.003573 0.035414 0.0155 29.39219 6649.295
Table 7: API calls by service - MS-Windows Server 2012.
Glance Nova Keystone Neutron Total
CREATE 1 3 3 13 20
SUSPEND 0 0 0 0 0
RESUME 0 0 0 0 0
STOP 0 1 1 5 7
SHELVE 8 2 2 10 22
Regarding to the API calls, all the experiments
show Neutron and Glance have the highest numbers
of calls (Tables 3, 5 and 7). Most times there are
not so many API calls during SUSPEND and RE-
CLOSER 2020 - 10th International Conference on Cloud Computing and Services Science
352

Table 8: Management traffic per operation.
Operating System
Image size
(MB)
SUSPEND
(MB)
RESUME
(MB)
STOP (MB)
CREATE
minus Image
size (MB)
SHELVE
minus Image
size (MB)
GNU/Linux Fedora Cloud 30-
1.2
319 2.192231 1.425069 1.890158 18.96427 669.08910
GNU/Linux Ubuntu Server
18.04
329 3.68286 1.827518 4.041445 28.60469 789.96375
MS-Windows Server 2012 R2 6150 1.247039 1.512197 22.35211 148.9015 149.2949
Table 9: Elapsed time for each operation (seconds).
Elapsed time (seconds)
Operating System CREATE SUSPEND RESUME STOP SHELVE
Fedora Cloud 30-1.2 21 5 1 2 24
GNU/Linux Ubuntu Server
18.04
19 5 1 6 28
MS-Windows Server 2012 R2 87 1 1 60 71
SUME operations. In fact, SUSPEND and RESUME
operations are similar to suspending and reactivating
a physical machine. Thus, there’s no need for many
API calls, since it can be done straight by the hyper-
visor in the Compute Node. The same can be applied
to STOP operation, which means the machine will be
turned off.
6 ANALYSIS
SUSPEND, RESUME, and STOP operations produce
linear networking traffic (Table 8). The two columns
on the left show how much network traffic was used
when subtracted the size of the image you use. We
have identified an increase when we were actually
expecting a constant value because the image should
only be left with API call traffic. We define it as future
work to analyze whether part of this surplus could be
due to TCP acknowledgments or related to the amount
of API calls (Table 9).
We find out the number of instances being created
or shelved at one time can easily clog up the Open-
Stack management network using a minimal setup
(Figure 3). If there are OpenStack projects launch-
ing or shelving more than 10 VM instances of Ubuntu
Server at a same time on a 1Gb/s network (which is
not a significant number) this may cause performance
degradation in all OpenStack administrative services
(including user access to other storage services such
as Swift and Cinder). Thus, the topology of Figure 4
should be adopted keeping in mind it will not solve
the slow problem but at least will not affect the ex-
ecution of other OpenStack services. The problem
will only can be solved alocating right network band-
width to support the amount of desired VM launching
or shelving.
SUSPEND, RESUME, and STOP operations do
not depend on the OS image, so the networking traffic
is highly related to how long the operation took to
execute (Table 9).
7 CONSIDERATIONS & FUTURE
WORK
The experiments suggest a common behavior for all
operations. SUSPEND, RESUME, and STOP oper-
ations show a constant management network traffic
while CREATE and SHELVE network traffic depend
on the OS image size.
OpenStack is a distributed system, so its operation
is complex, and there are several asynchronous re-
quests among its services/modules. In fact, in Open-
Stack setups RabbitMQ is the most important tool
for dealing with those asynchronous requests. Rab-
bitMQ message broker implements Advanced Mes-
sage Queuing Protocol (AMQP) for managing queues
of Remote Procedure Calls (RPCs). The ETC cat-
egory showed in each networking traffic table (Ta-
bles 2, 4, and 6) contains RabbitMQ traffic which
should be analyzed using a flow based approach
(since there are no source and destination ports to be
evaluated).
Our future work are focused on creating a base-
line traffic which considers management traffic only
per operation (it excludes the image transfer network
traffic). Moreover, we intend to verify a linear regres-
sion model application so it would be possible to pre-
dict the networking traffic amount generated per op-
eration and could be useful for networking resource
management (e.g., bandwidth allocation).
Network Traffic Characterization in the Control Network of OpenStack based on Virtual Machines State Changes
353

ACKNOWLEDGEMENTS
The authors would like to thank the support of
Fundac¸
˜
ao de Amparo
`
a Pesquisa e Inovac¸
˜
ao do Es-
tado de Santa Catarina (FAPESC), Laborat
´
orio de
Processamento Paralelo Distribu
´
ıdo (LabP2D) / Uni-
versidade do Estado de Santa Catarina (UDESC), and
CloudLab.
REFERENCES
Aishwarya. K and Sankar, S. (2015). Traffic analysis using
hadoop cloud. In 2015 International Conference on
Innovations in Information, Embedded and Commu-
nication Systems (ICIIECS), pages 1–6.
Alenezi, M., Almustafa, K., and Meerja, K. A. (2019).
Cloud based sdn and nfv architectures for iot infras-
tructure. Egyptian Informatics Journal, 20(1):1 – 10.
Bruneo, D. (2014). A stochastic model to investigate data
center performance and qos in iaas cloud computing
systems. IEEE Transactions on Parallel and Dis-
tributed Systems, 25(3):560–569.
Chaudhary, R., Aujla, G. S., Kumar, N., and Rodrigues, J. J.
P. C. (2018). Optimized big data management across
multi-cloud data centers: Software-defined-network-
based analysis. IEEE Communications Magazine,
56(2):118–126.
Dainotti, A., Pescape, A., and Claffy, K. C. (2012). Issues
and future directions in traffic classification. IEEE
Network, 26(1):35–40.
Dainotti, A., Pescape, A., and Ventre, G. (2006). A packet-
level characterization of network traffic. In 2006 11th
International Workshop on Computer-Aided Model-
ing, Analysis and Design of Communication Links and
Networks, pages 38–45.
Finsterbusch, M., Richter, C., Rocha, E., Muller, J., and
Hanssgen, K. (2014). A survey of payload-based traf-
fic classification approaches. IEEE Communications
Surveys Tutorials, 16(2):1135–1156.
Flittner, M. and Bauer, R. (2017). Trex: Tenant-driven net-
work traffic extraction for sdn-based cloud environ-
ments. In 2017 Fourth International Conference on
Software Defined Systems (SDS), pages 48–53.
Gustamas, R. G. and Shidik, G. F. (2017). Analysis of
network infrastructure performance on cloud comput-
ing. In 2017 International Seminar on Application for
Technology of Information and Communication (iSe-
mantic), pages 169–174.
Jadeja, Y. and Modi, K. (2012). Cloud computing - con-
cepts, architecture and challenges. In 2012 Inter-
national Conference on Computing, Electronics and
Electrical Technologies (ICCEET), pages 877–880.
OpenStack (2018a). 2018 openstack user survey report.
OpenStack (2018b). Provision an instance.
OpenStack (2019a). Networking architecture.
OpenStack (2019b). Openstack documentation.
OpenStack (2019c). What is openstack?
Sankari, S., Varalakshmi, P., and Divya, B. (2015). Net-
work traffic analysis of cloud data centre. In 2015
International Conference on Computing and Commu-
nications Technologies (ICCCT), pages 408–413.
Sciammarella, T., Couto, R. S., Rubinstein, M. G., Camp-
ista, M. E. M., and Costa, L. H. M. K. (2016). Analy-
sis of control traffic in a geo-distributed collaborative
cloud. In 2016 5th IEEE International Conference on
Cloud Networking (Cloudnet), pages 224–229.
Shete, S. and Dongre, N. (2017). Analysis amp; auditing
of network traffic in cloud environment. In 2017 In-
ternational Conference on Intelligent Computing and
Control Systems (ICICCS), pages 97–100.
Venzano, D. and Michiardi, P. (2013). A measurement
study of data-intensive network traffic patterns in a
private cloud. In Proceedings of the 2013 IEEE/ACM
6th International Conference on Utility and Cloud
Computing, UCC ’13, pages 476–481, Washington,
DC, USA. IEEE Computer Society.
Williamson, C. (2001). Internet traffic measurement. IEEE
Internet Computing, 5(6):70–74.
CLOSER 2020 - 10th International Conference on Cloud Computing and Services Science
354
