
Live Migration Timing Optimization for VMware Environments using
Machine Learning Techniques
Mohamed Esam Elsaid
1 a
, Hazem M. Abbas
2 b
and Christoph Meinel
1 c
1
Internet Technologien und Systeme, Hasso-Plattner Institut, Potsdam Uni., Potsdam, Germany
2
Dept. Computer and Systems Engineering, Ain Shams University, Cairo, Egypt
Keywords:
Timing, Cloud Computing, Virtual, Live Migration, VMware, vMotion, Modeling, Overhead, Cost,
Datacenter, Prediction, Machine Learning.
Abstract:
Live migation of Virtual Machines (VMs) is a vital feature in virtual datacenters and cloud computing plat-
forms. Pre-copy live migration techniques is the commonly used technique in virtual datacenters hypervisors
including VMware, Xen, Hyper-V and KVM. This is due to the robustness of pre-copy technique compared
to post-copy or hybrid-copy techniques. The disadvantage of pre-copy live migration type is the challenge to
predict the live migration cost and performance. So, virtual datanceters admins run live migration without an
idea about the expected cost and the optimal timing for running live migration especially for large VMs or
for multiple VMs running concurrently. This leads to longer live migration duration, network bottlenecks and
live migration failure in some cases. In this paper, we use machine learning techniques to predict the optimal
timing for running a live migration request. This optimal timing approach is based on using machine learning
for live migration cost prediction and datacenter network utilization prediction. Datacenter admins can be
alerted with this optimal timing recommendation when a live migration request is issued.
1 INTRODUCTION
Live Migration is a key technology and essential fea-
ture in datacenter virtualization. With live migration,
the VMs can be moved from a physical host to another
with almost no impact on the running applications
availability. This means the running applications do
not get impacted by the entire physical server issues;
which enhances the service availability dramatically.
Live migration traffic is sent over the TCP/IP pro-
tocol that utilizes the Ethernet network which inter-
connects the cluster servers. The content that should
be migrated is basically the CPU cache, memory and
buffers content; however the big bulk to be migrated
is the memory content. So the CPU cache and buffers
content is almost negligible compared to the memory
content and that what most of the papers assume in
live migration modelling.
Live migration is supported by almost all hyper-
visors in the market; VMware vSphere, Microsoft
Hyper-V, Xen and KVM. Systems load balance,
a
https://orcid.org/0000-0003-1577-5290
b
https://orcid.org/0000-0001-9128-3111
c
https://orcid.org/0000-0002-3212-6201
power saving,resource allocation flexibility and fault
tolerance are all dependent on live migration.
From migration processes point of view, live mi-
gration has three different types; as shown in Fig. 2.
The three types are Pre-copy, Post-copy and Hybrid-
copy.
• In Pre-copy, live migration starts with transfer-
ring the whole content of the source host mem-
ory to the target host, however due to the fact that
the application is still writing data on the source
host memory, this new data is called dirty pages
that should be transferred also to the target host
in other iterations. This iterative copy runs un-
til a stopping condition is met. There are differ-
ent stopping conditions, as we will discuss. Af-
ter the stopping condition is met, the last copy
of the memory and the CPU state is transferred
to the target host and this is the time when the
VM is handed-over to the target host. During
this handover, there is a down-time that should
be very short to avoid the running application in-
terruption. This means that in Pre-copy, the han-
dover of the VM only occurs when there is lit-
tle amount of data to be transferred to minimize
the down-time and to have robust migration. That
Elsaid, M., Abbas, H. and Meinel, C.
Live Migration Timing Optimization for VMware Environments using Machine Learning Techniques.
DOI: 10.5220/0009397300910102
In Proceedings of the 10th International Conference on Cloud Computing and Services Science (CLOSER 2020), pages 91-102
ISBN: 978-989-758-424-4
Copyright
c
2020 by SCITEPRESS – Science and Technology Publications, Lda. All rights reserved
91

is the reason for considering Pre-copy live mi-
gration as the most reliable live migration type.
VMware, KVM, Hyper-V and Xen are all us-
ing Pre-copy live migration. The dis-advantage
of Pre-copy live migration is the migration time
which is not predictable. It depends basically on
the dirty pages rate and the network transmission
rate. In some cases the migration might take too
long time or even fail due to high dirty pages rate
with lower network transmission rate. But when
this case happends, the VM continues running on
the source host without disruption, which make
Pre-copy as the most reliable technique.
The stopping condition in Pre-copy differs from
a hypervisor to another. The number of pre-copy
iterations, the residual amount of data to be mi-
grated in the source host memory, or ratio between
the transferred data and the memory content to be
migrated are the main stopping conditions for pre-
copy. The stopping conditions in the Xen platform
are (Akoush et al., 2010):
– Less than 50 pages are dirtied during the last
pre-copy iteration
– 29 pre-copy iterations have been carried out
– More than 3 times the total amount of RAM
allocated to the VM has been copied to the des-
tination.
While the stopping conditions for VMware are
(Hu et al., 2011):
– Less than 16 megabytes of modified pages are
left.
– There is a reduction in changed pages of less
than 1 megabyte.
• In Post-copy migration, the source host transfers
only the data required for the VM boot to the tar-
get host and then stops the VM at the source host
to hand it over. After the VM activation at the tar-
get host, the source host starts sending the mem-
ory data in one iteration to the target host. This
means that the memory copy is done in a one shot
after the VM handover, and so post-copy migra-
tion time is predictable. However, this means that
if the memory content transfer fails for any rea-
son, the VM will be destroyed and data loss might
occur (Fernando et al., 2019). So, it is not a re-
liable migration technique as Pre-copy. And so,
post-copy is not used by any commercial hypervi-
sor.
• Hybrid-copy technique has several algorithms that
try to mix steps of pre-copy and post-copy to get
higher robust migration with migration time pre-
diction. One of these algorithms firstly migrates
(Hu et al., 2013) and (Sahni and Varma, 2012) the
memory content of the VM is transferred to the
target host and during this migration, new dirty
pages are written to the source host memory, so
several pre-copy iterations are run but with limited
number to keep the migration time predictable.
Then the VM state is transferred and handover oc-
curs to activate the VM at the target host. The
residual memory pages are transferred to the tar-
get host in a post-copy manner. Hybrid-copy de-
pends on having low amount of residual memory
pages in the post-copy phase to enhance the mi-
gration robustness compared to post-copy, how-
ever it does not show the same reliability and ro-
bustness level of pre-copy. So in case of transfer
failure in the post-copy phase, data loss might oc-
cur.
As discussed, pre-copy migration is the most re-
liable migration type and so it is the technique com-
mercially used by all hypervisors. The problem in
pre-copy migration is the challenge to predict the mi-
gration cost. So, in this paper, we focus mainly on
the timing optimization for pre-copy live migration.
Our proposal is based on using one of the datacenter
network utilization prediction models and also using
live migration cost prediction approach; which is pro-
posed in the previous paper (Elsaid et al., 2019).
The rest of this paper is organized as following:
section 2 discusses the networking configurations for
live migration traffic in different hypervisors. Data-
center network utilization prediction is discussed in
section 3 to select a prediction model that fits for vir-
tual datacenters network utilization. Live migration
cost prediction model is discussed in section 4 to re-
fer to the proposed cost prediction model in this paper
(Elsaid et al., 2019). Live migration timing optimiza-
tion algorithm is proposed in section 5, and we test it
in section 6. Testing results are discussed in section 7
and finally we conclude the paper in section 8.
2 LIVE MIGRATION
NETWORKING
Virtual networking is an essential requirement for
virtualized datacenters and cloud computing plat-
forms(Gupta et al., 2018). Each VM has a virtual net-
work adapter and at least one virtual port. The VMs
are inter-connected to virtual switches (vSwitches)
that use physical Ethernet switches in the back-end.
In this section we discuss in more details the con-
cept of network virtualization and how live migra-
tion is implemented in the four hypervisors; VMware
vSphere, Microsoft Hyper-V, Xen and KVM.
CLOSER 2020 - 10th International Conference on Cloud Computing and Services Science
92
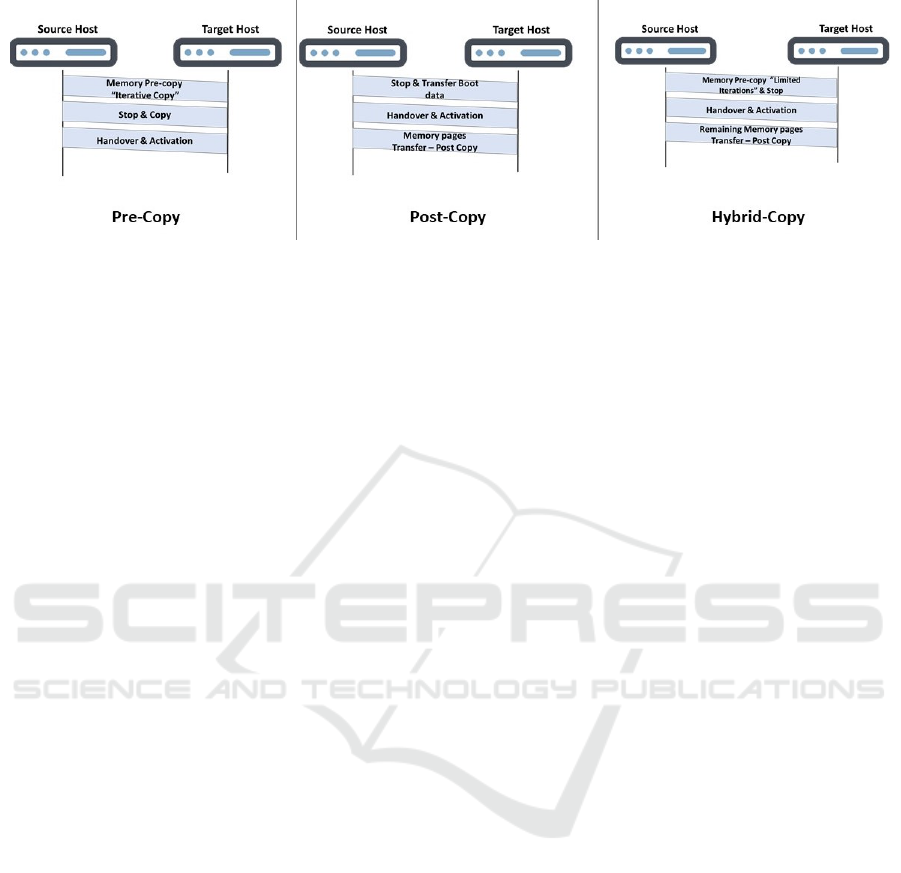
Figure 1: Live Migration Types.
In virtual networking, each VM has virtual Net-
work Interface Cards (vNICs). Each vNIC has one
or more virtual ports (vPorts). Each vPort is con-
nected to a vSwitch. This virtual switch can be a
local switch inside the physical host only to connect
the VMs within this host, or can be a cluster virtual
switch to connect between the VMs in a cluster. Each
vSwitch has at least one uplink port which is mapped
to a physical switch port. Each group of ports in the
vSwitch can create a separate vLAN or port group
that can be labeled. For one or more physical hosts
connection, a cluster vSwitch is used as a centralized
vSwitch that connects all the VMs of the cluster phys-
ical nodes. This vSwitch concept applies to all hyper-
visors (Tseng et al., 2011). However, the hypervi-
sors are different to each other when it comes to live
migration networking set up. We discuss in this sec-
tion live migration networking configuration details
for VMware vSphere, Microsoft Hyper-V, Xen and
KVM.
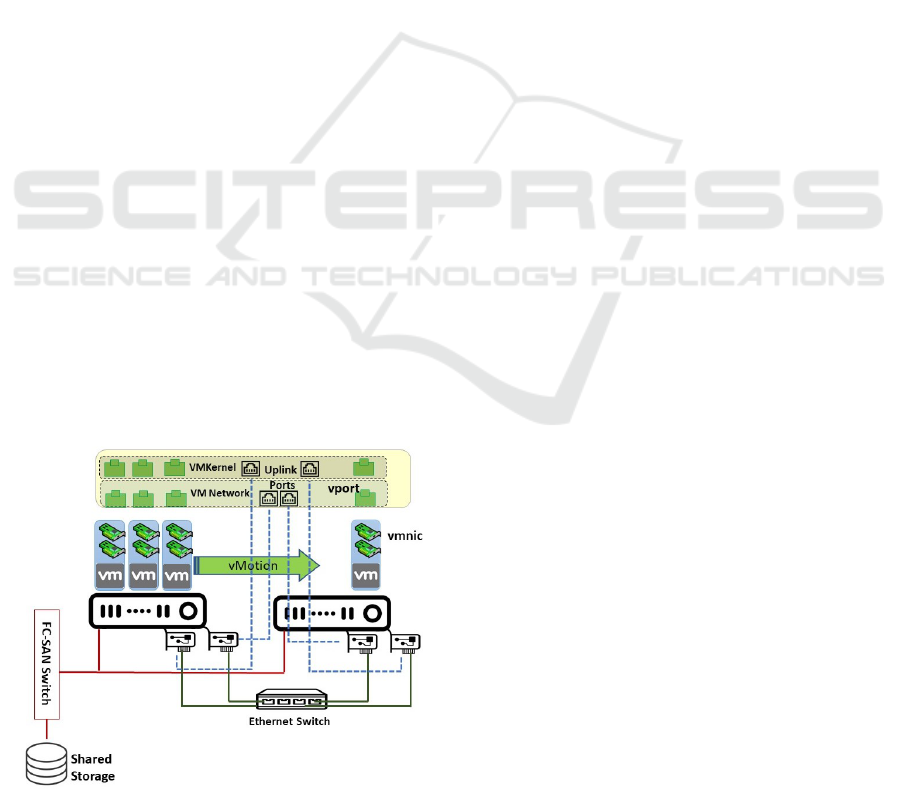
2.1 VMware vSphere Live Migration
Networking
Live migration feature in VMware is called vMotion.
Fig.2 shows an example of the best practice for vMo-
tion networking. Fig.2 shows a cluster of two phys-
ical machines that are connected to a shared storage
using FC-SAN switch and connected to the IP net-
work using an Ethernet switch. The solid lines repre-
sent physical connections and the dotted lines repre-
sent the virtual connections for the virtual distributed
switch. Fig. 2 represents a commonly used sce-
nario in enterprise datacenters where a storage array
is shared between the cluster servers using FC-SAN
network. Live migration uses TCP/IP protocol and so
it utilizes the IP network. From best practice point of
view, each physical host should have at least 2 phys-
ical NICs and each VM should have at least 2 NICs
(vDS, ). The VMs in the cluster are connected to a
virtual distributed switch. Using port groups, the IO
traffic of the VMs can be isolated. There are two types
of port groups in VMware; VMkernel distributed port
group and VM network distributed port group. VM
network port group is responsible for the production
traffic like applications traffic. VMkernel port group
is responsible for the special classes of traffic like
vMotion, management, iSCSI, NFS, Fault tolerance,
replication traffic and VMware vSAN as a Software
Defined Storage (SDS) traffic (VMk, ). The physical
machines NICs ports should be mapped to the dis-
tributed switch as uplink ports. The uplink port is
responsible for the in-going and the out-going traf-
fic into and from the distributed switch. Each port
group should have at least one uplink port from each
physical host. Each uplink port can be shared be-
tween many port groups. For vMotion traffic, it is
a best practice to create a dedicated VMkernel port
group between the VMs in the cluster. This vMotion
distributed port group should include at least one up-
link port from each physical host (vDS, ). This uplink
port assignment is actually not only for vMotion port
group, but also for any other VMkernel based port
group. From physical port isolation, vMotion traffic
is physically isolated on the host port level from the
applications traffic. However, depending on the back-
end network topology, vMotion and workload traffic
might compete on the backend network bandwidth.
2.2 Microsoft Hyper-V Live Migration
Networking
Virtual layer 2 switches in Hyperv-V have the same
concept like VMware. It is basically a software based
switch that connects the VMs vNICs with the physi-
cal ports uplinks (vSW, ). Also, live miration in Mi-
crosoft Hyper-V has the same concept like VMware
vMotion. The best practice for Hyper-V is to con-
figure a separate virtual network or VLAN for live
migration in order to isolate the migration network
traffic from the applications traffic (LMH, ).
Live Migration Timing Optimization for VMware Environments using Machine Learning Techniques
93
2.3 Xen Hypervisor Live Migration
Networking
In Citrix Xen, vSwitch concept is also used as in
vSphere and Hyper-V, so each VM has at least one
vNIC and vports that are connected to a distributed
vSwitch which connects that VMs across the clus-
ter and includes the hosts physical NICs as the
vSwitch uplinks. The difference in Xen compared
to vSphere and Hyper-V is having a separate Open-
Flow controller. This OpenFlow controller is a cen-
tralized server that controls the Xen servers virtual
network and is responsible for the vSwitches configu-
ration, traffic management and performance monitor-
ing (Xen, ). Live migration feature in Xen is called
XenMotion. XenMotion networking best practice is
to create a cross server private network that isolates
XenMotion traffic from other other management or
workload traffic. This private network provisions ded-
icated virtual management interface of the VMs for
live migration traffic (Mot, ).
2.4 KVM Live Migration Networking
Libvirt is used for KVM Hypervisor virtual network-
ing (lib, ). Libvirt uses APIs that talks to Quick EMU-
lator (QEMU) for network and storage configurations.
Each VM has its own QEMU instance. The vSwitch
that is created by libvirt can connect the VMs vNICs
across the KVM cluster with the physical hosts uplink
ports. For KVM live migration networking, Redhat
best practice is to create separate the storage network
from the migration network. So live migration isola-
tion from other management traffic or workload traffic
is not mentioned (Red, ). This means that live migra-
tion network traffic might be in contention with the
workload traffic or with other management traffic.
Figure 2: Network Topology for VMware vMotion.
3 DATACENTER NETWORK
TRAFFIC PREDICTION
Machine Learning (ML) has many applications that
change our life and experience with lots of appli-
cations including healthcare, manufacturing, insur-
ance, social networking and robotics industries. Us-
ing ML for datacenters optimization could resolve
different challenges in modern datacenters infrastruc-
ture servers usage forcasting (Singh and Rao, 2012),
networking (Boutaba et al., 2018), storage (Shen and
Zhou, 2017), security (Baek et al., 2017)and energy
consumption (Berral et al., 2013).
In this section we focus on network traffic predic-
tion using ML techniques. This is due to the fact that
live migration has a massive impact on the datacen-
ter networking. So from live migration cost param-
eters, networking overhead is the most impacted per-
formance metric compared to other infrastructure per-
formance metrics like CPU, memory and power over-
head. On the other hand, in pre-copy migrations, it-
erative copy phase is the most time consuming phase
and limitation in the network bandwidth can lead to
copy process interruptions and so live migration fail-
ure.
In this paper, we make use of the existing network
prediction techniques proposed by other researcher
to integrate it with the live migration cost prediction
model that is proposed in related work to come up
with a novel timing optimization for live migration
in VMware environments. Using ML techniques for
networking prediction is well covered in this survey
paper (Boutaba et al., 2018) that cover ML applica-
tions for network traffic prediction, performance opti-
mization and security. For network traffic prediction,
this survey paper (Boutaba et al., 2018) has referred
to four research articles. The first article (Chabaa S
and Antari J., 2010) uses Artificial Neural Networks
(ANN) technique with Multi-Layer perceptron (MLP)
to analyze and estimate the Internet traffic over the IP
network. In this proposed approach, model training
is used with given inputs and outputs to optimize the
weights of the neuron and minimize the error between
the ANN output and the target output. For model
training 750 points were used and for model testing
other 250 independent points were used. Authors in
(Chabaa S and Antari J., 2010) proved that Leven-
berg-Marquardt (LM) and the Resilient back propa-
gation (Rp) algorithms show highest precision com-
pared to other training algorithms.
In the second article (Li et al., 2016), the authors
propose new ANN based prediction model for the
inter-DC network traffic. In the model three inputs
are collected for the ANN module; an elephant flow
CLOSER 2020 - 10th International Conference on Cloud Computing and Services Science
94

Table 1: Summary of Network Traffic Prediction Related Work.
Paper Technique Approach Dataset Training Output
Comp.
Overhead
(Chabaa et.) MLP-ANN LM and RP 1000 dataset
Past
measurement
Expected
Traffic
Volume High
(Li et.) MLP-ANN
Interpolation with
Elephant flow,
total traffic and
the sublink traffic
Every 30s
traffic
for 6 weeks
Time Series
data
decomposition
using Db4
Next 30s
expected
traffic
volume High
(Zhu et.) MLP-ANN
BPNN
PSO-ABC
Hourly traffic
for the past
2 weeks
PSO-ABC
Algorithm
Next day
hourly
traffic Intermediate
(Chen et.)
Hidden
Markov
model
Using KBR and
RNN for Makov
model transition
and emission
probabilities
calculations
Every 5 mins
in 24 weeks
Network
Volume
and flow
count
KBR and RNN
with LSTM unit
Traffic
volume
prediction Intermediate
sample due to the massive amount of traffic, the total
traffic and the traffic of the sublinks in both directions.
The proposed model is applied at the largest DC back-
bone link in China that connects multiple datacenters
with thousands of servers. Using this model could re-
duce the prediction error up to 30 percent and so the
peak bandwidth can be reduced with 9 percent.
Authors in the third article (Zhu and et al, 2013)
proposed a network traffic prediction model with high
accuracy using Back Propagation Neural Network
(BPNN) optimization and Particle Swarm Optimiza-
tion - Artificial Bee Colony (PSO-ABC) algorithm.
BPNN is a supervised learning ANN based technique.
In BPNN, the error between the desired output and the
calculated output is back propagated to the ANN sys-
tem input to minimize the error. PSO-ABC is used
as an optimization algorithm that trains the ANN to
minimize the prediction error and increase the perfor-
mance stability (Zhu and et al, 2013).
In the forth paper (Zhitang Chen et al., 2016), the
authors propose network traffic prediction technique
which is based on Hidden Markov Model that de-
scribes the relationship between the flow count and
the flow volume and the dynamic behavior of both as a
time invariant state-space model. The transition prob-
ability and the emission probability in the proposed
Markov Model are unknown and so, packet traces are
collected to learn the model and train the transition
and emission probabilities. Then Kernel Bayes Rule
will be used to obtain the estimation points for spe-
cific time interval with minimal error and computa-
tional overhead. Table 1 summarizes the comparison
between the four papers that we discussed in this sec-
tion. As shown in Table 1, we add a comparison col-
umn from CPU consumption overhead point of view
for each technique. This is important for having an
algorithm that can be applied in practical. So for
our proposed timing optimization algorithm, we will
make use of the network prediction algorithm pro-
posed in (Zhitang Chen et al., 2016); since is network-
ing prediction algorithm shows lower CPU consump-
tion compared to the first two techniques. The forth
technique shows also lower CPU consumption , how-
ever the output samples are hourly based; which is
long period for our application. CPU consumption is
critical for our application because, the computational
delay for this network prediction process should be
minimal in order to get back with a fast response to
the network admin with the recommended migration
timing when the live migration request is initiated.
4 LIVE MIGRATION COST
PREDICTION
In (Elsaid et al., 2019), we have proposed a ma-
chine learning based approach for live migration cost
prediction in VMware environments. The proposed
model flowchart is in Fig. 3 and as shown, live migra-
tion time in seconds and network traffic rate in bps for
each live migration request can be predicted based on
the active memory size. The relationship between the
network traffic rate and active memory size is repre-
sented in equation (1) based on non-linear regression
for the obtained empirical modeling.
R
s
= αe
V
Mem
+ β
(1)
R
s
: is the source host network throughput overhead in
kBps
V
mem
is the source host active memory size in kB at
Live Migration Timing Optimization for VMware Environments using Machine Learning Techniques
95
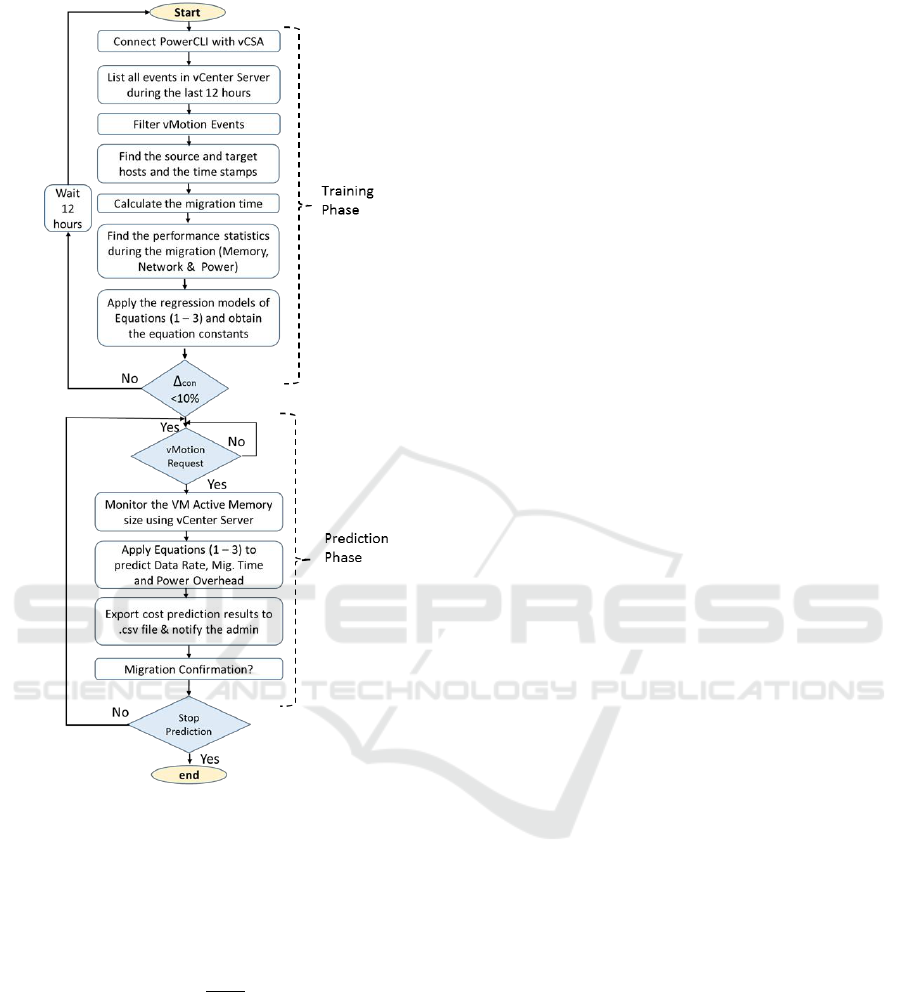
Figure 3: Live Migration Cost Prediction Framework.
the time when the live migration should start. α and
β are the equation constants.
Migration time prediction is presented in equation (2)
based on empirical modeling using linear regression
technique.
T
mig
= a.(
V
mem
R
s
) + b
(2)
T
mig
is the migration time duration in seconds. a and
b are the equation constants.
As we will discuss in the next section, we make use
of this live migration network cost modeling and the
datacenter traffic volume prediction to propose a new
timing optimization technique for live migration.
5 PROPOSED TIMING
OPTIMIZATION APPROACH
This paper contribution can be summarized in the fol-
lowing points:
1. We propose a solution that can minimize the mi-
gration time for single and multiple VMs migra-
tion in VMware environments. This solution is
based on timing optimization for the live migra-
tion process initiation to minimize the network
contention for live migration traffic.
2. The proposed timing optimization technique is a
machine learning based approach that makes use
of the machine learning techniques; mainly the
previously studied machine learning based live
migration cost prediction approach proposed in
(Elsaid et al., 2019) and the machine learning
based IP network prediction technique proposed
in (Zhitang Chen et al., 2016).
3. The proposed approach is a practical algorithm
that is implemented as a VMware powerCLI
script and integrate with VMware vCenter Server
for cluster management.
4. To the best of our knowledge, studying live mi-
gration timing is not covered by any related work.
We could only find some VMware articles that
assures on using high speed GbE for vMotion to
avoid network bottlenecks (Net, b).
The proposed algorithm is presented in Fig. 4
flowchart that starts with connecting to VMware
vCenter Server Appliance (vCSA) (vCe, ) using
PowerCLI client (Pow, ) to run our PowerCLI script
on the VMware cluster that is management by this
vCSA. The next step is train the live migration cost
prediction model from the past 12 hours events; as
discussed in Fig. 3. Then network traffic prediction
model is also trained using the Hidden Markov Model
algorithm proposed in (Zhitang Chen et al., 2016)
and every 30 sec of the VMware VMkernel network
traffic history of the past day; which means 2880
points as training dataset. As discussed in section
2.1, VMkernel network is the isolated network that
includes vMotion and vSAN traffic. By finishing this
step, the training phase can be considered as finished
and the script is ready to predict.
When the network admin sends a vMotion request
for a specific VM or for Multi-VMs migration, the
VM live migration time and migration traffic rate is
predicted by calling the prediction phase of the ma-
chine learning technique proposed in Fig. 3. By this
step, the migration time and network rate are esti-
mated. Then the prediction technique proposed in
CLOSER 2020 - 10th International Conference on Cloud Computing and Services Science
96
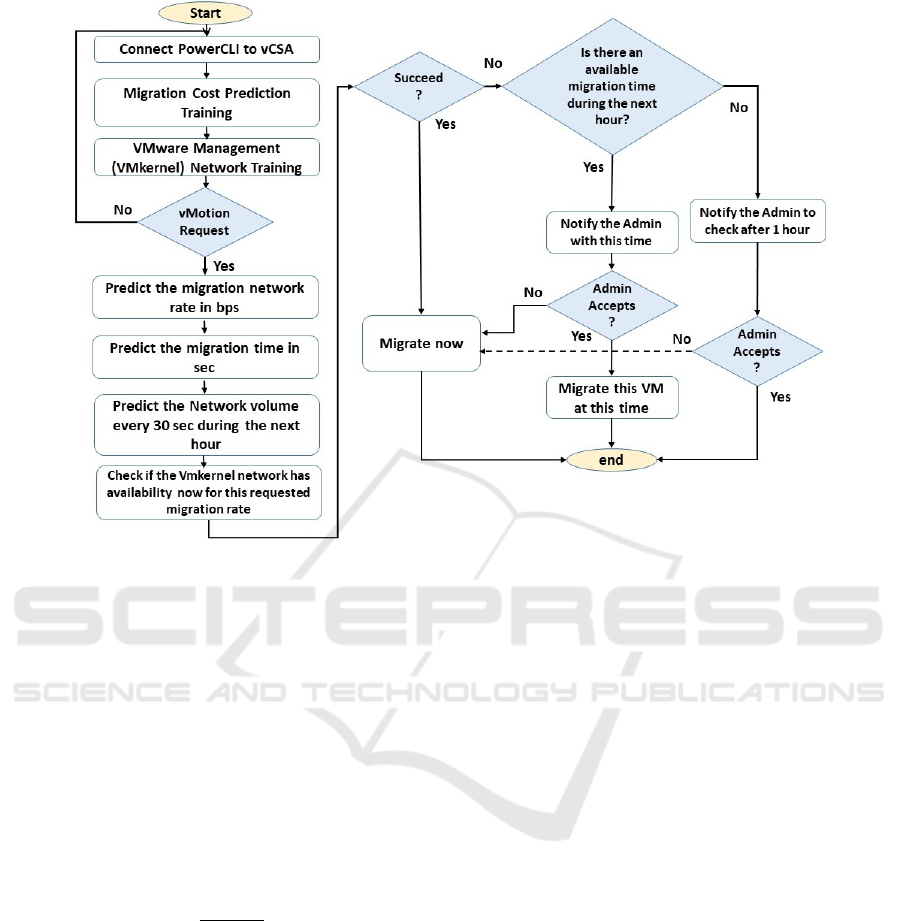
Figure 4: Proposed Timing Optimization Approach for VM Migration.
(Zhitang Chen et al., 2016) is used to estimate the net-
work traffic volume of the VMware cluster VMkernel
network for every 30 sec during the next 1 hour. By
finishing this step, the prediction phase of the network
traffic volume, the live migration time and the migra-
tion transmission rate is finished and timing optimiza-
tion check should start.
Timing optimization starts with a check if the cur-
rent time; when the vMotion request is received is the
a good time for initiating the vMotion process. To do
this check, the script runs equation (3) that estimates
the traffic rate during the estimated migration time in-
terval.
R
busy
=
∑
N
mig
n=0
V
n
T
mig
R
Avail.
= BW − R
busy
(3)
R
busy
is the estimated traffic volume in bps that
will be utilized by other VMkernel network traffic,
like vSAN, management,..etc. So, it is predicted to
have the VMkernel network reserved with this rate
during the migration time. n is the 30 sec based sam-
ple number in integer of the network traffic prediction
technique N
mig
is the last sample that approximately
ends with the estimated migration time. V
n
if the esti-
mated traffic volume in bytes for each sample. R
Avail.
is the un-utilized traffic rate in bps that is available for
vMotion traffic. BW is the VMkernel network band-
width in bps.
The succeed check point in the algorithm flow
chart verifies simply the below condition in equation
(4)
R
Avail.
> R
s
∗ (1 +P
Acc.
)
(4)
Where P
Acc.
is the prediction accuracy for live mi-
gration network rate. So in equation (4), the algo-
rithm checks if the available network rate for VMker-
nel network R
Avail.
can afford the estimated migration
transmission rate whilst considering the prediction ac-
curacy that is mentioned in (Elsaid et al., 2019). if
this checkpoint result is (Yes), the live migration will
start momentarily. If the result is (No), the algorithm
moves to another phase which is finding the optimal
time for initiating the VMs migration process.
When the momentarily migration check does not
succeed, the algorithm checks for another better tim-
ing during the next hour from network availability
point of view. So equation (4) is applied for the next
hour prediction samples with 30 sec interval. If an-
other optimal time is found, it will be shared with the
network admin. If the admin accepts it, the VMs mi-
gration will be initiated at this time automatically. If
the admin rejects this recommendation, the migration
will be initiated momentarily. In case of not finding
another optimal time during the next hour, the admin
will be also alerted with this fact. In this case, the rec-
ommendation is to request the migration again after 1
Live Migration Timing Optimization for VMware Environments using Machine Learning Techniques
97
hour. If the admin rejects that, the migration will be
also initiated momentarily. If the admins accepts the
recommendation, the algorithm stops.
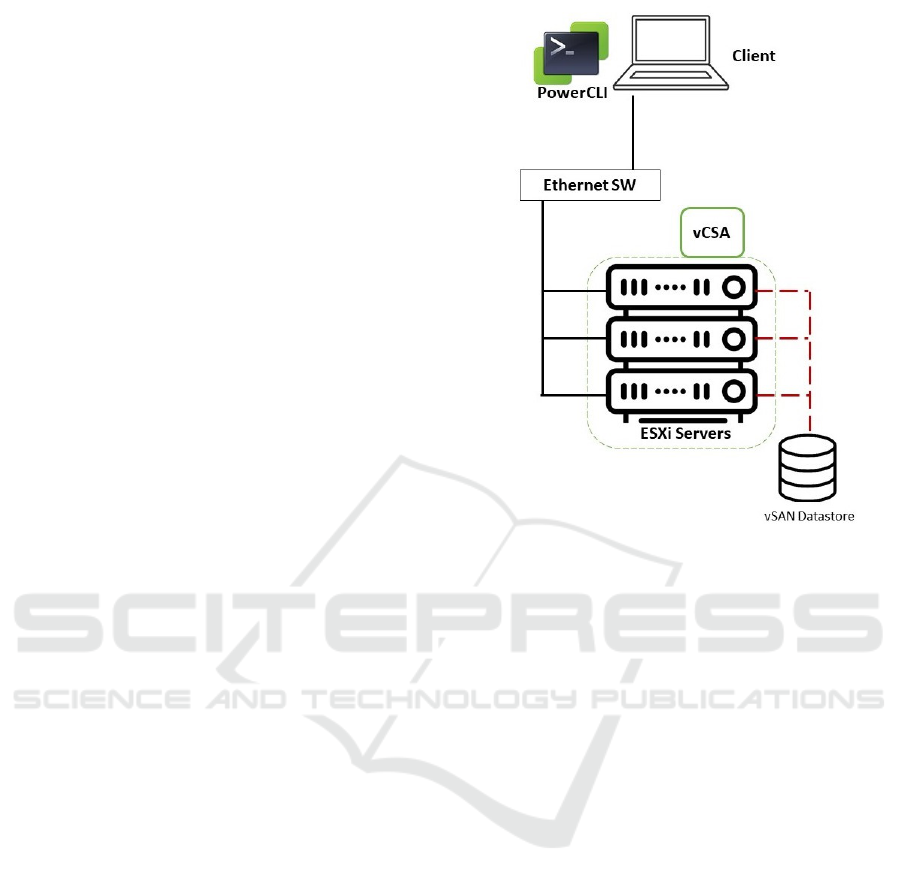
6 TESTING ENVIRONMENT
The testing environment is shown in Fig. 5; which has
a similar infrastructure to enterprise datacenters that
includes the following hardware setup; Three Hosts
(Hewlett Packard DL980 G7) with 2x Intel Xeon (Ne-
halem EX) X7560, 8GB RAM, 2 NICs per server.
The Ethernet switch is Cisco with 10 Gbps ports.
The three hosts are connected to a 1 TB VMware
vSAN datastore as a software defined storage plat-
form. From software prospective, VMware ESXi
6.5.0 Hypervisor is used with vSAN 6.5 and vCenter
Server that manages the hosts and the VMs live mi-
gration. VMware PowerCLI 6.5.1 build 5377412 is
connected to the VMware PowerCLI (Pow, ) is used
to run the algorithm flowchart script.
In this set up we have created four Linux Ubuntu
12.04 VMs with 4 vCPU, and different RAM sizes
(1GB, 2GB, 4GB and 8GB). We focus on the RAM
size change only becuase memory is a critical con-
figuration parameter in defining live migration per-
formance (Elsaid et al., 2019). The VMs run a net-
work intensive workload that represents web servers
environment and memory intensive workload as worst
case scenario for VMs migration. The network stress
benchmark that we have used is Apache Bench (AB)
(Net, a). Apache Bench tool stresses the web servers
with lots of requests through the network to test the
servers response. For memory stress, we have used
AB for memory stress (Mem, ). With this testing
setup, we have run 16 testing scenarios per Workload
for running single VM, 2 VMs, 3 VMs and 4 VMs mi-
gration in parallel. So the testing scenarios is a matrix
of 4 different numbers of VMs and 4 different VM
sizes. For each configuration scenario, we have run
the migration at elast 5 times.
In our testing, we focus on studying the timing op-
timization impact on the VMs live migration time as a
reflection for having less contention in the VMkernel
network. Lower migration time for live migration re-
quests, means faster migration with less interruptions
and higher probability of migration success. This is
basically due to avoiding the bottlenecks and the net-
work peaks for initiating the migration process; spe-
cially for large memory VMs.
Figure 5: Testing Environment Infrastructure.
7 RESULTS AND ANALYSIS
As presented in section 5, our proposed algorithm
searches for the optimal timing for live migration re-
quests during the next hour of the admin vMotion re-
quest using prediction techniques for the live migra-
tion time, network rate and the datacenter traffic vol-
ume prediction. We evaluate our proposed algorithm
by showing the impact of timing optimization on the
migration time. Lower migration time means less
contention in the migration traffic within the VMk-
ernel network; which represents higher transmission
rate with less interruptions and higher probability of
migration success in a shorter time. In section 6, we
presented the testing setup and showed that for dif-
ferent VMs memory configurations and with differ-
ent numbers of VMs, we test our algorithm using net-
work stress and memory stress benchmarks. Fig. 6
and Fig. 7 show the proposed timing optimization al-
gorithm testing results for memory stress and network
stress workloads.
In Fig. 6, there are four charts that represent the
obtained results for different number of VMs; as men-
tioned in the title on top of each chart. For each chart,
we show the migration time consumed by different
VMs memory configurations; 1GB, 2GB, 4GB and
8GB RAM VMs. For each configuration, There are
three bars, the first solid black bar shows live mi-
CLOSER 2020 - 10th International Conference on Cloud Computing and Services Science
98

Figure 6: Memory Stress - Impact of Timing Optimization on Live Migration Time.
gration time consumption in seconds with using the
proposed timing optimization algorithm. The second
dotted bar shows the average migration time for five
times live migrations for the same VM without tim-
ing optimization. The third dashed bar shows the
maximum observed migration time for the same VM
from the five migrations happened without timing op-
timization. For the average and the maximum migra-
tion times bars, we add the difference in percentage
on top of the bar versus the migration time achieved
by using timing optimization. So for example in the 1
VM- 1GB Mem testing scenario, the migration time
achieved with using timing optimization is 16 seconds
and the average migration time is 1.1 percent higher.
Also the maximum migration time observed is 1.25
percent higher than using timing optimization. The
same explanation applies to all the charts in Fig. 6.
As shown in Fig. 6, the difference between the
average and maximum migration times versus using
timing optimization varies between different config-
uration scenarios and reaches large values in many
cases; especially with multiple VMs migrations; for
example on average 157% more time consumed ver-
sus migration timing optimization, and 221% more
time for the maximum migration time case. These
observed differences in Fig. 6 show the following:
• The performance of the proposed timing opti-
mization techniques is compared versus not using
it and proceeding with live migration randomly at
Table 2: Timing Optimization Performance.
Mem Stress Net Stress
Average Mig. Time % 145 126
Max. Mig. Time % 205 136
any time. The performance metric is the migra-
tion time in sec of the VMs live migration.
• Table 2 shows the average of the percentages dif-
ference between the average migration time and
the maximum observed migration time versus us-
ing timing optimization. As shown, for memory
intensive workload, average migration time shows
145% more time than using the proposed timing
optimization and the maximum migration time
shows 205% more time. This means that the pro-
posed timing optimization can save up to 50% of
migration time and in average it saves 32% of the
VMs migration time for memory intensive work-
loads.
This enhancement in the migration time is basi-
cally due to the selection of an optimal migra-
tion timing based on the datacenter network uti-
lization, such that live migration process can get
higher network throughput. With higher migra-
tion transfer rate, live migration process can be
accomplished in a shorter time and with higher
success rate. Fig. 8 shows the difference between
running vMotion with timing optimization versus
without using our proposed timing optimization
algorithm as an example for 4 VMs, 8GB memory
for each VM and linpack benchmark workload.
As shown; with timing optimization, live migra-
tion can be achieved with higher transfer rate and
so the migration time becomes shorter. In this ex-
ample, migration time consumes 26 time samples
without timing optimization, however it consumes
16 samples with timing optimization. The sample
is 20 sec.
• VMs with larger memory size consume signifi-
Live Migration Timing Optimization for VMware Environments using Machine Learning Techniques
99
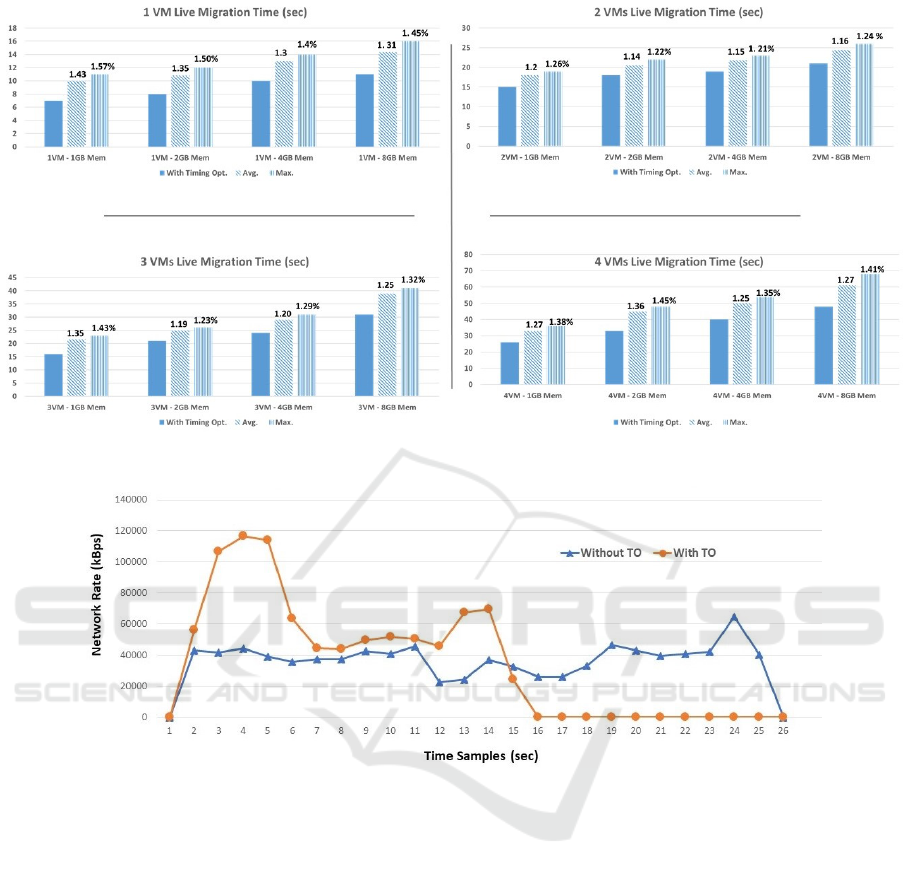
Figure 7: Network Stress - Impact of Timing Optimization on Live Migration Time.
Figure 8: Live Migration without and with Timing Optimization.
cantly more migration time. This time is basically
required for the memory content and dirty pages
iterative copy migration phase. This assures the
point that memory size is a significant parameter
in live migration performance.
• Multiple VMs migration has also significant im-
pact on live migration time. So the more number
of VMs migrated in parallel, the more migration
time required.
Fig. 7 has the same charts explanation like Fig. 6
and the difference is mainly in the results numbers.
From the charts in Fig. 7, we share the following ob-
servations:
• Live migration time for network intensive work-
load shows lower values than memory intensive
workloads. This is basically because the content
and the dirty pages rate to be migrated is signifi-
cantly bigger for memory intensive workloads.
• Table 2 shows also the average of the percentages
numbers in Fig. 7; which shows 126% on average
more migration time and 136% maximum migra-
tion time versus the migration time achieved with
using the proposed timing optimization approach.
This means that the proposed approach can save
up to 27% of the migration time and on average it
saves 21% of the migration time for network in-
tensive applications.
8 CONCLUSION
Live migration is an essential feature for virtual datan-
center and cloud computing environment. Servers
load balance, power saving, disaster recovery and dy-
namic resource management are all dependent on live
migration and so it is normal to find tens or even hun-
CLOSER 2020 - 10th International Conference on Cloud Computing and Services Science
100

dreds of live migration events that run every day in
modern datacenters. We showed that timing selection
for live migration plays a significant role in live mi-
gration cost and performance due to the dependency
on the datacenter networking utilization. Currently
network admins proceed with live migrations in a trial
and error manner, so if migration fails due to network
contentions they request it again.
In this paper, we propose a timing optimization
technique for live migration that uses previously pro-
posed live migration cost prediction and other related
datacenter IP network flow prediction technique for
the next hour. Testing results show that live migra-
tion time can be saved with up to 50% of migration
time and in average it saves 32% of the VMs migra-
tion time for memory intensive workloads. For net-
work intensive applications, the proposed algorithm
can save up to 27% of the migration time and on av-
erage it saves 21% of the migration time. This tim-
ing optimization technique can be useful for network
admins to save migration time with utilizing higher
network rate and higher probability of success. For
future work, we plan to study the CPU consumption
overhead of this proposed model and compare it with
using other network prediction techniques for timing
optimization of VMs live migration.
REFERENCES
https://code.vmware.com/tool/vmware-powercli/6.5.
https://httpd.apache.org/docs/2.4/programs/ab.htm. https://
httpd.apache.org/docs/2.4/programs/ab.html.
Hyperlm:https://docs.microsoft.com/en-us/
previous-versions/windows/it-pro/
windows-server-2012-r2-and-2012/.
Hypervsw:https://docs.microsoft.com/
en-us/windows-server/virtualization/
hyper-v-virtual-switch/hyper-v-virtual-switch.
libvirt:https://libvirt.org/drvqemu.html.
Memstress:https://people.seas.harvard.edu/
∼
apw/stress/.
Motionxen:https://docs.citrix.com/en-us/xenserver/7-0/
downloads/administrators-guide.pdf.
Netvmotion:https://docs.vmware.com/en/vmware-vsphere/
6.7/com.vmware.vsphere.vcenterhost.
doc/guid-7dad15d4-7f41-4913-9f16-567289e22977.
html.
Redhatmig:https://developers.redhat.com/blog/2015/03/24/
live-migrating-qemu-kvm-virtual-machines/.
vds:https://docs.vmware.com/en/vmware-vsphere/
6.0/com.vmware.vsphere.networking.
doc/guid-3147e090-d9bf-42b4-b042-16f8d4c92de4.
html.
Vmkernel:https://docs.vmware.com/en/vmware-vsphere/
6.7/com.vmware.vsphere.networking.
doc/guid-d4191320-209e-4cb5-a709-c8741e713348.
html.
www.vmware.com/products/vcenter-server.html.
Xenvsw:https://docs.citrix.com/en-us/citrix-hypervisor/
technical-overview.html.
Akoush, S., Sohan, R., Rice, A., Moore, A. W., and Hop-
per, A. (2010). Predicting the performance of virtual
machine migration. In Proceedings of the 2010 IEEE
International Symposium on Modeling, Analysis and
Simulation of Computer and Telecommunication Sys-
tems, MASCOTS ’10, pages 37–46, Washington, DC,
USA. IEEE Computer Society.
Baek, S., Kwon, D., Kim, J., Suh, S. C., Kim, H., and
Kim, I. (2017). Unsupervised labeling for supervised
anomaly detection in enterprise and cloud networks.
In 2017 IEEE 4th International Conference on Cy-
ber Security and Cloud Computing (CSCloud), pages
205–210.
Berral, J. L., Gavald
`
a, R., and Torres, J. (2013). Power-
aware multi-data center management using machine
learning. In 2013 42nd International Conference on
Parallel Processing, pages 858–867.
Boutaba, R., Salahuddin, M. A., Limam, N., Ayoubi, S.,
Shahriar, N., Estrada-Solano, F., and Caicedo, O. M.
(2018). A comprehensive survey on machine learning
for networking: evolution, applications and research
opportunities. Journal of Internet Services and Appli-
cations, 9(1):16.
Chabaa S, Z. and Antari J. (2010). Identification and predic-
tion of internet traffic using artificial neural networks.
In Journal of Intelligent Learning Systems and Appli-
cations, volume 2, pages 147–155.
Elsaid, M. E., Abbas, H. M., and Meinel, C. (2019). Ma-
chine learning approach for live migration cost pre-
diction in vmware environments. In Proceedings of
the 9th International Conference on Cloud Comput-
ing and Services Science, CLOSER 2019, Heraklion,
Crete, Greece, May 2-4, 2019, pages 456–463.
Fernando, D., Terner, J., Gopalan, K., and Yang, P. (2019).
Live migration ate my vm: Recovering a virtual ma-
chine after failure of post-copy live migration. In
IEEE INFOCOM 2019 - IEEE Conference on Com-
puter Communications, pages 343–351.
Gupta, T., Ganatra, J., and Samdani, K. (2018). A survey
of emerging network virtualization frameworks and
cloud computing. In 2018 8th International Confer-
ence on Cloud Computing, Data Science Engineering
(Confluence), pages 14–15.
Hu, B., Lei, Z., Lei, Y., Xu, D., and Li, J. (2011). A
time-series based precopy approach for live migra-
tion of virtual machines. In 2011 IEEE 17th Inter-
national Conference on Parallel and Distributed Sys-
tems, pages 947–952.
Hu, L., Zhao, J., Xu, G., Ding, Y., and Chu, J. (2013).
Hmdc: Live virtual machine migration based on hy-
brid memory copy and delta compression.
Li, Y., Liu, H., Yang, W., Hu, D., Wang, X., and Xu, W.
(2016). Predicting inter-data-center network traffic
using elephant flow and sublink information. IEEE
Live Migration Timing Optimization for VMware Environments using Machine Learning Techniques
101

Transactions on Network and Service Management,
13(4):782–792.
Sahni, S. and Varma, V. (2012). A hybrid approach to live
migration of virtual machines. In 2012 IEEE Interna-
tional Conference on Cloud Computing in Emerging
Markets (CCEM), pages 1–5.
Shen, H. and Zhou, H. (2017). Cstorage: An efficient
classification-based image storage system in cloud
datacenters. In 2017 IEEE International Conference
on Big Data (Big Data), pages 480–485.
Singh, N. and Rao, S. (2012). Online ensemble learning
approach for server workload prediction in large dat-
acenters. In 2012 11th International Conference on
Machine Learning and Applications, volume 2, pages
68–71.
Tseng, H., Lee, H., Hu, J., Liu, T., Chang, J., and Huang,
W. (2011). Network virtualization with cloud virtual
switch. In 2011 IEEE 17th International Conference
on Parallel and Distributed Systems, pages 998–1003.
Zhitang Chen, Jiayao Wen, and Yanhui Geng (2016). Pre-
dicting future traffic using hidden markov models. In
2016 IEEE 24th International Conference on Network
Protocols (ICNP), pages 1–6.
Zhu, Y. and et al (2013). Network traffic prediction based
on particle swarm bp neural network. In Journal of
Networks, volume 8, page 2685.
CLOSER 2020 - 10th International Conference on Cloud Computing and Services Science
102
