
Learner Performance Prediction Indicators based on Machine
Learning
Karim Sehaba
a
Université de Lyon, CNRS. Université Lyon 2, LIRIS, UMR5205, F-69676, France
Keywords: Learning Indicator, Performance Predictions, Interaction Traces, Learning Analytics.
Abstract: This work is interested in the analysis of learners’ performances in order to define indicators to predict their
results based on their interactions with a learning environment. These indicators should alert learners at risk,
or their teachers, by highlighting their difficulties in order to help them get around them before it is too late.
For this, we have defined a trace analysis approach based on the use of machine learning methods. This
approach consists of preparing the plotted data automatically and manually, by selecting the attributes relevant
to learning, then automatically extracting indicators explaining the learner’s results. Our work was applied to
a data set resulting from a real training comprising 32593 learners producing 10 655 280 events. The accuracy
of our predictions has reached around 80%. Rules extraction methods were also applied in order to explain
the rules which govern the prediction indicator.
1 INTRODUCTION
Human learning via dedicated digital environments,
such as Learning Management System (LMS), has
become increasingly popular in recent years with
many benefits. This type of environment allows
teachers to share educational contents with their
learners and to follow their educational activities. It
also makes it possible to promote communication
(synchronous and asynchronous) and collaboration
between the learners and the latter and their teachers
without constraint of place and time. Among the
educational uses of this type of environment is
informal learning, or lifelong learning, in the
framework of Massive Open Online Course (Mooc)
in particular.
Despite the fact that Mooc have become very
popular, they face a fairly high dropout and failure
rate when compared to formal training. As noted in
(Nikhil Indrashekhar Jha et al 2019), the dropout rate
in a Mooc is generally 20% higher for students
enrolled online. It can even reach very high values
like 78% for Open University UK or 40% for Open
University de Chine (Tan e& Shao, 2015).
This work aims to develop indicators for
predicting learner performance based on its traces of
interaction. In general, a learning indicator is a piece
a
https://orcid.org/0000-0002-6541-1877
of information constructed from the data available in
the learning environment making it possible to
identify significant behaviors of the learner. The
indicator can be intended for the learner himself or for
his tutor. By trace, we mean the history of user actions
on a Learning Management System. More precisely,
our objective is therefore to predict the direction,
good or not, that the learner is taking based on his first
traces. The interest of such indicators is to alert the
learner at risk (or his tutor), in a timely manner before
it is too late, by highlighting his/her difficulties in
order to help him/her bypass them at the right time.
Learning indicators have been the subject of
several research studies (Yun et al 2019) (You 2016)
(Carrillo et al. 2017). They are generally designed by
learning experts in the form of mathematical formulas
indicating, for example, the level of attendance of the
learner, his/her level of : mastery of a given course,
collaborations with other learners, engagement in
learning activities, etc. In the context of open and
massive learning environments, it becomes more and
more difficult for a human expert to model reliable
learning indicators, more particularly predictors of
learner performance, which cover the different
learner situations and profiles. In addition, these
environments make it possible to collect a large
amount of data tracing the learners activities. Our
Sehaba, K.
Learner Performance Prediction Indicators based on Machine Learning.
DOI: 10.5220/0009396100470057
In Proceedings of the 12th International Conference on Computer Supported Education (CSEDU 2020) - Volume 1, pages 47-57
ISBN: 978-989-758-417-6
Copyright
c
2020 by SCITEPRESS – Science and Technology Publications, Lda. All rights reserved
47

approach thus aims to use machine learning methods
to predict the performance of the learner by analyzing
the data collected from the learning environment. In
this context, the research questions we face to achieve
this objective are:
1. How to identify, among the set of events
collected via the learning platform and
represented in the traces, those which have a
significant impact on the learner’s result?
2. How to calculate the learner performance
prediction indicator based on its important
events?
3. How to facilitate the interpretation and
understanding of its indicators by users
(learner or trainer)?
To answer these questions, we propose a trace
analysis approach to select the important events,
which constitute the attributes/characteristics which
will then be used by supervised learning algorithms
to predict the learner’s outcome. In order to explain
the rules that govern the learner’s outcome, we use
rule extraction algorithms.
The rest of the article is organized as follows. The
following section presents a state of the art on
learning indicators and predicting learner
performance. Section 3 presents the principle of our
approach. Section 4 describes the dataset used to
apply our approach. The latter is detailed in section 5.
The last section is devoted to discussion, conclusions
and some perspectives.
2 STATE OF THE ART
Although the concept of indicator is frequently used
in Technology Enhanced Learning research, there is
no unanimous definition. In general, the indicator is a
tool (device, instrument, quantity) for evaluation or
information which should serve as an aid to decision-
making. Note that the definition of a size indicator is
constrained by both the availability of data that will
allow it to be calculated and by the requirements and
expectations of the people who will have to use it.
According to (Dimitracopoulou, 2004), an
indicator is a variable in the mathematical sense to
which a series of characteristics is attributed. It can be
in digital, alphanumeric or even graphic form. Its
value has a status which can be raw (without defining
unit), calibrated or interpreted. The calibration of the
indicator values is highly dependent on the context
and the conditions of use. The indicators are generally
calculated from user activities (administrator,
learners, teacher, etc.) on the various teaching
resources or their communications via the learning
platform (messaging, chat, forums, etc.). The data for
these activities can be retrieved from the platform’s
log files. The choice of data to select depends on the
inputs of the analytical method that specifies the
indicator.
From the collected data, several types of
indicators can be calculated, including behavioral,
cognitive or social indicators (Diagne, 2009). A
behavioral indicator shows the achievement of a skill
in an observable way. A cognitive indicator reflects
the level of knowledge, the knowledge that is easier /
more difficult to acquire, the number of solutions
proposed by each learner, the learning objectives, etc.
A social indicator indicates the level of collaboration,
coordination or social organization in a group of
learners.
The formalization of these indicators is generally
designed by domain experts. However, with the
increase of digital resources for human learning and
their online uses via dedicated platforms, it becomes
more and more difficult for a human expert to model
reliable learning indicators, which cover the different
learner situations and user profiles. To fix this
problem, the user of Machine Learning techniques for
the analysis of learning data is very widespread today
(Pena, 2014).
In this context of Machine Learning approaches,
in (Estela Sousa Vieira et al 2018) the authors were
interested in predicting learners’ results (failure or
success) in a social environment dedicated to
learning. This is the SocialWire platform. The latter
is able to collect learners’ actions and record them as
an event in an activity log in the form: subject verb
object. From all the data collected, the authors
selected 9 characteristics (attributes), estimated to
have an influence on the final performance of the
learners, such as the consultation of a given course,
the type of assessment chosen by the student
(continuous assessment or final exam), etc.
In order to identify the most influential
characteristics on the student’s results, the authors
carried out a statistical correlation study based on two
tests: 1/ The sample correlation ῥ were computed and
the linear regression for measure the correlations
between the 9 features and the final grades obtained
in the subject. 2/ The Smirnov’s statistical test was
used to study the correlation between the features
under study on the students who pass or fail the
subject. For the prediction of student results (success
or prediction), the algorithms were used are logistic
regression (LR), linear discriminant analysis (LDA)
and support vector machines (SVM) with the use of
k-fold cross validation (with 5 folds).
CSEDU 2020 - 12th International Conference on Computer Supported Education
48

(Nikhil Indrashekhar Jha et al 2019) have used the
OULAD dataset to predict whether or not a student
will drop out of the course, and if she/he doesn’t give
up does he/she succeed or fail. The following
machine learning algorithms were used: Distributed
Random Forest (DRF), Gradient Boosting Machine
(GBM), Deep Learning (DL) with cross validation
with 10 folds. The learning was carried out through
four categories of data:
Demographic information that achieved
between 0,61 and 0,64 AUC (Area under the
Receiver Operating Characteristics Curve) on
the validation set.
Assessment scores over 0,82 AUC, and high as
0,84 for GBM
The model based on VLE interaction features
achieved around 0,88 AUC for GLM, and 0,90
for DL, GBM and DRF on the validation data.
The model based on all attributes
(Demographic information, Assessment scores
and VLE interactions) only achieved about
0.01 higher AUC than the models based on the
VLE interactions only.
(Jabeen Sultana et al 2019) focuses on the
discovery of student performance using data mining
techniques, specifically the algorithms of Deep
Neural, Bayes Net, SVM, Random Forest, Decision
tree and Multi-class Classifiers. For this, the authors
used Weka and Rapid Miner software. The dataset
includes 1,100 student records. 11 characteristics
were used by the data mining algorithms, notably the
resources visited, discussion, number of absences,
etc. The techniques that have given optimal results are
MLP, decision trees and random forest with
maximum precision of 99.45%, 99.81% and 100%.
The paper (Livieris, 2012) uses a neural network
to predict learners’ performance. This analysis is
useful for both the learner and their teachers.
However, this model requires a large amount of data
to give reliable results. In (Yukselturku, 2014), the K-
Nearest Neighbor and decision tree methods were
used to identify learners who drop out. In (Rokach,
2014), the decision tree was used to predict success
or failure of classes.
In summary, the use of machine learning
algorithms to predict learners’ performance yields
interesting results as shown by numerous research
studies. These works make it possible to predict
dropout or success/failure of learner. However, we
note that these works lack a methodology specifying
on what basis one can choose the characteristics
(attributes or features) which must intervene in the
prediction or the machine learning algorithms to be
used for the prediction.
Another limitation is that the prediction model is
usually a black box, which predicts a learner’s
performance from a number of inputs. Indeed, so that
the learner (and/or teacher) can better understand the
reasons for his/her performance, we should provide
him/her with indicators specifying the models / rules
that govern these results (positive as a success,
negative as a dropout or a failure).
From this analysis, we target, in this paper, the
development of a methodology for predicting
learners’ performance using machine learning. This
methodology should answer the three research
questions posed in the introduction, namely: how to
identify the data (characteristics or features in
Machine Learning) that impact the learner’s
performance? How to use them to predict these
performances? How to facilitate the interpretation
and understanding of the models that govern this
performance.
The principle of our approach is described in the
next section.
3 PRINCIPLE OF OUR
APPROACH
In our work, we are interested in the use of machine
learning methods to predict the learner outcome by
analyzing the interaction traces. For this, we use
supervised learning algorithms whose attributes (or
predictive variables) are the data collected from the
interactions between the learners and the learning
environment (such as the number of connections, the
number of resources consulted , or homework
completed...) and the target variable (or label) is the
student’s result (for example, failed, successful or
excellent).
Data for predictors and target variables are
usually scattered across multiple tables / locations of
the plotted data. A data preparation phase is therefore
necessary in order to group the data into a single file,
containing predictive and target variables, so that
learning algorithms can be applied to it.
As Figure 1 shows, our proposal is thus based on
three phases.
In the first phase, it involves manually selecting
the attributes involved in the supervised learning
process. Indeed, the traces collected via the platform
can contain a significant number of events which do
not are not all important for the learner’s outcome
(success, failure, withdrawals, etc.). In this phase, any
event that does not seem to impact the student’s result
is
excluded. Then it is a matter of applying learning
Learner Performance Prediction Indicators based on Machine Learning
49
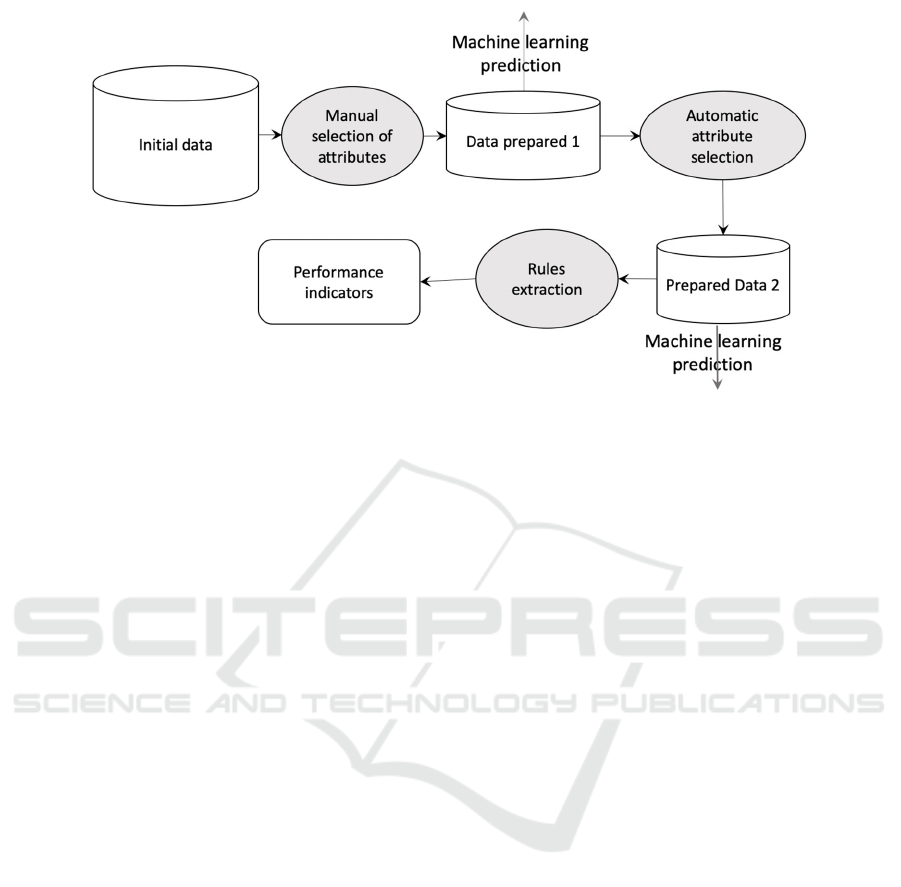
Figure 1: Trace analysis steps for predicting learner results.
algorithms to the selected data in order to predict the
student’s outcome.
In addition to the events provided directly from
the LMS platform, high-level information, obtained
by aggregating low-level events, can be considered
among the predictive attributes of machine learning,
such as for example the number of sites visited
calculated at from all the sites consulted by the
learner.
During this step, the choice of classification
algorithms is made. Indeed, in the literature, there is
a plethora of methods, each with its advantages and
disadvantages. Some are dedicated for data whose
target variable is binary (failure or success) such as
logistic regression, others for target variables taking
several values (withdrawal, failure, success,
excellence, etc.). Some require only a small amount
of learning data like Naive Bayes, while others
require a large amount of data like neural networks.
Some may be unstable (small variations in the data
can lead to very different results) like decision trees,
others are rather robust to noisy data like the nearest
K neighbor. In short, the choice of algorithms to apply
requires a certain expertise in machine learning in
order to determine the most appropriate method. It is
also possible to test several algorithms by comparing
their performance.
The performance of supervised classification
methods is based on dividing the data into two parts:
training data and test data. This indicates how the
model will behave in cases it has never encountered
before. This easy-to-implement method could bias the
performance result if we accidentally use a really
difficult or really easy test set. To work around this
limitation, the cross-validation has been proposed.
This consists of using the entire data set for training
and validation by cutting them into k folds. In turn,
each of the k parts is used as a test set and the rest is
used as a data set. The overall performance is thus
obtained by averaging the performance obtained on
the K folds.
For both types of methods (training-test division
or cross validation), quality measures are proposed,
such as the precision which indicates the proportion
of well classified elements of a given class, the recall
which indicates the proportion of elements well
classified in relation to the number of elements of the
class to be predicted, and / or the f-score which
compromises between them. The ROC curve can also
be used to measure the performance of a binary
classifier.
In the second phase, the selection of the important
attributes, from among all the attributes selected
during the first phase, is done automatically using
dedicated feature selection algorithms. Like the first
phase, supervised learning algorithms are also applied
to the data of important attributes.
Attribute selection is a process of selecting a
subset of relevant attributes to use in building a
predictive model. This selection can promote the
establishment of an accurate prediction by removing
unnecessary, irrelevant or redundant attributes that
can reduce the accuracy of the model. It also makes it
possible to produce models that are simple to interpret
and understand. A distinction is made between the
Filter, Wrapper and Embedded selection methods.
The first is to assign a score to each attribute, then
classify all the attributes according to their scores.
Then delete the attributes with a low score. The
second is to find the set of relevant attributes by
CSEDU 2020 - 12th International Conference on Computer Supported Education
50
preparing, evaluating and comparing different
combinations of attributes. The third determines the
attributes that contribute most to the accuracy of the
model.
During the first two phases, we managed to
identify the direction, good or bad, that the learner
takes by analyzing his traces but without explaining
the reasons for this or that result. Thus, the purpose of
the third phase is to explain the predictions using rule
extraction algorithms (the rules that govern the
learner’s outcome). It’s about identifying the recipes
that allow a learner to succeed and alerting them to
behaviors that are doomed to failure. To do this, the
decision tree extraction algorithms are generally used.
A decision tree can be described as a data flow
diagram where each node describes a test on a
learning variable, each branch represents a result of a
test and each leaf contains the value of the target
variable. The tree constructed to explain the
prediction model, which constitutes an explicit
indicator for the user.
The next Section presents a dataset we used to
apply our approach.
4 DATASET OULAD
Several datasets from LMS platforms have been made
available to researchers and used in various research
studies in learning analytics in particular. Harvard
University, through its edX platform (Cobos, Wilde,
& Zaluska, 2017) (Liang, Li, & Zheng, 2016), Khan
Academey (Piech et al., 2015), or Coursera ( Chaplot,
Rhim, & Kim, 2015), which host several online
courses and provide researchers with free data.
In order to implement our approach, we used a
dataset from real training using a virtual training
environment (VLE). This is Open University
Learning Analytics Dataset rated OULAD
(downloadable here:
https://analyse.kmi.open.ac.uk/open_dataset)
OULAD is a tabular data collection of students
from the years 2013 and 2014. It contains various data
on courses, students demographic information,
assessment dates and scores, and their interactions
with a virtual training environment of the open
university for seven selected modules.
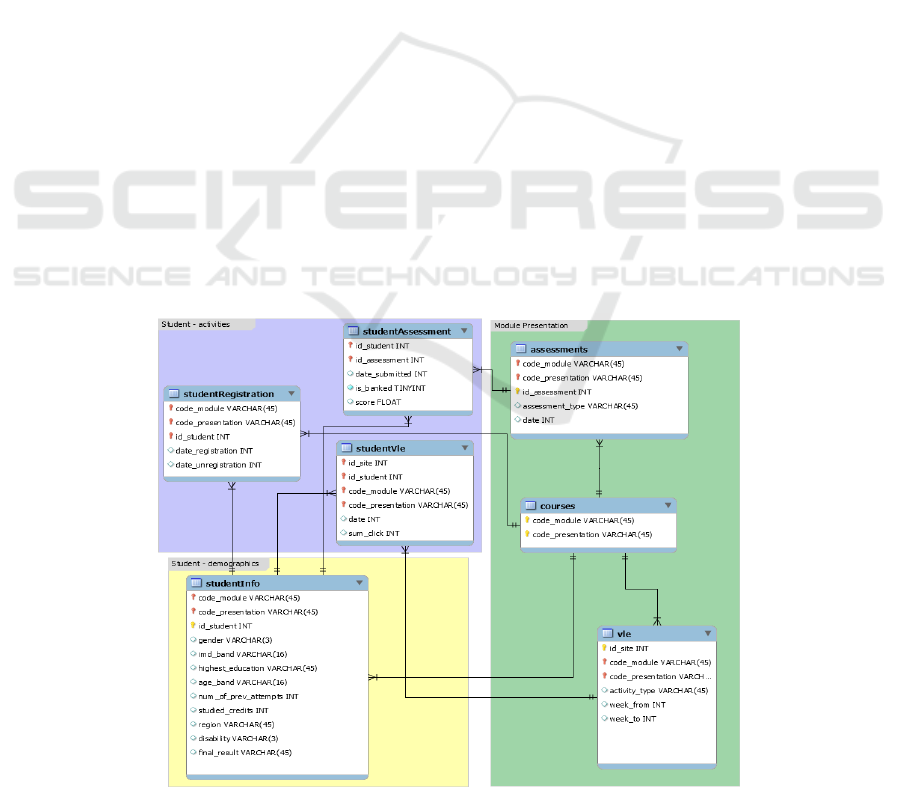
Like the class diagram in Figure 2, the dataset
contains seven tables, each of which contains
different information, which can be linked together
using identifier columns. The dataset is student
oriented, the focal point in this dataset.
Student data includes information on their
demographics and enrollment in modules, assessment
results and journals of their interactions with the
virtual training environment represented by daily
summaries of student clicks (10,655,280 entries).
The dataset contains 22 module presentations
with 32,593 students.
The course table is characterized by the module
code (code_module) identifying the course, the code
name
of the presentation (code_presentation) which
Figure 2: Data structure of the OULAD dataset.
Learner Performance Prediction Indicators based on Machine Learning
51

consists of the year and the letter B for the
presentation starting in February and the letter J for
the presentation starting in October. Each module has
a presentation duration in days (module_
presentation_length).
The assessment table contains information on
assessments, module presentations. Usually each
presentation has a number of evaluations followed by
the final exam. There are three types of assessment,
namely the one marked by the tutor (TMA), the one
recorded on a computer (CMA) and the final exam
(Examination).
The vle table contains information about the
resources available in the Virtual Training
Environment (VLE). These are usually html pages,
PDF files, etc. Students have access to these
documents online and their interactions are recorded,
such as, for example, id-site: the number of visits to a
given site, or type_activity: the role associated with
the module’s resource (URL, quiz, etc.)
The studentInfo table contains demographic
information of students such as gender, region,
highest level of study, number of credits for the
module followed as well as the student’s final result
which can be: withdrawn, fail, pass or excellent.
The studentRegistration table contains
information on the student’s registration date
(dte_registration) for the presentation of the module.
For students who have unsubscribed, the unsubscribe
date (dte_unregistration) is also recorded.
dte_registration gives the number of days since the
start of the module and dte_unregistration expresses
the number of days since the start of the presentation
of the module.
The studentAssessment table contains the results
of student assessments. If the student does not submit
the assessment, no results are recorded. Final exam
submissions are missing if the assessment results are
not stored in the system. The date_submitted
expresses the date of submission of the student
measured in number of days since the start of the
presentation of the module. This table also contains
the student’s score in this assessment. The score is
between 0 and 100. The score below 40 is interpreted
as a failure.
The studentVle table contains information on each
learner’s interactions with VLE resources. date is the
date of the student’s interaction with the resource,
measured in number of days since the start of the
module presentation. sum_click gives the number of
interactions between a learner and the resource during
the day.
The data in this dataset has been prepared, using
joins between the different tables, so that it can be
used by the learning algorithms. It is thus a question
of presenting all the data of the dataset in the form of
a single table made up of columns representing the
attributes of the various tables previously presented
with as last column the result of the student whose
values can be: withdrawn, faile, pass or excellent.
This preparation phase, like that of indicator
calculation, was implemented using the Python
language and its Scikit-Learn libraries.
5 CALCULATION OF
PREDICTION INDICATORS
In this section, we present the progress and the results
of the three phases on the OULAD data.
5.1 Manual Selection
As mentioned in Section 3, in Oulad’s seven tables,
there are 25 attributes (columns). Among these
attributes, we have selected 16 to do the learning and
the prediction of the final result of each learner
starting from the data relating to these attributes. In
fact, attributes that are not significant for learning
have been eliminated, such as: module_
presentation_length and type_activity, etc.
The selected attributes are:
id_student: a unique identification number for
the student.
module_code: the identification code of a
module on which the student is registered.
code_presentation: the identification code of
the presentation during which the student is
registered on the module.
gender: the gender of the student.
region: identifies the geographic region where
the student lived while taking the presentation
module.
highest_education: the highest level of
education of the student at the entrance of the
module presentation.
num_of_prev_attempts: the number of times
the student has tried this module.
studied_credits: the total number of credits for
the modules the student is currently studying.
disability: indicates whether the student has
declared a disability.
dte_registration: the date of registration of the
student for the presentation of the module. This
is the number of days measured compared to
the start of the presentation of the module (for
example, the negative value -30 means that the
CSEDU 2020 - 12th International Conference on Computer Supported Education
52

student has registered for the presentation of
the module 30 days before its start).
dte_unregistration: the student’s unsubscribe
date from the presentation of the module, this
is the number of days measured compared to
the start of the presentation of the module.
Students who have completed the course have
the value T_c (Completed course).
final_result: the student’s final result in the
presentation of the module.
In addition to these attributes, we have added four
attributes calculated from the original data:
nb_site: the total number of sites visited by the
student calculated from the id-site visited by
each student.
sum_click: the sum of the student’s clicks on
the different training sites.
avg_date: the average of the dates of
submission (date_submitted) of the
assessments of each student.
avg_score: the average of the scores of the
assessment calculated from the scores (score)
of the assessments of each student.
Once the data had been prepared, the question
arose of the algorithm to be used for learning. There
are a plethora of supervised classification algorithms.
We tested 4 using Python Scikit-Learn:
Algo 1 - DecisionTree Classifier : This method
automatically selects discriminating predictors
from data to extract logical rules that will be
used to classify the data. This method requires
little data preparation and can process
numerical and categorical data but create
complex trees.
Algo 2 - GaussianNB : Naïve Bayes algorithm
based on the Bayes theorem with the
assumption of independence between each pair
of characteristics. This algorithm requires a
small amount of training data to estimate the
necessary parameters. Naïve Bayes classifiers
are extremely fast compared to more
sophisticated methods. However, its prediction
rate is relatively low.
Algo 3 - KNeighbors Classifier : It is a lazy
type of learning that does not attempt to build a
general internal model, but simply stores the
examples of the training data. The
classification is carried out using a simple
majority vote of the K closest to each point.
This algorithm is simple to implement, robust
to noisy learning data, and effective if learning
data is important. But the cost of the calculation
is high because it is necessary to calculate the
distance from each instance to all the training
samples.
Algo 4 - LinearSVC : Support vector machine
algorithms represent training data as a set of
points in a space and aim to divide that data
with clear spaces and as wide a margin as
possible. The new data (for example test) is
then mapped into this same space in order to
identify the categories in which they belong
based on the side of the gap on which they fall.
This algorithm is effective in processing large
data.
Table 1 shows the details of these 4 algorithms
using Cross-Validation with 5 Folds. Cross validation
with k folds consists of cutting the data set into k
approximately equal parts. Each of the k parts is used
in turn as a test game. The rest (in other words, the
union of k-1 other parts) is used for training.
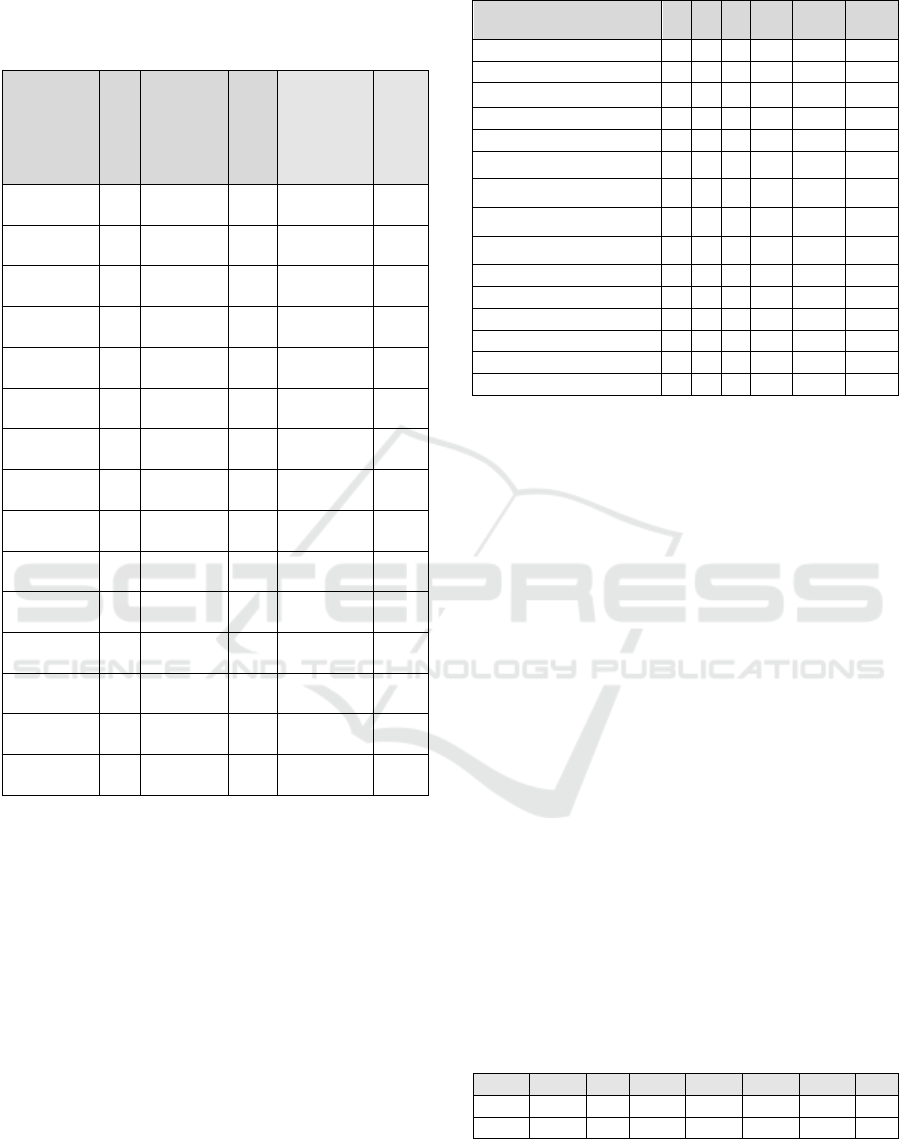
Table 1: Teaching accuracy on manually selected data.
Algos P1 P2 P3 P4 P5 M SD
1 0.9230 0.9670 0.9444 0.9444 0.9545
0.9467 0.0161
2 0.7362 0.8021 0.9 0.8888 0.8636
0.8381 0.0684
3 0.7692 0.7692 0.8111 0.8222 0.8409
0.8025 0.0322
4 0.3076 0.2967 0.8444 0.2555 0.8522
0.5113 0.3082
In Table 1, P1, P2… mean the precision in each
fold. The last two columns of the table present the
average and the Standard-Deviation of the different
precisions of each algorithm using cross-validation.
In order to determine the algorithms best suited to
our data and thus those that give the best predictions,
we selected those whose mean is bigger and the
standard deviation is smaller, which led us to select
algorithms 1 (DecisionTreeClassifier ) and 2
(GaussianNB).
This first contribution allowed us to appropriate
data selection using Python basic functions and then
identify the algorithms best suited for our context to
predict the outcome of a given student analyzing his
footsteps. The next question is about the relevance of
the 16 attributes that we have identified as important
for learning and prediction. Are they all important?
To answer this question, we conducted another study
that is to automatically identify important attributes
and apply these learning algorithms to construct
reliable indicators. This work is presented in the next
section.
5.2 Automatic Selection
The selection of attributes is a technique in which we
select the entities that have the strongest relationship
Learner Performance Prediction Indicators based on Machine Learning
53
with the target variable, in this case the result of the
student in this case (withdrawn, fail, pass, excellent).
Table 2: Automatic attribute selections.
Algo 1
Ranking
Algo 2
Ranking
Algo 3
Ranking
date_unregistr
ation
0.282
date_unregist
ration
35,915 id_student 1134,40
avg_date 0.169 avg_score 12,661 sum_click 258,171
avg_score 0.147 avg_date 8,767
date_unregistr
ation
34,382
nb_site 0.074
code_present
atio
3,756 nb_site 23,595
sum_click 0.071 nb_site 3,657 avg_date 20,382
region 0.054 sum_click 2,983 avg_score 15,329
id_student 0.051
studied_credi
ts
2,840
studied_credit
s
13,466
date_registrati
on
0.049 region 2,807
date_
registration
8,594
studied_credit 0.025 gender 1,735
Code_
presentation
5,791
highest_
education
0.024 disability 1,574 region 5,776
code_
presentation
0.022 date_registra 1,421 disability 4,527
gender 0.021
highest_educ
ation
1,036
highest_
education
3,061
disability 0.004 id_student 0,974 gender 2,135
num_of_prev_
attempts
0.001
num_of_prev
_attempts
0,688
num_of_prev_
attempts
2,067
code_module 0 code_module 0 code_module 0
We applied three attribute selection algorithms to
the data in the table prepared in the first phase. These
are the algorithms:
Algo 1 : Extra_trees_cl assifier,
Algo 2 : SelectKBest(f_classif), and
Algo 3 : SelectKBest(ch i2).
Table 2 shows the results of these algorithms.
In order to select the most important attributes, we
used the following steps:
1. Calculate the classification of attributes in
the three algorithms.
2. For each attribute, calculate the sum of its
rankings in the three algorithms.
3. Sort the attributes from lowest sum to largest
sum.
The result of this classification is presented in the
following table:
Table 3: Classification of attributes by the three algorithms.
Attributes 1 2 3 Sum Case 1 Case 2
date_unregistration 1 1 3 5
avg_date 2 3 5 10 x x
avg_score 3 2 6 11
nb_site 4 5 4 13 x x
sum_click 5 6 2 13 x x
id_student 7 13 1 21
date_registration 6 11 8 25
x
studied_credits 10 7 7 24
x
code_presentation 11 4 9 24
region 8 8 10 26
x
highest_education 9 12 12 33
gender 12 9 13 34
disability 13 10 11 34
num_of_prev_attempts 14 14 14 42
code_module 15 15 15 45
The attributes date_unregistration, avg_score,
id_student, code_presentation have been eliminated
since they do not allow us the expected prediction.
Indeed, id_student is only used for SQL queries, the
code_presentation does not matter since we are
interested in the analysis of traces during all the
semesters, avg_score and date_unregistration
correspond to the classes that we want to predict and
not have as input data. Indeed, the student is success
if its avg_score is greater than or equal to 60 and
failure if less. The date_unregistration also indicates
whether the student has dropped out or not. If this date
is lower than the course end date, this means that the
student has abandoned. The module_code which has
only one value, so does not affect learning, has also
been eliminated.
We have chosen to select two sets of attributes
corresponding to the following two cases:
Case 1: sum-click, nb_site, avg_date.
Case 2 : sum-click, nb_site, date_registration,
region, studied credit, avg_date.
The following tables present the details of the two
algorithms (These algorithms were chosen since they
gave better results in the first phase) on the two cases:
Algo 1 : DecisionTree Classifier
Algo 2 : GaussianNB
Table 4: Precision of the two algorithms in case 1.
Algos P1 P2 P3 P4 P5 M SD
1
0.780 0.7690.8 0.8 0.818
0.793 0.019
2
0.747 0.7140.788 0.855 0.819
0.784 0.055
CSEDU 2020 - 12th International Conference on Computer Supported Education
54
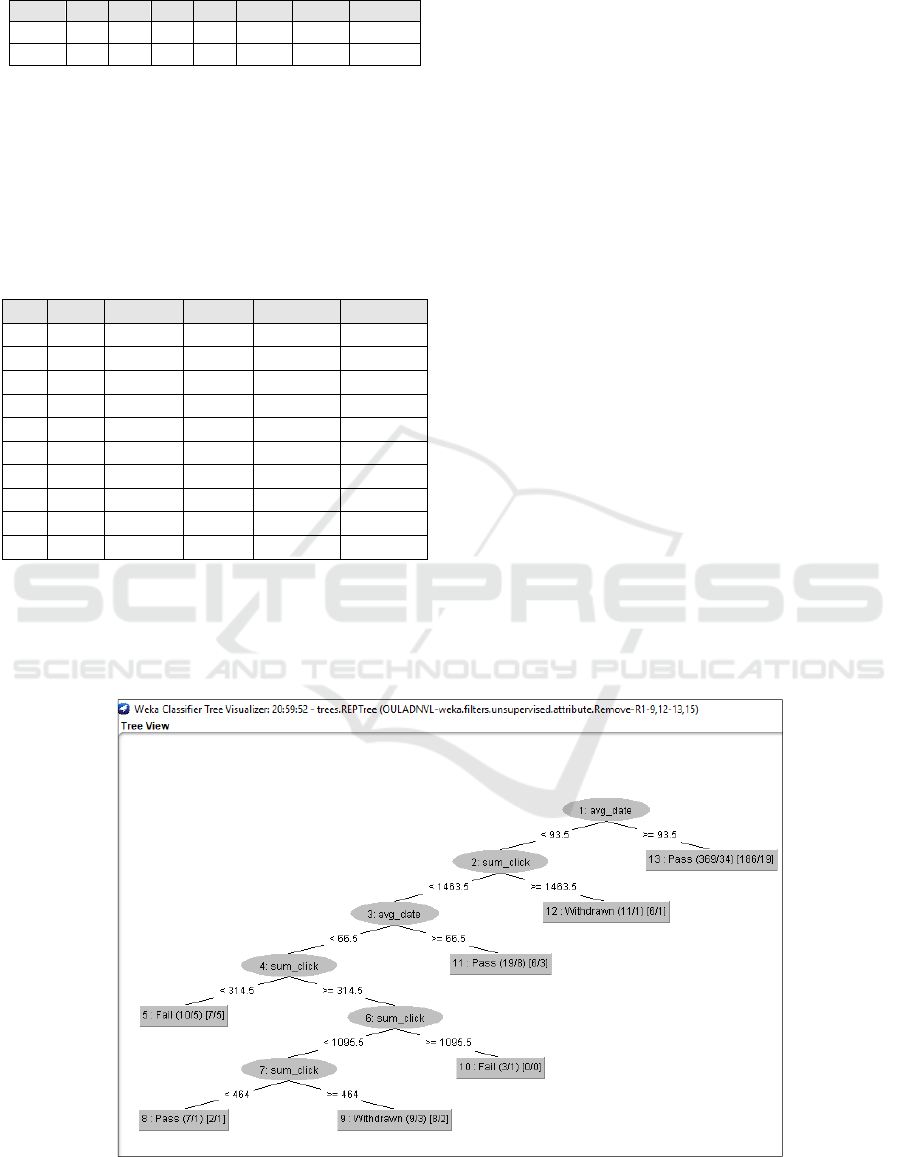
Table 5: Precision of the three algorithms in case 2.
Algos P1 P2 P3 P4 P5 Moy SD
1
0.802 0.758 0.766 0.822 0.806
0.792 0.027
2
0.747 0.736 0.822 0.877 0.806
0.798 0.057
In order to verify our predictions qualitatively, we
designed ten profiles containing only the values of the
attributes of the first case, containing only three
attributes. As shown in the table 4 and 5, for each
profile, the last column (Result) indicates the student
result. These profiles were defined using data from
OULAD.
Table 6: Verification of predictions on 10 typical profiles.
Profil nb_site sum_click avg_date Prediction Resultat
1 55 934 112
Pass Pass
2 50 499 121
Pass Pass
3 37 487 20
Withdrawn Withdrawn
4 61 2042 115
Pass Distinction
5 79 2590 93
Withdrawn Withdrawn
6 23 303 18
Fail Fail
7 79 2219 111
Distinction Distinction
8 26 240 43
Pass Fail
9 59 1980 88
Withdrawn Withdrawn
10 105 15716 113
Distinction Distinction
As shown in the figure below, the accuracy rate
of our prediction is 8/10 which corresponds to 80%
success, which corresponds to the results in Table 4.
5.3 Rules Extraction
Rule extraction was done using Weka
(https://www.cs.waikato.ac.nz/ml/weka/). The data
containing that the values of the attributes of the first
case were used for the extraction of rules. Indeed, as
the two tables show (4 and 5), we both get very close
details, nevertheless the first case is more interesting
since it only uses three attributes, so this case
generates a more simple as a tree based on the six
attributes.
Once this data has been loaded into Weka, the
Classifier Tree Visualization algorithm. REPTree is
used. The tree above shows that the student who has
an avg_date greater than 93.5 has a high chance that
he will get the Past result. Otherwise if an avg_date
<93.5, we consult the value of the sum_click attribute.
If the latter greater than or equal to 1463.5 the result
is generally Withdrawn otherwise we consult the
value avg_date again. If it is less than 66.5 we go to
sum_click if it is less than 314.5 so the result is failure
... As the tree shows, the Distinction class does not
appear, this may be due to the fact that the data has a
small number of instances of this class.
The generated decision tree corroborates with 7
profiles out of 10 (Profiles 1,2,3,5,6,8 and 9) and does
not corroborate with 3 profiles (4, 7 and 10)
The rules of this tree can be used as indicators to
identify, within the framework of Oulad’s training,
the orientation of the learner based on his number of
clicks, his dates of assessment reviews.
Figure 3: Generated rules tree.
Learner Performance Prediction Indicators based on Machine Learning
55

6 DISCUSSION AND
CONCLUSION
As shown in Section 2 State of the art , predicting
learner outcomes is an important topic that has been
the subject of much research. Approaches based on
machine learning algorithms generate prediction
models whose results are interesting overall.
However, in most cases these models remain
unexplained, such as a black box indicating the
outgoing class from a certain number of entries.
Compared to existing approaches for predicting
learners’ performance using machine learning
methods, our work offers a methodology based on
three stages, which allows us to define the process of
selecting attributes which is involved in machine
learning and on the other hand to explain the learning
model which governs the learner’s result. This model
is represented by rules which relate to a small number
of attributes which have a greater impact on the
learner’s result. Our methodology is a structuring
framework which nevertheless requires its
application in the context of experiments with
teachers in order to measure its degree of
intelligibility.
Our work focuses then on indicators of direction
predictions, good or bad, that learners take based on
their first tracks. In this context, we are interested in
three questions :
1. How to identify events that have a significant
impact on the learner’s outcome?
2. How to calculate the learner performance
prediction indicator based on its important
events?
3. How to facilitate the interpretation and
understanding of its indicators by users
(learner or trainer)?
To answer these two questions, after the data
preparation phase, we conducted a process consisting
of 3 phases: manual selection of attributes, automatic
selection of attributes, then extraction of rules. The
Oulad Dataset was used for the design, application
and validation of our approach. For the identification
of indicators from traces, we applied supervised
learning algorithms. The one that gives the best
precision is the Decision trees classifier.
As perspectives, we want further to formalize our
methodology and to develop the aspect of extracting
rules from traces to better explain the prediction
indicators of learning algorithms.
REFERENCES
Carrillo, R., Renaud, C., Prie, Y and Lavoue, E. Dashboard
for Monitoring Student Engagement in Mind Mapping
Activities. Proceedings - IEEE 17th International
Conference on Advanced Learning Technologies,
ICALT 2017, pp. 433-437, 2017.
Chaplot, D. S., Rhim, E., and Kim, J. (2015). Predicting
Student Attrition in MOOCs using Sentiment Analysis
and Neural Networks. In Proceedings of the Workshops
at the 17th International Conference on Artificial
Intelligence in Education AIED 2015; Volume 3:
Fourth Workshop on Intelligent Support for Learning in
Groups (ISLG) (pp. 7–12).
Cobos, R., Wilde, A., and Zaluska, E. (2017). Predicting
attrition from massive open online courses in
FutureLearn and edX. In Joint MOOCs workshops
from the Learning Analytics and Knowledge (LAK)
Conference 2017 (pp. 74–93). Simon Fraser University,
Vancouver, BC, Canada.
Diagne, F. (2009). Instrumentation de la supervision par la
réutilisation d’indicateurs : Modèle et
architecture.Thèse de doctorat. Université Joseph-
Fourier - Grenoble I.
Dimitracopoulou A., State of the art on Interaction and
Collaboration Analysis (D26.1.1). EU Sixth
Framework programme priority 2, Information society
technology, Network of Excellence Kaleidoscope,
(contract NoE IST-507838), project ICALTS:
Interaction and Collaboration Analysis, 2004.
Estela Sousa Vieira M., José C. López-Ardao, Manuel
Fernández-Veiga, Orlando Ferreira-Pires, Miguel
Rodríguez-Pérez: Prediction of Learning Success Via
Rate of Events in Social Networks for Education.
CSEDU (1) 2018: 374-382
Jabeen Sultana, M. Usha Rani, M.A.H. Farquad. Student’s
Performance Prediction using Deep Learning and Data
Mining Methods. International Journal of Recent
Technology and Engineering (IJRTE) ISSN: 2277-
3878, Volume-8, Issue-1S4, p 1018- 1021. June 2019.
Liang, J., Li, C., and Zheng, L. (2016). Machine learning
application in MOOCs: Dropout prediction. In 2016
11th International Conference on Computer Science
Education (ICCSE) (pp. 52–57). Nagoya, Japan.
Livieris, et al. Predicting students performance using
artificial neural networks, 8th PanHellenic conference
with International participation Information and
communication technologies, pp.321-328, 2012.
Liu, T., and Li, X. (2017). Finding out Reasons for Low
Completion in MOOC Environment: An Explicable
Approach Using Hybrid Data Mining Methods. In 2017
International Conference on Modern Education and
Information Technology (MEIT 2017) (pp. 376–384).
Chongqing.
Nikhil Indrashekhar Jha, Ioana Ghergulescu, Arghir-
Nicolae Moldovan: OULAD MOOC Dropout and
Result Prediction using Ensemble, Deep Learning and
Regression Techniques. CSEDU (2) 2019: 154-164
CSEDU 2020 - 12th International Conference on Computer Supported Education
56

Pena A. Educational data mining: A survey and a data
mining- based analysis of recent works. Expert systems
with applications,vol.41 (4), 1432–1462, 2014.
Piech, C., Bassen, J., Huang, J., Ganguli, S., Sahami, M.,
Guibas, L. J., and Sohl-Dickstein, J. (2015). Deep
Knowledge Tracing. In C. Cortes, N. D. Lawrence, D.
D. Lee, M. Sugiyama, and R. Garnett (Eds.), Advances
in Neural Information Processing Systems 28 (pp. 505–
513).
Rokach, L., Maimon, O., Data mining with decision trees:
theory and applications. World scientific. 2014.
Tan, M., and Shao, P. (2015). Prediction of student dropout
in e-learning program through the use of machine
learning method. International Journal of Emerging
Technologies in Learning (IJET), 10(1), 11–17.
You, J.W., Identifying Significant Indicators Using LMS
Data to Predict Course Achievement in Online
Learning, Internet and Higher Education, vol. 29, pp.
23–30,2016
Yukselturk, E., Ozekes, S., & Turel, Y. K., Predicting
Dropout Student: An Application of Data Mining
Methods in an Online Education Program. European
Journal of Open, Distance and E-Learning, Vol. 17, No.
1, pp. 118–133, 2014.
Yun, H.; Fortenbacher, A.; Helbig, R. and Pinkwart, N.
(2019). In Search of Learning Indicators: A Study on
Sensor Data and IAPS Emotional Pictures. In
Proceedings of the 11th International Conference on
Computer Supported Education - Volume 2: CSEDU,
ISBN 978-989-758-367-4, pages 111-121. DOI:
10.5220/0007734301110121
Learner Performance Prediction Indicators based on Machine Learning
57
