
Design of Learning Analytics Tool: The Experts’ Eyes View
Dafinka Miteva
a
and Eliza Stefanova
b
Faculty of Mathematics and Informatics, Sofia University “St. Kliment Ohridski”, Bulgaria
Keywords: Learning Analytics, Group Concept Mapping, Learning Management System.
Abstract: Learning Analytics (LA) tools are supposed to retrieve relevant data from Learning Management Systems
(LMS) and transform it into useful information for learners, trainers and education managers to increase
academic achievement and effectiveness of teaching and learning. This study reveals the experts vision for
LA tool features and design. The results of a survey conducted among professional pedagogues and education
experts, teachers and university professors, bachelor's and PhD students are presented, with the main purpose
of specifying what participants expect an LA tool to offer and how. Data analysis is discuss and visualized.
The assumed categories of functionality are summarized and detailed with full list of reports each of them
need to suggest for key LMS users roles: managers, teachers and students. Finally, some conclusions are
drawn about the variety of users’ demands and future work is outlined in order to complete the preliminary
preparation before being developed an expert LA tool and the effectiveness of education being improved.
1 INTRODUCTION
Living in the era of high technology and Big Data,
when mobile devices allow us to search for
information and learn new things anytime, anywhere,
when attractive teaching methods and training aids
present curriculum, student performance statistics are
still unsatisfactory (Eurostat, 2019). Moreover, one of
the most common reasons for dropping out of school
is “getting behind and low grades” (High School
Dropout Rate, 2019). One suggestion to increase the
effectiveness of education by using descriptive,
predictive and prospective analysis of collected data
is by using a Learning Analytics (LA) (LAK, 2011).
Modern learning management systems (LMS) and
their LA applications (I) improve learning outcomes
(9%), (II) support learning and teaching (35%), (III)
are deployed widely (9%) and (IV) are used ethically
(18%) (Viberg, Hatakka, Bälter, & Mavroudi, 2018).
The low spreading of LA is because their services do
not always give teachers the answers they need. In
addition, sometimes the pure data visualization
confuses revealing of results rather than helps
decision-making. This study presents the results of a
survey among experts what they expect from LA
functions of LMS in order data and artificial
intelligence to support improvements of education.
a
https://orcid.org/0000-0002-4841-2245
b
https://orcid.org/0000-0002-9697-2028
The final goal of the study is to extract requirements
for building LA tool which to empower the
effectiveness all players in education process through
visualizing available amount of data in LMS.
2 STATE OF ARTS
There are a number of studies inquiring what LA
features different LMS user’s roles need. Some of
them outline LA design and implementation from
teachers prospective (Dyckhoff, Zielke, Bültmann,
Chatti, & Schroeder, 2012), others get insights into
students prospective (Kilińska, Kobbelgaard, &
Ryberg, 2019) and features students really expect
(Schumacher & Ifenthaler, 2018). Some researches
describe smart LA (Ebner, Taraghi, Saranti, &Schön,
2015), others feature-based analysis of MOOC
(Chauhan & Goel, 2017). They draw a framework of
services and give useful tip for LA design by
principle. In final LA tool design will also be taken
into account applicable tips and tricks shared by other
researchers. The study presented in this paper uses
down-top technique. It starts with users’ expectations
and then find their place in the main framework. This
approach is described in the next section.
Miteva, D. and Stefanova, E.
Design of Learning Analytics Tool: The Experts’ Eyes View.
DOI: 10.5220/0009395503070314
In Proceedings of the 12th International Conference on Computer Supported Education (CSEDU 2020) - Volume 2, pages 307-314
ISBN: 978-989-758-417-6
Copyright
c
2020 by SCITEPRESS – Science and Technology Publications, Lda. All rights reserved
307

3 METHODOLOGY
To collect experts’ opinion and analyse data the
Group Concept Mapping (GCM) method (Kane &
Rosas, 2017) was used. This method has been
successfully applied in a number of scientific
researches, for example “to identify objectively the
shared understanding of a group of experts about
patient handover training interventions” (Stoyanov, et
al., 2012); „to identify key components used in
practice when applying technologies for lifelong
competence development of teachers“ (Stefanova,
2013)); “to select learning outcomes and form a basis
for a curriculum on handoff training for medical
students” (Stoyanov, et al., 2014); “to find the way to
prepare youth for tomorrow’s labor market”
(Kirschner & Stoyanov, 2018) and many others.
The research was conducted in the dedicated
online environment of Concept Systems Inc. Global
MAX (Concept System Global MAX, 2017), which
provides an easy and intuitive web-based interface for
organizing key activities: (1) brainstorming -
generating ideas in response to a research question,
(2) sorting ideas by similarity into groups, (3) rating
ideas by relevance to specific criteria, and (4)
analysing and visualizing data. The system allowed
interface localization and work with local (Bulgarian)
language which expanded the circle of experts, ready
to share their experience with e-learning and in
particular with LMS.
3.1 Selection of Experts
The first phase of the study (“brainstorming”)
involved 30 professionals from the Faculty of
mathematics and informatics, the Faculty of
education and the Center of Information Society
Technologies of Sofia University “St. Kliment
Ohridski” – pedagogues and experts in education,
Science, Technology, Engineering and Mathematics
teachers and university professors, PhD students and
Bachelor of Science students. What they have in
common is that they actively use LMS in their work
or training. In the next phase (“sorting and rating”)
participated 20 experts. The second group completed
additional questionnaire to share some social details
as (1) in what role they usually use LMS, (2) how
often they use LMS and (3) how many different LMS
they have experience with. The results of this survey
reveal that in the second phase 2 managers, 14
teachers and 4 students took participation. Half of the
experts use LMS every day, 6 – at least 3 times a
week, 3 – once a week and only one answered
“rarely”. On the terms of experience with various
LMS used, 3 participants responded that they know 5
or more LMS, 2 worked with 4 LMS, 3 used 3
different LMS, 3 used 2 LMS, and 2 participators use
primarily one LMS.
3.2 Data Collection
The focus question in response to which experts had
to brainstorming ideas during the first stage, was “In
Learning Analytics (LA) of LMS I would like to have
reports for…”. In order to give an idea to each expert
what kind of sentences could be proposed, a sample
answer was provided for each role:
Student: At any point during my training, I
would like to receive information about my
level of coping with curriculum compared to
other learners.
Teacher: I would like to have summary report
of students’ results in other disciplines so far.
Manager: I would like to see all students’
grades in several courses led by a teacher.
Experts were asked to generate as many ideas as
possible from the perspective of a student, teacher or
manager role. In order to avoid duplication and to
stimulate productivity, each participant had access to
the list of already collected sentences from other
participants. The brainstorming phase ended with a
collection of 95 expert suggestions for LA reports,
allocated respectively for student role: 23, teacher
role: 45 and manager role: 27.
Before moving on to the next phase, sentences
were synthesized in order to clear row data, remove
duplications, or separate suggestions that describe
more than one idea. Each proposal had to express
exactly one idea; to be relevant to the focus question;
to be clear and easy to understand; and not to be
written in negative form. Kane and Trochim (Kane &
Rosas, 2017) recommend the number of sentences
presented for sorting not to exceed 100 in order to
avoid confusions and loss of interest. After the
process of idea synthesis, the number of sentences
was reduced to 85 and the hint for LMS role
(manager, teacher or student) was removed to avoid
predefining and limiting experts to express their
professional vison.
All sentences were processed outside the Global
Max, imported back, and permanently shuffled to
eliminate the sequence of similar ideas generated at
the same time. Thus, the result of sorting was more
relevant (Kane & Trochim, 2007).
During the next sorting phase, experts were free
to sort all statements, according to their view of the
meaning or the topic of suggestions. In special letter
of invitation and in the online environment a detailed
CSEDU 2020 - 12th International Conference on Computer Supported Education
308
guidance on the sorting process was provided.
Participants were initially asked to read all unsorted
suggestions to get a holistic view, then to create the
categories that describe the proposed reports, to name
them as they deem fit and finally using drag-and-drop
technology to put each idea into the category that best
fits it. There was no limit to the number of categories
required, just a recommendation that the optimal
number is between 5 and 20, and not to use common
names like "other", "miscellaneous", "important" or
"difficult". There was a special requirement not to use
the name of the LMS role like “manager”, “teacher”,
or “student” as a category name. Each idea could be
sorted into exactly one category and there should not
left unsorted ideas. In case a sentence was not related
to any other, the recommendation was to put it into a
separate group. As a result, experts divided sentences
into different number of categories between min of 4
and max of 13 with the average of 8.6.
In addition to sorting, the experts in the second
group had to rank ideas on importance by two criteria:
usefulness/significance and applicability/feasibility.
The rating scale ranged from 1 - relatively useless/
extremely difficult to apply to 5 - extremely useful/
easily applicable.
When sorting and rating phases completed, a data
check and validation was carried out to start analysis.
4 DATA ANALYSIS
The collected data were processed, rated by two
criteria and their estimates were compared.
4.1 Data Processing
The collected data was processed using two
statistically methods: multidimensional scaling and
hierarchical cluster analysis. The results of sorting by
each participant are represented by a correlation
matrix called a similarity matrix, in which for each
two from 85 sentences is marked 1 – if they are sorted
in the same group and 0 - if are allocated in different
categories. This matrix is symmetric with respect to
the main diagonal. The matrices of all participants are
joined into a common similarity matrix, in which the
possible values are from 0 (no participant grouped the
two ideas into the same category) to 20 (all experts
placed the two sentences in the same category)
Using the multidimensional scaling method, this
matrix is visualized as a point map in which each idea
is represented as a point in a plane. The more similar
are two sentences, i.e. they have a higher score in the
similarity matrix, the closer to each other they are
presented on the map. For this conversion, a stress
index is calculated, showing the relationship between
the similarities of the ideas and the calculated
distance between points on the map. This index varies
in the range [0-1], and the smaller is the value, the
better is the correlation. The final stress index of this
study is 0.2601. This value is not just “acceptable” but
one of the relatively lowest according to a meta-
analytic study of GCM (Rosas & Kane, 2012).
During the next phase of data analysis ideas had
to be grouped into categories (clusters) by the
hierarchical cluster analysis method. Initially, each
idea was divided into a separate category. At each
next step, the minimum distance between two clusters
was calculated and their merge was suggested. Rosas
and Kane (Rosas & Kane, 2012) recommend the final
number of clusters to be in the range 16-5. The
integrated Cluster Relay Map was used in interactive
step-by-step clusters merging process.
To assist in selection of the final number of
clusters a spreadsheet was also created with detailed
description and highlighted changes at each step from
16 to 5. Thus, the review and evaluation of data led to
conclusion that the best number of categories with
reports for this research is eight. The further step of
merging would have joined reports about course
feedback and LMS usage. The first one involved
evaluation of teaching methods and course content
whereas the second one takes into account the activity
of all students in LMS.
The clusters’ names at each steps varied,
following the titles experts gave during the creation.
In final version, these names ware modified manually
in order to clearly describe the reports they group.
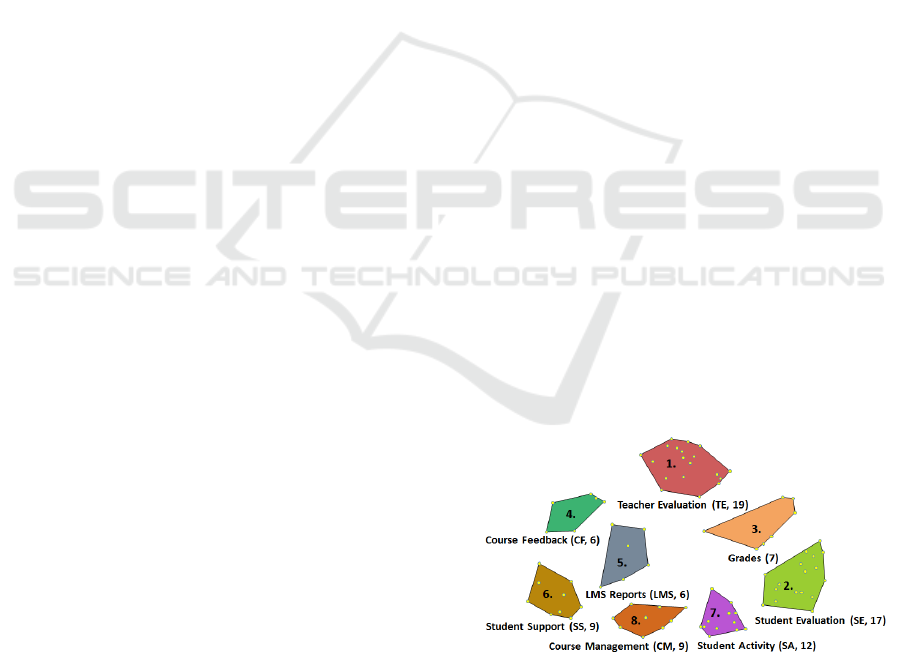
Figure 1 shows the final list of clusters with their
names, abbreviations and number of sentences in
each one.
Figure 1: Final clusters distribution.
An indicator of how typical each idea is for the
cluster it belongs is a parameter bridging value. It
varies in interval [0, 1], with lower values indicating
that the idea is typical for the cluster, while higher
values indicate that the location of the idea is at the
Design of Learning Analytics Tool: The Experts’ Eyes View
309
“boundary” of the cluster, i.e. if the number of the
final groups was larger, it would most likely be part
of another group.
Among the experts’ ideas there was a suggested
report with bridging value = 0 (To visualize a
summary report of teacher’s feedbacks for different
years; category Teacher evaluation) as well as a
report with bridging value = 1 (In case of overdue
activities by a teacher, the system to send a
notification, category Student support). In view of the
recommendation if a sentence is not associated with
any other, to put it into a separate group, such idea is
expected to have a higher bridging value.
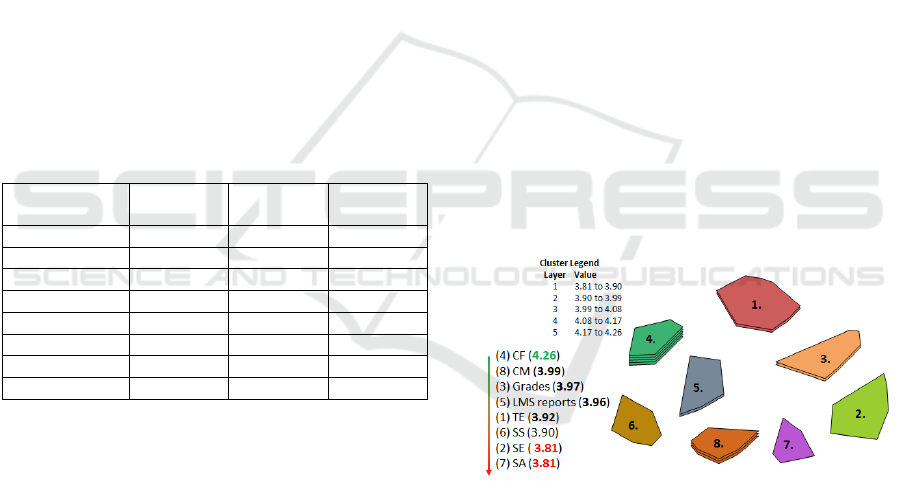
An average bridging value can also be calculated
for each of the 8 categories with reports. The smaller
the value, the more unanimously experts consider
ideas in the cluster should be grouped together.
Conversely, the higher the bridging value of a cluster,
the more general it is with respect to its reports. Table
1 shows the average values of the categories, sorted
in ascending order. It could be seen that values range
from 0.21 to 0.67, with the lowest in the Teacher
evaluation and Student activity categories and the
highest in Course Feedback cluster.
Table 1: Clusters descriptive statistics.
Category
abbreviation
Standard
Deviation
Median Average
TE 0.05 0.27 0.21
SE 0.05 0.27 0.26
Grades 0.05 0.44 0.43
CF 0.16 0.61 0.67
LMS reports 0.05 0.53 0.51
SS 0.10 0.47 0.50
SA 0.05 0.21 0.21
CM 0.06 0.38 0.37
In addition to sorting, experts rated all the
proposed reports on two criteria:
usefulness/relevance and applicability/feasibility on a
scale of 1 (relatively useless/extremely difficult to
apply) to 5 (extremely useful/easily applicable).
4.2 Rating Ideas by Usefulness
The range of average scores by criterion
usefulness/significance is from 3.10 to 4.60. Two
suggestions received the lowest rating: (1) During a
course to be visualized in percentage what part has
already passed and what part remains (M=3.10;
SD=1.3) and (2) To be visualized statistics on
teacher’s activity in forums (M=3.10; SD=0.8). As
the most useful is esteemed one suggestion: In
teacher’ view to have a graphical representation of
schedule conflict (for tests, home works, and exams)
between current course and the other courses for the
same students (M=4.6; SD=0.7).
Further data analysis by category revealed both a
difference in the ranges of assessments and an
opinion on the corresponding ideas. For example,
managers set min score of 2.5 on 4 suggestions and
max of 5.00 on 10 ideas; teachers assessed 1 idea with
min rate of 2.86 and one with max of 4.75; and
students respectively one proposal with min of 2.50
and one of max 4.75. Moreover, there is no cross-
section of either the minimum or maximum average
rating of an idea for report by the three expert groups.
Another interesting dependency can be seen in
usefulness rating according to the experience of the
experts in using different LMS. The higher the
proficiency of the evaluators, the wider the range they
put in grades, and the greater the number of ideas
evaluated as being the most useful. Most experienced
experts (know 5 different LMS) have given estimates
in the range [2.00-5.00], and the experts working with
single LMS [3.00-4.89].
From estimates of the individual ideas, an average
score for each category of usefulness/significance can
be calculated. Figure 2 shows that as the most useful
is evaluated the category Course feedback with score
4.26 out of 5.00 and as the least useful - the categories
Student evaluation and Student activity with score
3.81 out of 5.00.
Figure 2: Clusters rating by usefulness.
The results of these evaluations will be used to
select and prioritize the reports that the planned LA
tool should offer.
4.3 Rating Ideas by Applicability
The average score of ideas given by experts on the
second criterion applicability/feasibility vary in the
range [2.95-4.45]. As the most difficult to perform is
marked: To visualize an estimated time for publishing
results of a test/homework/exam (M=2.95; SD=1.23)
and as the easiest to implement is ticked: For each
CSEDU 2020 - 12th International Conference on Computer Supported Education
310
assignment/activity to be visualized a list of all
students already submitted it (M=4.45; SD=1.05).
Further analysis shows that managers have given
a max score of 27 ideas, while the other two roles are
unanimous for the best applicability of one and the
same suggestion: For each assignment/activity to be
visualized a list of all students already submitted it.
Managers and students find it difficult to implement
the report mentioned above as the lowest applicable,
while teachers are sceptical about the idea:
Generating recommendation for grouping students
together for teamwork on a common task with a
common assessment.
Data analysis from position of experience with
more different LMS shows that the experts with more
experience assessed more critically. They put a lower
min score than other participants and evaluated the
feasibility of the suggested reports in a wider range.
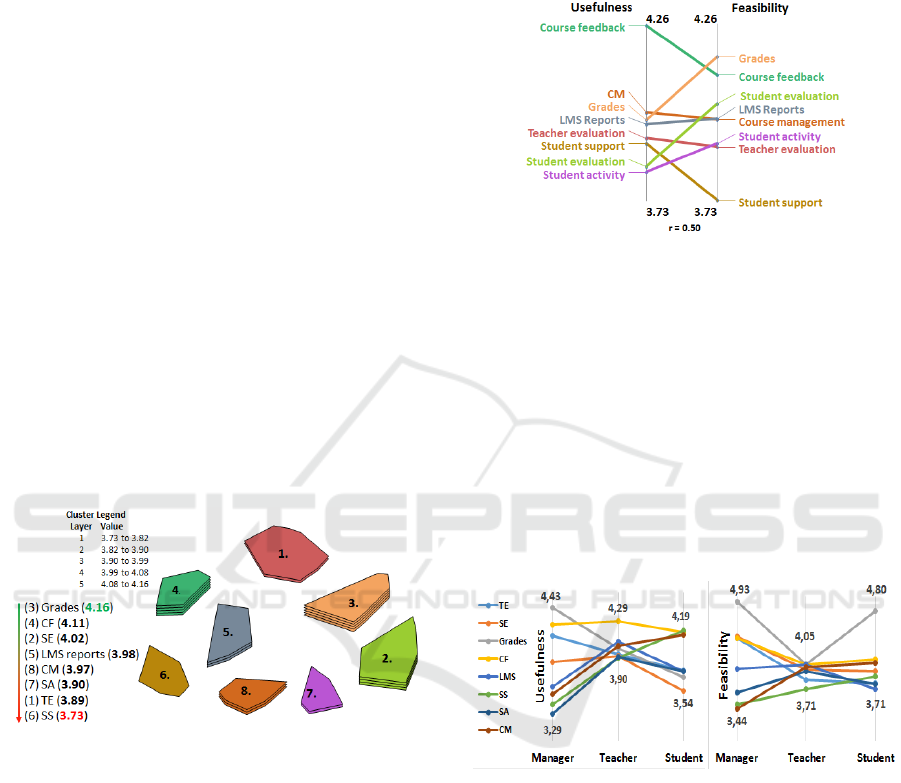
From estimates of the individual ideas, the
average rating could also be calculated for each
category. Figure 3 shows that the most feasible are
reports in the category Grades with score 4.16 out of
5.00 and the most difficult to implement – in the
category Student support with score 3.73 out of 5.00.
Concerning groups, the difference between the min
and max average scores is not very high.
Figure 3: Categories rating by feasibility criterion.
The results of these evaluations will also be used
for selection and prioritization of the reports that the
system under development should offer.
4.4 Comparison of Scores on Both
Criteria
The comparison of average scores on both criteria for
the 8 categories is also interesting. Some of clusters
received almost the same rating, for example LMS
reports (usefulness: 3.96, feasibility: 3.98) and
Course management (usefulness: 3.99, feasibility:
3.97). Others are rated as much more easily to apply
then useful, such as Grades (usefulness: 3.97,
feasibility: 4.16) or Student evaluation (usefulness:
3.83, feasibility: 4.02), or more useful then
applicable, such as Student support (usefulness: 3.90,
feasibility: 3.73). Overall, the usefulness is evaluated
higher than the feasibility (Figure 4).
Figure 4: Categories rating comparison.
Further data analysis reveals differences and
trends in rating of categories by different groups of
experts. For example, we can compare estimates
given by participants according to their LMS’ role.
By both criteria, managers' ratings vary over a wider
range (3.29-4.43; 3.44-4.93) than teacher’ (3.90-4.29;
3.71- 4.05) and students’ ratings (3.54-4.19; 3.71-
4.80) (Figure 5). For managers, the most useful
reports concern the results and students’ success;
teachers consider the most important feedback that
trainees give to their course and students place first
supporting learners.
Figure 5: Category usefulness by experts’ role.
On the feasibility criterion all experts put first
learning outcomes, and the most difficult to
implement is Course management according to
managers (3.44), Student support according to
teachers (3.71), and Teacher evaluation according to
students (3.71) (Figure 8).
Rating based on experts’ experience with different
number of LMS indicates that knowing more systems
allows grading of the usefulness and feasibility in a
wider range, while experience with a single system
limits estimates in a narrow range. From the estimates
of experts, experienced less LMS another interesting
dependency can be seen: the more useful they find a
report, the less applicable it is (Figure 6 and Figure 7)
Design of Learning Analytics Tool: The Experts’ Eyes View
311
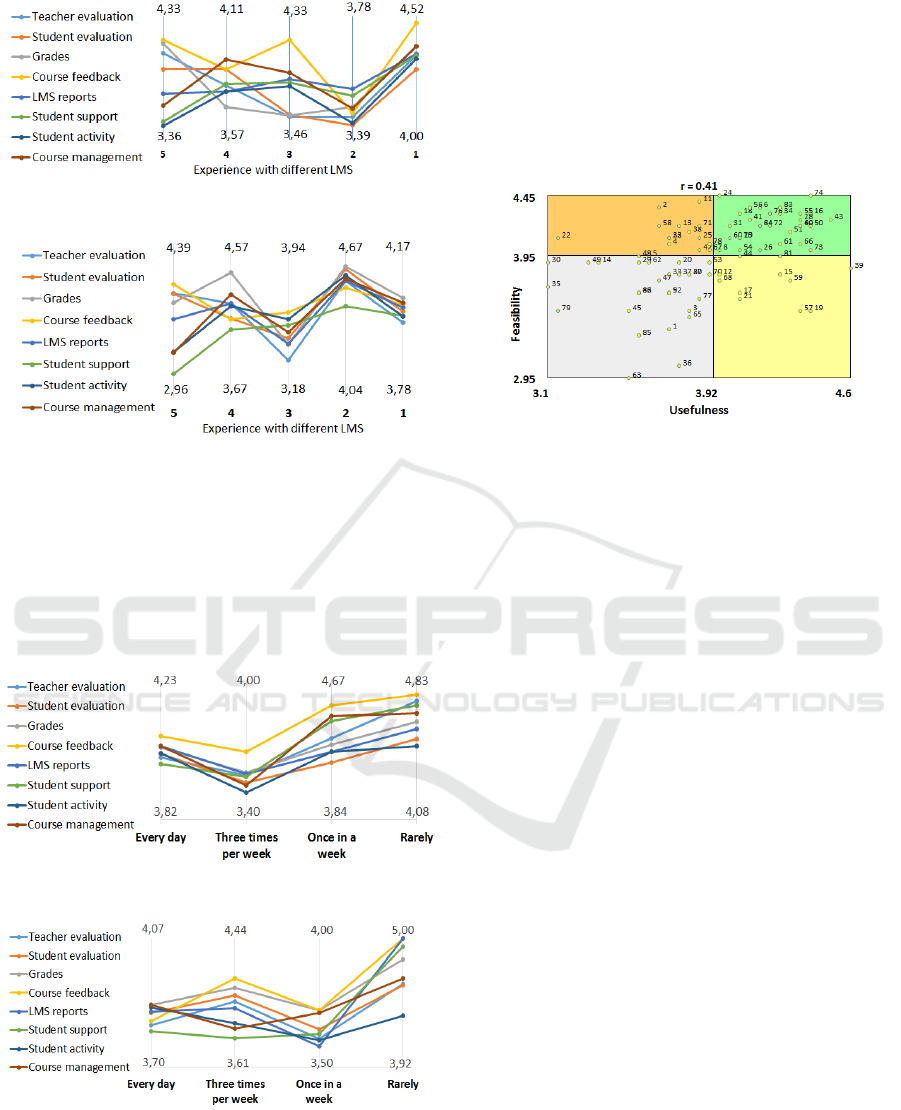
Figure 6: Clusters usefulness by experts’ experience.
Figure 7: Clusters feasibility by experts’ experience.
The rating by frequency of using LMS by
participants indicates that experts who use such
systems every day have estimated the categories in a
narrower range, with closer values, while the experts
who use LMS less frequently in their work have put
grades more widely, reaching the maximum of 5.00
(Figure 8 and Figure 9).
Figure 8: Clusters usefulness by experts’ LMS usage.
Figure 9: Clusters feasibility by experts’ LMS usage.
Data analysis is summarized in the next section
detailing the list of reports that experts defined and
ordered to be presented in each LA category of LMS
for each system user’s role.
5 RESULTS
The results from data analysis can be summarized in
scatter-plot “go-zone” diagrams dividing the area into
four zones according to the average values calculated
by the ratings on both criteria: usefulness/significance
and applicability/feasibility (Figure 10).
Figure 10: Go-zone diagram of ratings in all categories.
In the upper-right “green” zone, or the area of
quadrant I in the plane, are visualized ideas that got
scores above the average on both criteria; in the area
of quadrant III, or the “grey” zone, are placed the
suggestions evaluated below the average on both
criteria; and in the quadrants II and IV are allocated
reports estimated above the average by one criterion
and below the average by the other one.
The following relationships were searched for in
each category:
How many and which reports experts from
each role are put into the green zone;
How many and which are the unique reports
placed in the green zone as very important by
experts in any LMS role;
How many and which are the unique reports
that participants by each LMS role
unanimously appreciated above the average on
both criteria;
Are there reports put in the grey area by experts
in all LMS roles at the same time;
Are there reports rated by experts in one role as
very important but below the average on both
criterion by experts in another role;
Are there reports evaluated by all experts above
the average on one criterion but below the
average on the other criterion.
In the first version of the tool all proposals, which
experts rated above the average will be implemented.
The reports assessed above the average on one
criterion only will be revised and implemented in next
iteration. The grey zone ideas will be further revised.
Table 2 shows the distribution of reports in the
category Teacher evaluation. As the most useful and
CSEDU 2020 - 12th International Conference on Computer Supported Education
312
applicable, the experts in the role of managers
evaluated 9 reports, the experts in the role of teachers
– 10, and the experts in the role of student – 6.
Table 2: Number of suggestions in Teacher evaluation.
Manager Teacher Student
I II III IV I II III IV I II III IV
9 2 7 1 11 3 5 1 6 3 5 5
Totally 11 unique ideas, 5 of which are estimated
as the most useful by all experts will be implemented.
In Student evaluation category (Table 3), there are
9 suggestions in the green zone for managers, 4 - for
teachers, and 5 - for students. Totally 12 unique
reports without crossing the most important and the
least important according to the three roles of experts.
4 reports from the managers’ view and 2 from the
teachers’ one will not be displayed in LA section for
students. The same time one of the student’s report
will not be displayed for managers.
Table 3: Number of suggestions in Student evaluation.
Manager Teacher Student
I II III IV I II III IV I II III IV
9 4 2 2 4 5 3 5 5 5 6 1
In this category 12 reports will be implemented.
In Grades category (Table 4), there are 4 highly
important suggestions according to managers, 3 for
teachers, and 3 for students.
Table 4: Number of suggestions in Grades.
Manager Teacher Student
I II III IV I II III IV I II III IV
4 2
0
1 3
0
4 0 3 1 2 1
Totally 6 unique reports, with no sections between
the most and the less important according to experts
of all roles will be implemented. One of the
manager’s report will not be displayed for teachers
and students because they put it into the grey zone.
The Course feedback category consists of 3
suggestions in the green zone for the managers, 3 - for
the teachers, and one - for the students (Table 5)
Table 5: Number of suggestions in Course feedback.
Manager Teacher Student
I II III IV I II III IV I II III IV
3 1 2 0 3 2 1 0 1 2 1 2
In total 5 unique reports will be developed and
visualized in LA section for this category, one of
them will not be offered in current form to managers.
One suggestion is marked as least important from all
roles of experts.
In LMS reports category (Table 6), there are 2
highly important suggestions according to managers,
1 for teachers, and 1 for students, or 3 unique
suggestions without any sections between different
role’s votes will be implemented.
Table 6: Number of suggestions in LMS reports.
Manager Teacher Student
I II III IV I II III IV I II III IV
2 1 3 0 1 2 0 3 1 2 1 2
The Student support category includes 3
suggestions in the green zone for the managers, 2 - for
the teachers, and 4 - for the students (Table 7). Totally
6 unique reports will be implemented, one of which
will not be displayed in manager’s view.
Table 7: Number of suggestions in Student support.
Manager Teacher Student
I II III IV I II III IV I II III IV
3 1 3 2 2 3 3 1 4 2 1 2
In Student activity category (Table 8), there are 4
highly important ideas according to managers, 5 for
teachers, and 5 for students. Totally 9 unique reports
will be implemented, 2 of which not be included in
manager’s view, 2 – in teacher’s, 2 – in student’s. One
proposal is evaluated as more useful than applicable
Table 8: Number of suggestions in Student activity.
Manager Teacher Student
I II III IV I II III IV I II III IV
4 2 3 3 5 1 4 2 5 1 4 2
The last category Course management includes 3
suggestions in the green zone for the managers, 4 - for
the teachers, and 4 - for the students (Table 9).
Table 9: Number of ideas in Course management.
Manager Teacher Student
I II III IV I II III IV I II III IV
3 2 3 1 4 2 2 1 4 0 3 2
Totally 7 LA reports will be developed in this
section, one of which will not be displayed for
managers, one – for teachers, and 2 for students.
Totally 59 reports will be provided and visualized
in the LA part of LMS meeting the user requirements
of the three main system roles.
Design of Learning Analytics Tool: The Experts’ Eyes View
313

6 CONCLUSIONS
The presented study summarizes the most valuable,
according to the education experts (including
students), LA features expected to be available in the
LMS, based on collected big amount of data and
artificial intelligence. Results show that the experts in
the most popular LMS systems and their LA features
have higher demands and expectations. Even for the
reports that are available in these systems, experts
suggest variants and details for missing cases. In
addition to formulating the most LA services of a
modern LMS, the result list was further subjected to
design thinking activity. By critical evaluation and
filtering common existing reports, brand new needs
and requirements were extracted.
Before implementation of the LA tool to be done,
one more study is plan, investigating what types of
visualization of reports experts (three already defined
roles) would like to be available as LA means in
LMS. Data visualization methods for these reports
will be proposed and experts will be asked for their
professional opinion on which visualizations carry
the most useful and practical information at a glance.
Both group of results – from the presented and from
next study will be used for implementation of LA
tools in LMS, supporting via data and ICT
effectiveness of all participants in education process.
ACKNOWLEDGEMENTS
The research in this paper is partially supported by
The National Science Program "Information and
Communication Technologies for Unified Digital
Market in Science, Education and Security" financed
by the Ministry of Education and Science, Bulgaria.
REFERENCES
Chauhan, J., & Goel, A. (2017). A feature-based analysis of
MOOC for learning analytics.
doi:10.1109/IC3.2017.8284331
Concept System Global MAX. (n.d.). Retrieved 12 20, 2019,
from https://conceptsystemsglobal.com
Dyckhoff, A., Zielke, D., Bültmann, M., Chatti, M., &
Schroeder, U. (2012). Design and Implementation of a
Learning Analytics Toolkit for Teachers. 15.
Ebner, M., Taraghi, B., Saranti, A., & Schön , S. (2015).
Seven features of smart learning analytics – lessons
learned from four years of research with learning
analytics. eLearning Papers(40), 51-55.
Eurostat. (2019, April). Early leavers from education and
training. Retrieved 12 21, 2019, from Eurostat
Statistics Explained: https://ec.europa.eu/eurostat/
statistics-explained/index.php/Early_leavers_from_
education_and_training
High School Dropout Rate. (2019, September 23).
Retrieved 12 2019, from EducationData.org:
https://educationdata.org/high-school-dropout-rate/
Kane, M., & Rosas, S. (2017). Conversations About Group
Concept Mapping: Applications, Examples, and
Enhancements 1st Edition (1 edition ed.). SAGE
Publications, Inc. ISBN-13: 978-1506329185
Kane, M., & Trochim, W. M. (2007). Concept mapping for
planing and evaluation. Sage Publications.
doi:https://dx.doi.org/10.4135/9781412983730
Kilińska, D., Kobbelgaard, F., & Ryberg, T. (2019).
Learning Analytics Features for Improving
Collaborative Writing Practices: Insights into the
Students’ Perspective. In T. Väljataga, & M. Laanpere
(Ed.), Digital Turn in Schools—Research, Policy,
Practice (pp. 69-81). Singapore: Springer Singapore.
doi:ISBN: 978-981-13-7361-9
Kirschner, P. A., & Stoyanov, S. (2018, September 26).
Educating Youth for Nonexistent/Not Yet Existing
Professions. Educational Policy (EPX).
doi:10.1177/0895904818802086
LAK. (2011). 1st International Conference on Learning
Analytics. Retrieved from 1st International Conference
on Learning Analytics and Knowledge:
https://tekri.athabascau.ca/analytics
Rosas, S. R., & Kane, M. (2012, May). Quality and rigor of
the concept mapping methodology: A pooled study
analysis. 35(2), 236-245.
doi:10.1016/j.evalprogplan.2011.10.003
Schumacher, C., & Ifenthaler, D. (2018). Features students
really expect from Learning Analytics. (P. Professor
Matthieu Guitton, Ed.) Computers in Human Behavior,
78, 397-407. doi:10.1016/j.chb.2017.06.030
Stefanova, E. (2013). An Open Virtual World for
Professional Development. Serdica Journal of
Computing, 7(1), 81-100. doi:ISSN: 1312-6555
Stoyanov, S., Boshuizen, H., Groene, O., van der Klink, M.,
Kicken, W., Drachsler, H., & Barach, P. (2012,
December 1). Mapping and assessing clinical handover
training interventions. BMJ Qual Saf, 21(Suppl 1), i50.
doi:10.1136/bmjqs-2012-001169
Stoyanov, S., Spoelstra, H., Bennett, D., Sweeney, C., Van
Huffel, S., Shorten, G., Burgoyne, L. (2014, June 1).
Use of a group concept mapping approach to define
learning outcomes for an interdisciplinary module in
medicine. Perspectives on Medical Education, 3(3),
245-253. doi:10.1007/s40037-013-0095-7
Viberg, O., Hatakka, M., Bälter, O., & Mavroudi, A. (2018,
July 24). The current landscape of learning analytics in
higher education. Computers in Human Behavior, 89,
98-110. doi:10.1016/j.chb.2018.07.027
CSEDU 2020 - 12th International Conference on Computer Supported Education
314
