
Design and Development of an Application for Predicting Bus Travel
Times using a Segmentation Approach
Ankhit Pandurangi, Clare Byrne, Candis Anderson, Enxi Cui and Gavin McArdle
School of Computer Science, University College Dublin, Belfield, Ireland
Keywords:
Travel Time Prediction, Bus Transport, Spatial Data, Machine Learning.
Abstract:
Public transportation applications today face a unique challenge: Providing easy-to-use and intuitive design,
while at the same time giving the end user the most updated and accurate information possible. Applications
often sacrifice one for the other, finding it hard to balance the two. Furthermore, accurately predicting travel
times for public transport is a non-trivial task. Taking factors such as traffic, weather, or delays into account
is a complex challenge. This paper describes a data driven analysis approach to resolve this problem by using
machine learning to estimate the travel time of buses and places the results in a user-friendly application. In
particular, this paper discusses a predictive model which estimates the travel time between pairs of bus stops.
The approach is validated using data from the bus network in Dublin, Ireland. While the evaluation of the
predictive models show that journey segment predictions are less accurate than the prediction of a bus route in
full, the segmented approach gives the user more flexibility in planning a journey.
1 INTRODUCTION
Due to its importance in trip and route planning, travel
time prediction has a long history and has been con-
sidered by several researchers in different domains
(Lin et al., 2005). There is no doubt regarding the
value of accurate prediction. While travel time pre-
diction is relevant to all transport modes, it is per-
haps road transport which receives the most atten-
tion. Studies have long shown that passengers are
demanding services which are informative and dy-
namic (Peek and van Hagen, 2002) and provide them
with the ability to factor waiting times and delays into
their trip planning (Kroes and Daly, 2018). From an
operators perspective, the ability to understand travel
times is important for scheduling and service pro-
vision (Gkiotsalitis and Cats, 2017). Despite much
activity in this area, many questions remain unan-
swered. This is due in part to the difficulties of in-
corporating the impact of external factors such as de-
mand, time of day, weather conditions or seasonal
patterns into prediction algorithms (Crist
´
obal et al.,
2019).
The aim of the work presented in this paper is
to provide an effective solution to the problem that
Dublin Bus, and other public transportation applica-
tions, face in relation to providing accurate estimates
of travel and arrival times for trip planning within an
easy to use application. Static journey predictions are
common. These provide a simple estimated travel
time for each route. This can be produced based on
a single average of all travel times. Such a time is
often unrealistic given the variables that impact travel
time such as demand, time of day, weather conditions
or seasonal patterns. In this paper we describe a new
algorithm for predicting travel times and integrate it
into an innovative mobile application. Predictions are
made by analysing historical weather and travel time
data with a Random Forest machine learning algo-
rithm based on estimating travel time between pairs
of adjacent bus stops. Random Forest Classification
is an ensemble method in which a collection of indi-
vidual decision trees are used to produce a classifi-
cation. The classification which is produced my the
majority of trees in the ensemble is the output classi-
fication (Breiman, 2001). The approach has shown to
outperform individual constituent models.
The remainder of this paper is organised as fol-
lows: Section 2 examines related work in the area of
machine learning for predicting travel time as well as
a review of bus trip planning applications. Section 3
presents our approach for estimating bus travel time
between stops and also briefly describes the interface
of the accompanying application. Section 4 presents
the results of evaluating the accuracy of the travel time
prediction. Finally Section 5 concludes the paper with
72
Pandurangi, A., Byrne, C., Anderson, C., Cui, E. and McArdle, G.
Design and Development of an Application for Predicting Bus Travel Times using a Segmentation Approach.
DOI: 10.5220/0009393800720080
In Proceedings of the 6th International Conference on Geographical Information Systems Theory, Applications and Management (GISTAM 2020), pages 72-80
ISBN: 978-989-758-425-1
Copyright
c
2020 by SCITEPRESS – Science and Technology Publications, Lda. All rights reserved

a discussion and the identification of some area for fu-
ture research.
2 RELATED WORK
Due to the importance of trip planning for both oper-
ators and end users there are many examples of trip
planning application across many domains including
commuting and tourism (Jariyasunant et al., 2011),
(Huang and Peng, 2002), (Brilhante et al., 2015). The
applications all have a user interface which allows the
location for origin and destination to be specified and
then provides a route recommendation using various
modes of transport considering different spatiotempo-
ral constraints. Some utilise real-time data (Liebig
et al., 2017) but the majority of applications use static
data and provide travel time estimate based on the best
or worst case. This section briefly examines applica-
tions available before discussing techniques for more
robust travel time prediction using machine learning.
2.1 Bus Applications
There are a plethora of bus and transport planning
applications available to support travellers and com-
muters. A review of other transport apps currently
available on mobile app stores was carried out. Most
allow users to plan routes, view timetables, locate bus
stops and find points of interest. In relation to jour-
ney time predictions, several apps integrated Google’s
journey prediction API, rather than building their own
model; examples include the Hit the Road, SDMTS &
NCTD, MuniMobile, CityMapper and OneBusAway
Seattle apps. It is unclear if any of the apps used any
more criteria in their predictions, other than the search
terms in the journey planner.
In the Irish context, the Dublin Bus App makes
extensive use of real-time information to estimate the
arrival time of a bus. The application also includes
journey planning, favourites, and fare calculating fea-
tures; but does not provide journey time predictions.
Instead, travel times are given by timetables which
give journey estimates for several sections of the jour-
ney (for example, the number 4 route is broken into
seven journey segments, with an estimate for each).
Static predictions like these do not reflect likely traffic
conditions for a given journey and are not very use-
ful to the user. Transport for Ireland (TFI) have de-
veloped a Real-time Journey Planner application for
Dublin. When queried for a particular destination, the
application returns a multi-modal journey plan with a
travel time prediction for each mode segment in the
journey. These estimates are dynamic, and predic-
tions take into account factors such as time of day.
It is not clear if weather-related factors are taken into
account. This is a stand-alone app for journey plan-
ning and does not have a diverse range of features in
comparison with other apps analysed such as ticket
top up options.
2.2 Estimating Bus Travel Time
Recently, advances in machine learning along with
the availability of new data sets have renewed interest
in data driven approaches for predicting travel time
in transport systems. Several machine learning ap-
proaches have been investigated for this problem in-
cluding Support Vector Machine (SVM) and Artificial
Neural Network (ANN) models (Chang et al., 2010).
However, both approaches can take a significant time
to train which may make them unsuitable for real-time
predictions(Lee et al., 2012). Mazloumi et al. (2011)
investigated these techniques for bus routes in Mel-
bourne, Australia and decided to prioritise ANN mod-
els due to their modelling flexibility, predictive abil-
ity and generalization potential. Ensemble methods
such as Random Forest models were also explored by
several researchers (Gal et al., 2017). These models
are generally faster to train and can be optimised rel-
atively easily, and thus have potential to scale (Gal
et al., 2017). Hybrid models also appear in the lit-
erature, but these models either showed mediocre re-
sults or had a significantly long processing time (Peng
et al., 2018),(Petersen et al., 2019). Linear Regres-
sion models were tested by Jeong and Rilett (2004)
and compared to Artificial Neural Network Models
and historical averages, with the result that they were
worse performing than both and therefore ruled out
of consideration. For the interested reader, Crist
´
obal
et al. (2019) provide an excellent review of these ap-
proaches applied to bus travel time prediction.
Within travel time prediction, there are different
approaches in terms of what time is to be predicted,
the whole route or segments. Within this context there
are also different approaches to defining segments of
routes for analysis. Celan (2017) examined the under-
lying traffic system to determine optimal segments.
This study compared a model “defined by bus stops
and crossings of the road network”, a model “defined
by bus stops”, “a data model which addresses the in-
dividual parts of the network in relation to the poten-
tial barriers that affect the travel speed of buses”, and
“a data model with fixed-length links of the bus net-
work”. Many of these models required a significant
amount of contextual information to define bus stop
segments which adds additional overhead to the work.
Gal et al. (2017) proposes a segmentation technique
Design and Development of an Application for Predicting Bus Travel Times using a Segmentation Approach
73
where a segment is defined by pairs of bus stops. His-
torical data are used with an approach based on queu-
ing theory to predict journey time. Segments are com-
bined to produce predictions for larger trips. The ap-
proach was tested with data with the bus network in
Dublin. These segmentation techniques and the need
to understand the network influenced our approach
which is described in the next section.
While ANN predicted accurate results when com-
pared to more classical approaches such as linear re-
gression, there is a trade off when compared to the
computation time. Models built using Random For-
est approaches are faster to train and can handle large
feature sets while still producing comparable results
(Gal et al., 2017). In Section 3 the development of
the model is described which uses segments based on
pairs of adjacent bus stops. The evaluation metrics
used in the literature include root-mean squared error,
mean absolute relative error and median absolute rel-
ative error. These measures will be also used to assess
the effectiveness of our approach.
3 APPROACH
While the Dublin Bus App is widely used across
Dublin and is most likely the most used application
for checking bus arrival times, it is not built with ac-
curate times in mind. The use of static timetables
rather than a predictive model means that a user could
be waiting at a bus stop for 10 minutes, while the
app claims that a bus is simply 1 minute away. Our
approach to the problem relies on an understanding
of how Dublin’s bus system is designed. Unlike a
city like London, where buses have multiple hubs and
routes that are centred around various points (for ex-
ample, Victoria Station, Euston Station, etc.), Dublin
relies on the majority of bus routes passing through
the city centre. In this sense, it is more of a “star”
design rather than a hub design. Of course, the city
centre is the area most likely to be congested which
adds to the uncertainty in travel time prediction. How-
ever, this also means that most buses will pass through
the same set of stations at some point, meaning that
rather than build a model that tries to specifically tar-
get bus routes, our approach is to build a model that
uses stop-pairs to predict journey time. For example,
bus routes 39a, 46, and 145 all pass through the same
set of stops for a significant portion of their respective
routes. Therefore, instead of developing three sepa-
rate models for predicting travel time, one model that
handles common element of their routes is proposed.
The predictive aspects of the approach are incorpo-
rated into a mobile web application which functions
for single bus or multi-connection routes, and jour-
neys that utilise the entire route or just a few stops of
a route. It is fully scalable and can handle the variety
of routes an average user might want to take.
3.1 System Description
The final product is a transportation app which brings
together a journey planner with prediction, real-time
bus information, the ability to log in and save favorite
routes, a game, and route list. The map contains fea-
tures such as a user finding their nearest stops, and
planning a route to a selected location. There are five
sections of the app - Home, Journey Planner, Routes,
Favourites, and More.
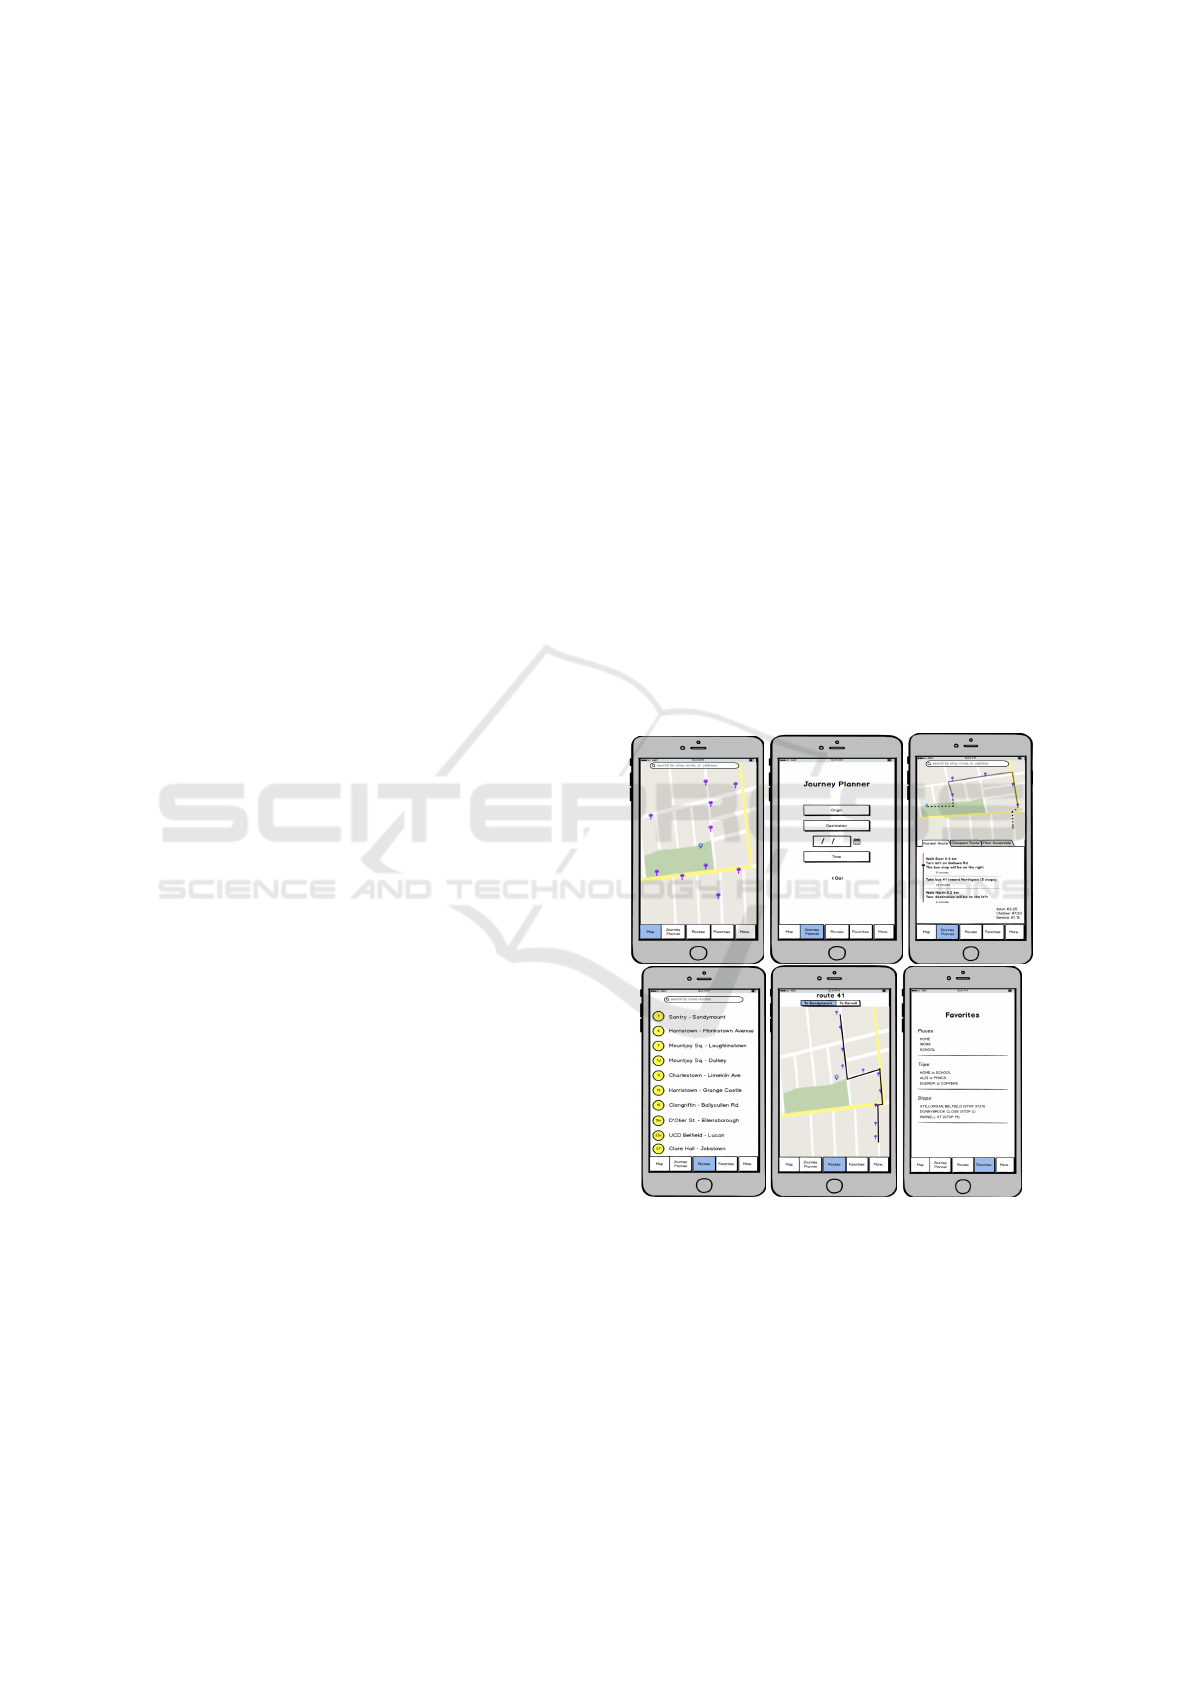
3.1.1 Wire Frame Design
During the early planning stages, wire frames (see
Figure 1) were created to show how the app would
like and to aid the design. The final product was quite
similar to these wire frames and is discussed in the
coming sections.
Figure 1: Original Wireframes.
3.1.2 Home Page
The home page, shown in Figure 2, is map-centric and
by default shows the user’s location and nearby stops.
3.1.3 Real-time Information
As shown in Figure 3, there are markers on the home
and journey planner pages which show where Dublin
GISTAM 2020 - 6th International Conference on Geographical Information Systems Theory, Applications and Management
74
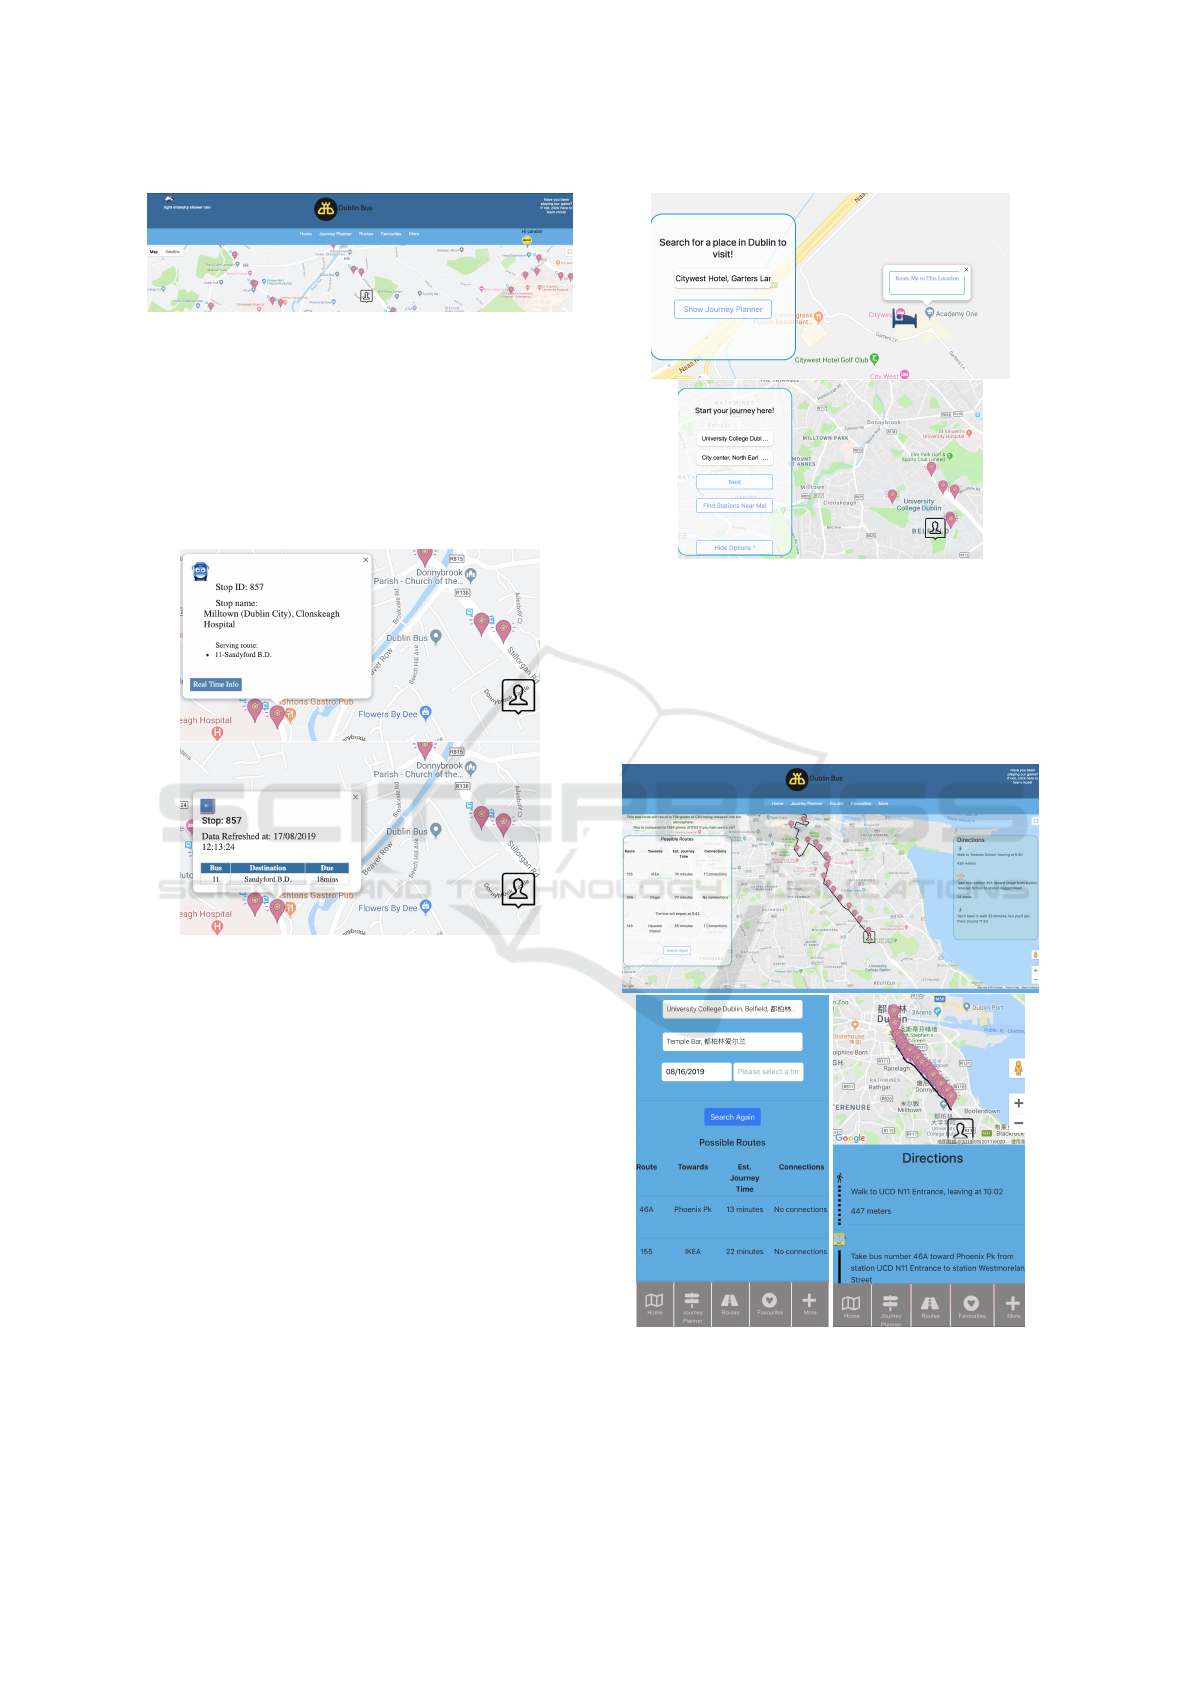
Figure 2: Home Page.
bus stops are located. When a user clicks one of the
markers, an information window displays the stop ID,
stop name and the routes which stop at that location.
There is a real-time button, which when pressed, de-
tails bus arrival times at that location - taken from the
Real Time Passenger Information (RTPI) API, sup-
plied by Dublin Bus.
Figure 3: Markers and Real-time Information.
3.1.4 Journey Planner and Search Pages
The journey planner is map-centric and allows for
search and planning of journeys. Once a user types
in an address or business of their choice and hits
“search”, pin(s) will appear on the map. These mark-
ers change based on the type of business for which
they search (restaurant, hotel, school, etc), as pre-
sented in Figure 4. Clicking that icon or marker and
then “route to here” presents the user with the pos-
sible bus routes to that place from the user’s current
location.
3.1.5 Planning a Journey
The “show journey planner” button allows the user to
input an origin and destination, along with a date and
time for travel. Once submitted, it displays different
possible routes - with the number of connections re-
quired – along with an estimated time for the journey
Figure 4: Search and Journey Planning.
(described in Section 3.2. When one of the routes is
clicked, the map then displays each stop on the jour-
ney along with detailed directions including any con-
nections and estimated walking time. This is demon-
strated in Figure 5 for both the desktop and mobile
versions.
Figure 5: Desktop and Mobile Journey Planner and Predic-
tion.
Design and Development of an Application for Predicting Bus Travel Times using a Segmentation Approach
75
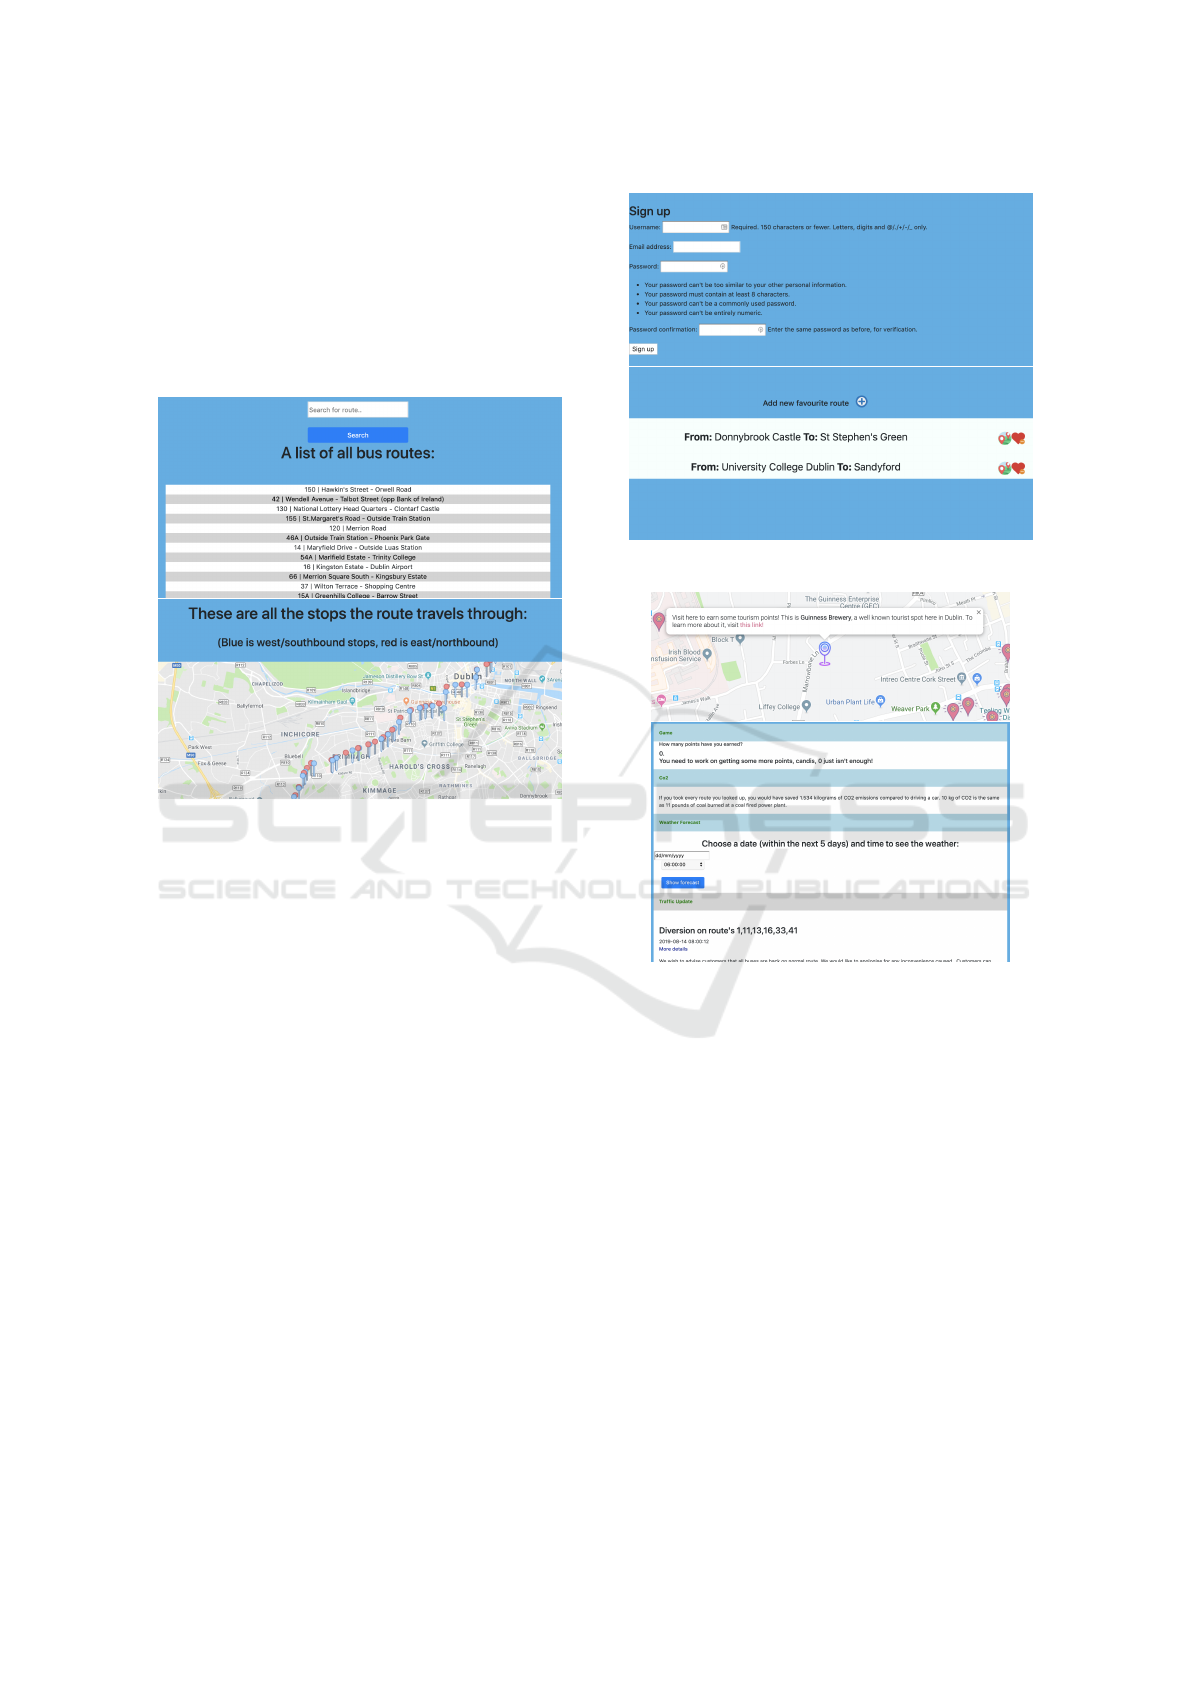
3.1.6 Routes
The app contains a page which lists all Dublin Bus
routes with numbers and destinations. For ease of
use, the user may search for their required route by
its number. Figure 6 demonstrates that when a user
clicks on a particular route, a map appears with all of
the route’s stops listed, in both directions.
Figure 6: Route Information.
3.1.7 Favourites
As seen in Figure 7, there is login functionality built
into the favourites page which allows the user to
access favourites (as well as the game) only when
logged in. The user is required to provide basic in-
formation - username, email, and password - to sign
up. On the favourites page, the user is able to cre-
ate and delete favourite journeys, as well as plan that
particular trip.
3.1.8 Additional Functionality
As part of its innovation, the application contains a
game (seen in Figure 8) in which twenty Dublin land-
marks are marked on a map. The user can click the
marker to learn more about the attraction - and if
the (logged-in) user visits the attraction they receive
points. These points are displayed on the more page,
along with cumulative calculations of CO
2
savings,
a weather forecast, and a news feed from the Dublin
Bus website.
Figure 7: Signing Up and Favourites.
Figure 8: Game Marker and More Page.
3.2 Data Management and Feature
Selection
Dublin Bus provided 12 months of historical infor-
mation on vehicles, individual trips, and GPS data
for each stop. Weather information was also gath-
ered from data.gov.ie, which was cross-referenced
with the historical bus data. The weather data con-
tained the weather conditions every hour for a mul-
titude of different categories. This included features
like the amount of rain (mm), the temperature, and
the wind-speed. These were the main three features
of the weather information that we felt would impact
the general population’s use of the public transport
system, and were used for our machine learning mod-
els. The bus data was more complicated. It was split
across two files, each containing a part of the data re-
lating to a specific trip made on a route, the duration
GISTAM 2020 - 6th International Conference on Geographical Information Systems Theory, Applications and Management
76
of the route, the planned departure and arrival times,
and the actual departure and arrival times. There were
also columns that contained ID’s for various trip parts,
stops, etc. The final dataset used in the machine learn-
ing contained 50 columns, a mix of data from the Na-
tion Transport Authority, weather data, and columns
created by the team to signify certain things, such as
whether the trip was during peak times, whether it was
heavy rain or light rain, etc.
As the data provided by Dublin Bus was large,
working with it was a particular challenge. The Pan-
das suite of data analysis tools
1
was used in conjunc-
tion with early filtering and sampling in order to man-
age the data. To clean the trip data, columns with un-
usable data were dropped, and null and contradictory
values were investigated and dropped. It was neces-
sary to drop rows that had been suppressed so that
they wouldn’t skew the data set. Many features for
the ‘Trips’ data were built and included day of week
(Monday-Sunday), if the day was a holiday, as well as
rush hour. For rush hour, the actual departures from
7:00-8:30am and 4:00-6:00pm were used because if
trips average between 30 minutes and 1 hour, all of
the “rush hour” trips would be included. Columns
were added for the journey duration as well as the
difference in duration between the actual and planned
journeys. To merge the ‘Trips’ data with the weather
data, it was crucial to create a feature to combine
the date with the actual time of arrival - so that the
hourly weather could be matched with the hour the
bus arrived. Dummy variables were created for the
rain measurements, including current and past rain.
These categories were then binned by type (ex: rain,
snow, shower, clouds, etc). Figure 9 shows the origi-
nal weather columns.
Figure 9: The Weather Columns in the Weather Dataset.
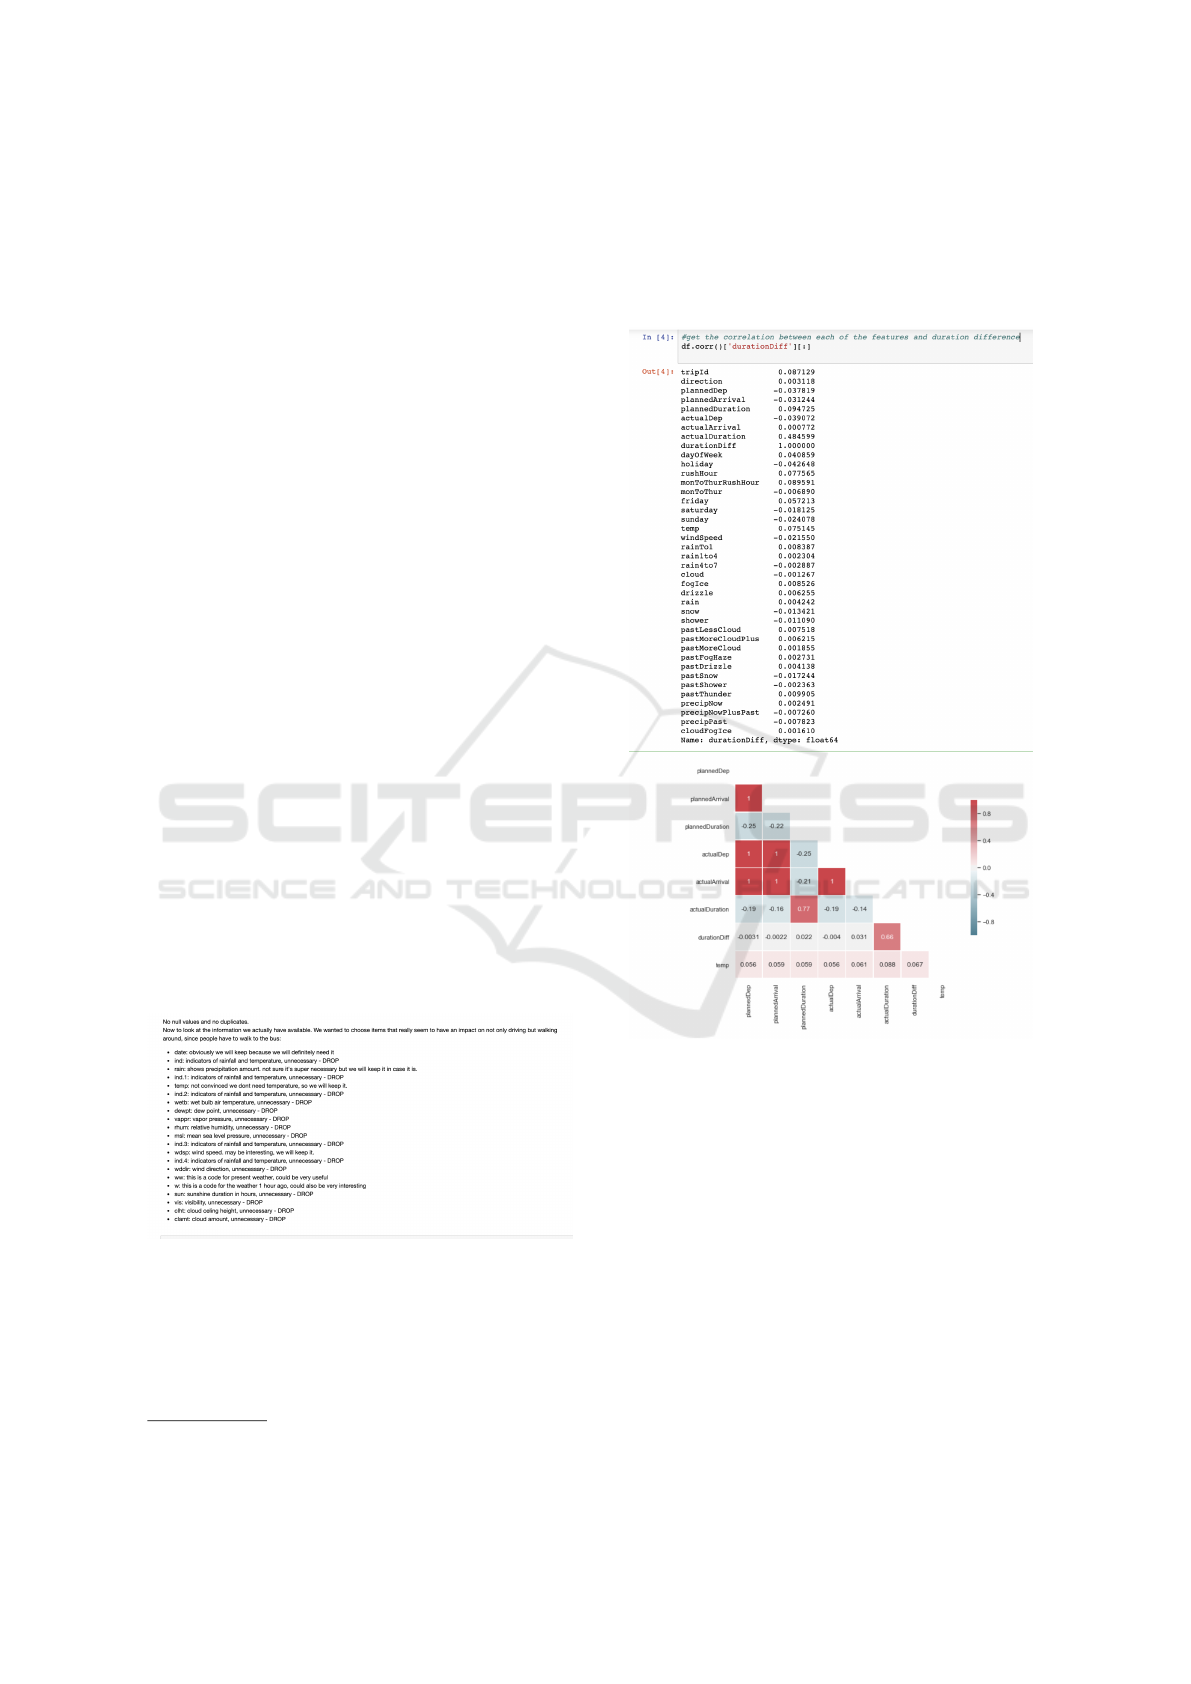
The analysis showed there was very little correlation
on any of the features when plotted against the ‘dura-
tion difference’, as you can see in Figure 10. In order
to improve this, additional features on the ‘Trips’ data
frame were created for weekday rush hour, Friday,
1
https://pandas.pydata.org/
Saturday, and Sunday. New weather features were
also created - precipitation now (combining together
rain, snow, drizzle, etc), precipitation in the past hour,
and a feature that combined precipitation now with
precipitation in the past hour.
Figure 10: Correlation with the ‘Duration Difference’.
Each of the features was plotted against the ‘dura-
tion difference’ value. No single feature was iden-
tified as a good predictor; but the plots showed that
while there are some outliers, there are not many,
which is useful information when cleaning the data.
As the correlation between features and the ‘duration
difference’ was so poor, pairs of features were ex-
amined as shown in Figure 11. Again, this did not
lead to a greater insight. Instead of using any of the
pairs for modeling, features with the highest correla-
tion were chosen - the final features used were ‘day-
OfWeek’(with 0-6 being Monday through Sunday),
‘friday’ (boolean), ‘rushHour’ (boolean), ‘temp’ (in
degrees C), ‘monToThurRushHour’ (boolean), ‘direc-
tion’ (either 1 or 2), and ‘windSpeed’.
Design and Development of an Application for Predicting Bus Travel Times using a Segmentation Approach
77
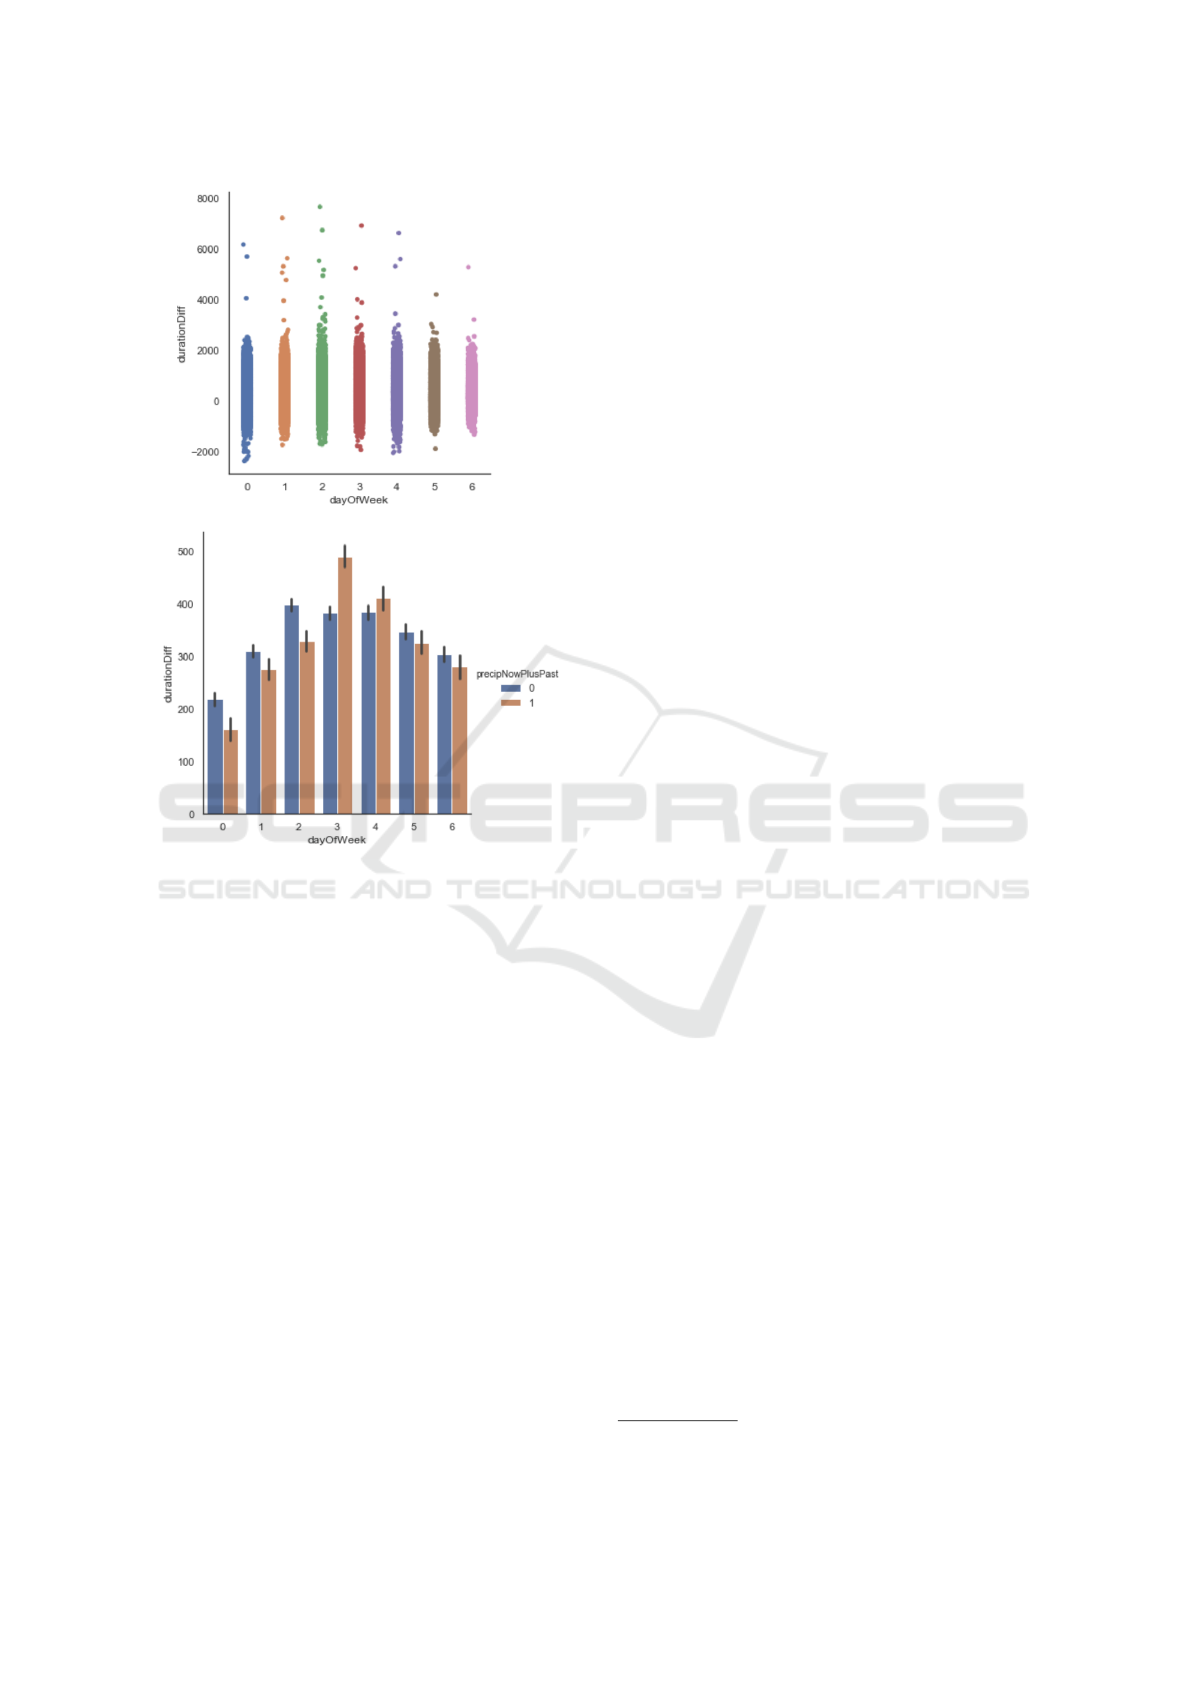
Figure 11: Plots Against ‘Duration Difference’.
3.3 Prediction Algorithm
Two approaches to predicting travel time were imple-
mented. An early approach taken was to predict the
travel time for a full route. Tests showed that using
a Random Forest classification with the features de-
scribed above to predict travel time produced a model
with a Root Mean Square Error (RMSE) of 600 sec-
onds, or 10 seconds per stop. This was not a satis-
factory outcome so a second approach was employed.
This strategy involved taking a percentage of that es-
timated time to present to the user for specified stop
segments, but accuracy was severely limited. The
next steps were to decrease the RMSE and Mean Ab-
solute Error, increase the R, and create models effi-
ciently.
A study by Jiang (2017) that worked with sim-
ilar historical bus data concluded that “whole route
travel time prediction using segments has better re-
sults than the route prediction model using solely bus
GPS data”. The potential increase in accuracy paired
with the ability to predict segments of trips led to the
use of a segmented approach in model creation. This
segmentation strategy allowed the data to be turned
into a ‘network’ of linked stops, rather than a list of
individual stops. This ‘network’ approach meant that
full route information for each bus line could be gen-
erated easily, including each stop id, its ‘progrnum-
ber’ in the route, and the latitude and longitude of
each stop. This information then formed the basis for
the app’s routes page.
In order to calculate journey segments, as well
as the full journey duration time, each journey was
divided into ‘stop pairs’. Each row would need to
record the time taken to travel from the first to the
second stop in the pair, for each stop pair in a specific
trip. The ‘progrnumber’ feature allowed the ability to
arrange stop pairs in the correct order of the trip. As
processing all of the leave times data (over 116 mil-
lion rows) would have taken several weeks to process,
a sample of 12,000 trip IDs was taken, divided evenly
across each direction. The goal was to create a new
collection of ‘stop pairs’ and their travel time dura-
tion, rather than the individual ‘stop’ information that
already existed. This enabled the app to return predic-
tions for a segment of a route by adding all stop pair
predictions between a specific start point and destina-
tion. It also increased the amount of data available,
as many stops exist on several routes, and this extra
data had the potential to increase the accuracy of the
models.
Several routes were not included in the sampling,
or had limited amounts of data, and required a more
hands-on approach. For roughly twenty routes, addi-
tional individual files were created. For a single route,
for one direction, the data set held between 3,000 -
7,000 rows of data; however, as previously stated,
some data sets were smaller. To increase the accu-
racy of the models, two different model types were
used - Random Forest and linear regression, both im-
plemented using the scikit-learn package
2
. Complex
model types are generally not suited to dealing with
such small amounts of data, thus the inclusion of a
linear regression model, as it is easy to apply and in-
terpret, would give a reasonable baseline accuracy if
the more complex Random Forest model did not give
suitable results.
Pickle files were created for each direction of each
route, containing a dictionary of all stop pairs and
their associated trained model. These were then in-
corporated into the journey planner feature, through
which user inputs could be processed and a prediction
delivered.
2
https://scikit-learn.org/stable/
GISTAM 2020 - 6th International Conference on Geographical Information Systems Theory, Applications and Management
78

4 EVALUATION
The focus of this section is on evaluating the perfor-
mance of the machine learning algorithm using the
selected features and segmentation approach. While
the application predicts travel times for over 100 bus
routes, the evaluation focuses on a subset of that num-
ber. Evaluation of the accompanying application’s
functionality and interface is left for future work.
4.1 Predictive Modelling for Accuracy
Multiple strategies were employed to improve the ma-
chine learning model to make it more accurate and
efficient. These included adding more data, remov-
ing outliers and handling missing values, examining
the correlation of features to select the most effec-
tive, tuning the algorithm by optimising the number
of decision trees, and engineering features to examine
their effect on the model. A cross validation approach
was adopted for evaluations. The sample of data we
had available was split into a test set and a training
set. The training set was used to build the classifier
and the test set was used to determine the accuracy
of these classification models. The models were pri-
marily evaluated using Mean Average Error (MAE)
and R
2
because they are robust and a simple metrics
to apply and interpret.
To evaluate the models, three sample route cate-
gories were chosen - ‘urban’ and ‘rural’ routes (based
on travel through a defined area in city centre), and
whether a route was ‘frequent’ (if there is a period of
a headway of fifteen minutes or less on weekdays).
Figure 12 shows the accuracy of the Random Forest
models for six routes. The ‘Whole Journey Predic-
tion’ column shows the metrics of an entire journey,
trained on ‘actualDuration’ from the ‘Trips’ data. The
‘Timetable Prediction’ contains the static estimated
duration of a whole journey on this route, taken from
Dublin Bus’s timetables. The ‘Segmented Journey’
adds the predictions of all stop pair segments’ dura-
tion for the journey.
Figure 12: Accuracy of Six Representative Random Forest
Models.
Figure 12 displays the MAE which shows that on
average, the difference between the predicted value
and the observed value. The figure also includes
RMSE, which is Root Mean Squared Error. It pro-
vides a similar metric to MAE, except instead of a
linear equation, it uses a quadratic formula to weight
large differences more, making it a particularly useful
metric when large errors are undesirable. The magni-
tude of the difference between the MAE and RMSE
give an indication of the variance in error.
4.1.1 Results and Critique of Predictive Model
Evaluation
The most accurate predictions were the full jour-
ney time predictions of the Random Forest models.
In comparison with the static timetabled results, the
‘whole journey’ predictions perform significantly bet-
ter across all routes. These models still perform well
even when there are few rows of data, as in the case
of route 31B. In contrast, the aggregated journey seg-
ments are often less accurate than the timetabled pre-
dictions. Although under-performing when compared
to the ‘whole journey’ predictions, the ‘segmented
journey’ predictions do produce better metrics when
they have access to more data, as in the case of the
routes 46A and the 4. However, it is important to note
that the ‘segmented journey’ predictions divide each
row into stop pairs, so models are based on far less
data than ‘whole journey’ models. It is clear from
the table that accuracy steadily declines as less data is
available, with the exception of route 31B.
Although the aggregated ‘segmented journey’ pre-
dictions were the least accurate, the approach offers
the most flexible planning and is likely to be more
accurate in planning a specific journey. The Dublin
Bus timetable does offer a breakdown of segments,
but these are not detailed (for example, the 46A route
has 61 stops, but breaks this into only 5 segments for
estimations). On a typical journey, most users will
not travel from the first stop of a bus line to its last.
In addition, the general data trend is that segmented
journey accuracy improves with a larger amount of
data.
5 CONCLUSION
While the predictive model that was implemented was
not as accurate as hoped, it provides insight on the
best approaches to a problem like this. With limited
access to hardware, it was not possible to utilize all
the data that was provided, instead having to sam-
ple from the dataset. The results of the valuation
Design and Development of an Application for Predicting Bus Travel Times using a Segmentation Approach
79

show that providing more data has the potential to
improve the results. Furthermore, while segmenting
the journey into stop-pairs seemed like the smartest
way to approach the problem, especially with the
bus system in Dublin, when data was sparse, it pro-
vided worse accuracy than the static timetable. In
cases where there is more data in the dataset, the seg-
mented journey model does perform better than the
static timetable; however, the whole journey model
always outperforms the static timetable. In cases with
less data, the whole journey model can be about 1000
seconds more accurate. With the right hardware and
the ability to analyse the entire dataset, the segmented
journey model may have returned better results. The
flexibility that the segmented model would provide
would be a good fit for a journey planning applica-
tion, and any opportunity to incorporate that into a
public transportation application would allow users to
receive better results when trying to estimate the jour-
ney time for their bus routes. The next steps of the
work are to increase the amount of data to train the
model for the segmentation approach. User testing of
the application will also be carried out the ascertain
the effectiveness of the interface and associated tools
described in Section 3.
ACKNOWLEDGEMENTS
The team would like to thank the National Transport
Authority in Ireland for providing the data used to
train and test the models in this research.
REFERENCES
Breiman, L. (2001). Random forests. Machine learning,
45(1):5–32.
Brilhante, I. R., Macedo, J. A., Nardini, F. M., Perego, R.,
and Renso, C. (2015). On planning sightseeing tours
with tripbuilder. Information Processing & Manage-
ment, 51(2):1–15.
Celan, M., . L. M. (2017). Bus arrival time prediction based
on network model. Procedia Computer Science, pages
138–145.
Chang, H., Park, D., Lee, S., Lee, H., and Baek, S. (2010).
Dynamic multi-interval bus travel time prediction us-
ing bus transit data. Transportmetrica, 6(1):19–38.
Crist
´
obal, T., Padr
´
on, G., Quesada-Arencibia, A., Alay
´
on,
F., de Blasio, G., and Garc
´
ıa, C. R. (2019). Bus travel
time prediction model based on profile similarity. Sen-
sors, 19(13):2869.
Gal, A., Mandelbaum, A., Schnitzler, F., Senderovich, A.,
and Weidlich, M. (2017). Traveling time prediction in
scheduled transportation with journey segments. In-
formation Systems, 64:266–280.
Gkiotsalitis, K. and Cats, O. (2017). Exact optimization
of bus frequency settings considering demand and trip
time variations. In 96th Transportation research board
annual meeting.
Huang, R. and Peng, Z.-R. (2002). Schedule-based path-
finding algorithms for transit trip-planning systems.
Transportation Research Record, 1783(1):142–148.
Jariyasunant, J., Work, D. B., Kerkez, B., Sengupta, R.,
Glaser, S., and Bayen, A. (2011). Mobile transit
trip planning with real-time data. Technical report,
UC Berkeley: University of California Transportation
Center.
Jeong, R. and Rilett, R. (2004). Bus arrival time prediction
using artificial neural network model. In Proceedings.
The 7th International IEEE Conference on Intelligent
Transportation Systems (IEEE Cat. No.04TH8749),
pages 988–993.
Jiang, F. (2017). Bus transit time prediction using gps data
with artificial neural networks. https://bit.ly/2wRujmI.
Kroes, E. and Daly, A. (2018). The economic value of
timetable changes. Transportation Research Proce-
dia, 31:3–17.
Lee, W.-C., Si, W., Chen, L.-J., and Chen, M. C. (2012). A
new framework for bus travel time prediction based on
historical trajectories. Proceedings of the 20th Inter-
national Conference on Advances in Geographic In-
formation Systems.
Liebig, T., Piatkowski, N., Bockermann, C., and Morik, K.
(2017). Dynamic route planning with real-time traffic
predictions. Information Systems, 64:258–265.
Lin, H.-E., Zito, R., Taylor, M., et al. (2005). A review
of travel-time prediction in transport and logistics. In
Proceedings of the Eastern Asia Society for trans-
portation studies, volume 5, pages 1433–1448.
Mazloumi, E., Rose, G., Currie, G., and Moridpour, S.
(2011). Prediction intervals to account for uncertain-
ties in neural network predictions: Methodology and
application in bus travel time prediction. Engineering
Applications of Artificial Intelligence, 24(3):534–542.
Peek, G.-J. and van Hagen, M. (2002). Creating synergy
in and around stations. TRB 81stannualmeeting CD-
ROM. Washington, DC.
Peng, Z., Jiang, Y., Yang, X., Zhao, Z., Zhang, L., and
Wang, Y. (2018). Bus arrival time prediction based on
pca-ga-svm. Neural Network World, 28(1):87–104.
Petersen, N. C., Rodrigues, F., and Pereira, F. C. (2019).
Multi-output bus travel time prediction with convolu-
tional lstm neural network. ArXiv, abs/, 1903:02791.
GISTAM 2020 - 6th International Conference on Geographical Information Systems Theory, Applications and Management
80
