
Video-based Machine Learning System for Commodity Classification
Pan He
∗
, Aotian Wu
∗
, Xiaohui Huang, Anand Rangarajan and Sanjay Ranka
Department of Computer and Information Science and Engineering, University of Florida, U.S.A
Keywords:
Truck and Trailer Classification, Deep Learning, Intelligent Transportation Systems.
Abstract:
The cost of video cameras is decreasing rapidly while their resolution is improving. This makes them useful
for a number of transportation applications. In this paper, we present an approach to commodity classification
from surveillance videos by utilizing text information of logos on trucks. A new real-world benchmark dataset
is collected and annotated accordingly that covers over 4,000 truck images. Our approach is evaluated on
video data collected in collaboration with the state transportation entity. Results on this dataset indicate that
our proposed approach achieved promising performance. This, along with prior work on trailer classification,
can be effectively used for automatically deriving the commodity classification for trucks moving on highways
using video collection and processing.
1 INTRODUCTION
Freight transport is considered as one of the most im-
portant variables in understanding economic and re-
gional development, and there has been an increas-
ing interest in collecting accurate data for this pur-
pose. On-road freight analysis can serve multiple
objectives: reducing freight transit times, improving
the reliability of freight movement, and reducing the
cost of freight transportation. Additional uses include
improving transportation efficiency and safety, con-
gestion mitigation, land use planning, and enhancing
economic competitiveness.
The most widely-used freight data collection
method is survey-based, which requires carriers, ship-
pers, and receivers to fill in questionnaires about the
commodity type, vehicle configuration, origin and
destination, etc. Survey-based methods severely suf-
fer from the problems of low response rate, lack of
geographic localization, unknown data reliability, and
high cost in time and money. It is not uncommon
for trucking companies to keep records of their de-
tailed truck activities and commodity information, yet
most of them are reluctant to make statistics pub-
licly available to others, considering potential com-
petitions. Because of the above limitations, the data
reliability, completeness, and timeliness are limited,
thereby limiting their applicability.
One of the most important applications for on-
road freight analysis is highway truck freight clas-
∗
denotes equal contributions
sification using computer vision techniques (Huang
et al., 2020). On one hand, vision-based methods pro-
vide intelligent sensing and processing technologies
for a wide variety of transportation applications and
services. On the other hand, providers of transporta-
tion infrastructure and services are expanding their re-
liance on computer vision to improve safety and effi-
ciency in transportation.
The cost-effectiveness and accuracy of video-
based sensing systems have made large strides over
the last decade. This has led to the increasing
use of computer vision-based video processing tech-
niques in the discipline of transportation, for improv-
ing both safety and efficiency. Current systems of us-
ing vision-based techniques for freight classification
are still in their infancy. There remain many chal-
lenges for vision-based methods, including data over-
load, the variety of environmental and illumination
conditions, and requirements of object recognition or
tracking at high speed. Vison-based highway truck
freight classification is still an unsolved problem that
has not been sufficiently studied.
Among various transportation modes, trucks carry
the largest proportion of commodities in the U.S. in
terms of both tonnage and value, accounting for 62.7
percent and 61.9 percent, respectively, according to
surveys conducted in 2016 (Bronzini et al., 2018).
In the latest edition of the American Trucking As-
sociations (ATA) freight forecast, freight transporta-
tion by trucks will continue growing over the next
decade. Most previous research work has focused
He, P., Wu, A., Huang, X., Rangarajan, A. and Ranka, S.
Video-based Machine Learning System for Commodity Classification.
DOI: 10.5220/0009393702290236
In Proceedings of the 6th International Conference on Vehicle Technology and Intelligent Transport Systems (VEHITS 2020), pages 229-236
ISBN: 978-989-758-419-0
Copyright
c
2020 by SCITEPRESS – Science and Technology Publications, Lda. All rights reserved
229

Figure 1: Typical relations between trailer types and commodity types. The trailer type is an important piece of information in
determining the type of commodity carried in trucks. Consequently, for detected trucks, only after a trailer is detected could
we continue the process of commodity identification. For many trailers, the corresponding commodities could be directly
determined by their types (He et al., 2019a). In case of enclosed trailers, we can further utilize the text information of the logo
data on the truck body to determine commodity type.
on developing truck and trailer classification models
that use various traffic sensor data such as inductive
loop detectors (ILD), weigh-in-motion (WIM), and
cameras (Hernandez et al., 2016; He et al., 2019a).
This extracted vehicle information can provide traf-
fic agencies with limited cues for understanding truck
classes, but only rarely revealing the carried cargo.
Detailed and real-time road-based freight data are
urgently required to challenge problems of the cur-
rent road transportation network, such as congestion,
bottlenecks, and resource wasting. We aim at ad-
dressing the lack of freight data analysis in dynamic,
real-world environments using novel video process-
ing approaches. In this paper, we propose a funda-
mentally different approach for freight analysis based
on other fine-grained visual information contained in
truck bodies such as logo data. Logos, also known
as trademarks, serve a key role in intelligent traffic-
control systems. Preliminary approaches for detect-
ing and recognizing vehicle logos (Psyllos et al.,
2010; Llorca et al., 2013) are shown to be effective
for a fixed set of logo classes, such as license plate
detection and determining the type of a car.
Commodity type can be directly inferred on some
trucks using their trailer types (e.g., enclosed, flatbed,
tank, and bobtail) (He et al., 2019a; He et al., 2019b).
Trailer type is an important piece of information in
determining the type of commodity in the trailer (Fig-
ure 1). Consequently, for detected trucks, only after a
trailer is also detected could we continue the process
of commodity recognition. For many trailers, the cor-
responding commodity could be directly determined
by their type. However, the majority of trucks have
enclosed trailers, and the only commodity informa-
tion we can obtain from camera sensors is potentially
from company logos on truck bodies. In case of en-
closed trailers, logo text detection, recognition, and
database lookup was the primary way of determining
commodity type.
We propose one freight analysis pipeline that is
summarized as follows: (i) truck detection from
video, (ii) trailer identification, (iii) potential logo
text detection, (iv) potential logo text recognition, and
(v) North American Industry Classification System
(NAICS) database lookup for commodity identifica-
tion. It is non-trivial to detect and recognize these
logos on the trucks, due to the presence of varying
challenging factors such as occlusions, uncontrolled
illumination, and background clutter. We have made
the following contributions:
• A novel end-to-end road video processing sys-
tem to provide real-time dynamic commodity in-
formation by deploying sensors and edge de-
vices in locations of interest. The system in-
tegrates both state-of-the-art trailer classification
approaches and text recognition solutions for
commodity classification.
• A logo classification method that matches de-
tected logos with a built company database with
high accuracy. It utilizes text information from
logo data, by leveraging state-of-the-art scene-text
solutions. The resulting model allows the traffic
agency to effectively extend to new logo classes
and companies of interests.
• We develop a new commodity classification
benchmark based on logo data. To our best knowl-
edge, it is the first dataset collected to evaluate
commodity classification based on logo data. It
can be useful in providing traffic engineers and re-
searchers a dataset to systematically evaluate their
developed commodity classification models.
Results obtained from our datasets show that our
scheme for commodity classification has reasonably
good recall and precision for detecting logos appear-
ing on trucks. By further utilizing the NAICS code,
we can search and infer the corresponding commod-
ity type, based on the name of the company obtained
from the logo classification model. A system is devel-
oped to illustrate the concept of our commodity clas-
sification.
VEHITS 2020 - 6th International Conference on Vehicle Technology and Intelligent Transport Systems
230

2 METHODOLOGY
In this section, we describe the computer vision and
machine learning approaches that were developed for
the problems at hand. We used an array of tech-
niques for obtaining a set of features that are suit-
able to truck trailer classification and commodity clas-
sification. Because the camera was positioned to
mainly obtain information from the side of the trucks
passing on the freeway (as opposed to information
from the rear), the process of identifying commodi-
ties was fundamentally restricted by the types of ven-
dor image, logo, or text information that could be
gleaned from the trucks themselves. As mentioned,
our freight analysis pipeline involves three key steps:
truck detection and classification, logo text detec-
tion and recognition, and commodity classification or
identification.
2.1 Truck Detection and Classification
The initial stage processes the raw videos so as
to determine the presence of truck objects within
images, by adopting the state-of-the-art detection
method (Redmon et al., 2016). It is followed by esti-
mating the bounding box of each truck object. Specif-
ically, transfer learning techniques are adopted to ac-
curately find candidate vehicle regions by estimating
the bounding box of each vehicle object. A 2-class
(truck vs. non-truck) deep learning classifier is devel-
oped to decide whether the vehicle candidate was a
truck or not, as we were interested in trucks.
Following (He et al., 2019a; He et al., 2019b), ge-
ometric features are extracted from the cropped truck
images, by incorporating expertise knowledge of traf-
fic engineering on determining truck or trailer types
(e.g., the number of wheels (a proxy for the number
of axles), number of trailers,size and aspect ratio, i.e.,
ratio of length to height from aside view). The deci-
sion tree classifier is trained on top of these geomet-
ric features to group trucks into several trailer types
such as tank, specialty, enclosed trailer, etc. As illus-
trated in Figure 1, the predicted trailer types can be
further linked to commodity types. This trailer model
serves as our initial strategy for commodity classifica-
tion. In case of enclosed trailers, we can further deter-
mine the commodity type (if available), as introduced
in the subsequent section.
2.2 Text-based Truck Logo Detection
and Recognition
A logo can be conceptualized of as a brand image
expression, comprising a (stylized) letter or text, a
graphical figure, or a combination (Feh
´
erv
´
ari and Ap-
palaraju, 2019). Many logo images vary significantly
in color and contain specialized, unknown fonts. It
is difficult to guarantee their context or placement be-
cause logos can be placed anywhere on the truck. Pre-
vious work on logo detection assumed that large train-
ing datasets for each logo class are available with fine-
grained bounding box annotations. Such assumptions
are often invalid in realistic scenarios where it is im-
practical to exhaustively label fine-grained training
data for every new class.
Pipeline. Following state-of-the-art scene-text solu-
tions EAST (Zhou et al., 2017) for text detection and
CRNN (Shi et al., 2016) for text recognition, we pro-
pose a processing pipeline for logo texts as shown in
Figure 2. It consists of the following steps:
1. Given an image frame from roadside videos, we
use a multichannel FCN (fully convolutional net-
work) model to obtain a text line/word score map
to filter our regions of interest.
2. A post-processing step followed to filter out over-
lapped detection results by applying the standard
NMS (non-maximum suppression) technique. Af-
ter this step, we obtained results of text line/word
locations represented by oriented bounding boxes.
3. Cropped images containing pure texts are pro-
cessed by the CRNN model to obtain recognition
results.
4. Word correction and string matching techniques
are applied to match the result to predefined logo
class list.
Network Learning. Similar to (Zhou et al., 2017),
we adopt the geometry shape called quadrangle
(QUAD) for representing text regions, where each
QUAD has 8 numbers that denote the coordinate shift
from four corner vertices of the quadrangle to the cur-
rent pixel location. Two branches are introduced af-
ter the feature extraction from the multichannel FCN
in step 1. The first branch is designed for predicting
the pixel-level text score map while the second branch
aims at estimating the geometry for each text region.
The loss is therefore formulated as:
L = L
s
+ λ
g
L
g
, (1)
where L
s
and L
g
represent the losses for the score map
and the geometry, respectively. The balanced cross-
entropy loss is adopted for computing L
s
. To learn
the geometry, a modified smoothed-L1 loss is adopted
where an extra normalization term is added. Denote
by an ordered set Q = {p
i
|i ∈ {1, 2, 3, 4}} the quad-
rangle, where p
i
= {x
i
, y
i
} are vertices on the quad-
rangle in clockwise order. Let
C
Q
= {x1, y1, x2, y2, x3, y3, x4, y4}, (2)
Video-based Machine Learning System for Commodity Classification
231

Figure 2: The detection and recognition pipeline of the text-based solution. It consists of: 1) Given an image frame from
roadside videos, we use a multichannel FCN (fully convolutional network) model to obtain a text line/word score map to filter
our regions of interest; 2) A post-processing step followed to filter out overlapped detection results by applying the standard
NMS (non-maximum suppression) technique. After this step, we obtained results of text line/word locations represented by
oriented bounding boxes; 3) Cropped images containing pure texts are processed by the CRNN model to obtain recognition
results; 4) Word correction and string matching techniques are applied to match the result to predefined logo class list.
then L
g
can be written as:
L
g
= L
QUAD
(
ˆ
Q, Q
∗
) (3)
= min
ˆ
Q∈P
Q
∗
∑
c
i
∈C
Q
,
ˆc
i
∈C
ˆ
Q
Smoothed
L1
(c
i
, ˆc
i
)
8 × N
Q
∗
, (4)
where
ˆ
Q and Q
∗
represent the predicted quadrangles
and the ground truth quadrangles, respectively. P
Q
∗
denotes all equivalent quadrangles of Q
∗
with differ-
ent vertices ordering. N
Q
∗
denotes the shorted edge
length of the quadrangle, given by
N
Q
∗
= min
4
i=1
D(p
i
, p
imod 4
+ 1) (5)
The final recognition stage follows the classic connec-
tionist temporal classification (CTC) that labels the
sequence data extracted from each text image region,
by utilizing the recurrent neural networks. We refer
to (Graves et al., 2006) for detailed information.
The implemented algorithms achieved a high re-
call with a competitive recognition accuracy, com-
pared to the original research work (Zhou et al., 2017;
Shi et al., 2016). Although in many cases, the recog-
nition results either missed or wrongly predicted a
small number of characters, this can be suitably cor-
rected by using many publicly available spelling cor-
rection methods.
Text-based logo detection and recognition demon-
strated a competitive accuracy on text logos. How-
ever, the pure text-based solution is not sufficient to
solve the commodity classification problem for the
following reason: some of the logos do not contain
text (or the text is complex with stylized fonts) and
have to be recognized as entire images. Deriving the
company names from such logos is a challenging ob-
ject recognition and classification problem. Even the
state-of-the-art scene-text solutions fail to detect and
recognize these types of logo data. We leave this part
for future studies.
2.3 Commodity Classification with
Logo Data
The North American Industry Classification System
is an industry classification system that groups estab-
lishments based on the similarity of their production
processes. It is a comprehensive system covering all
economic activities. Inspired by this, we developed
our commodity classification based on commodity
identification. It was based on results obtained from
our logo detection and recognition results. Once we
extracted the text and company name, we forwarded it
to our collected company list to search for the NAICS
code and commodity description as shown in Table 1.
This process naturally links the logo detection and
recognition to the commodity classification. To our
best knowledge, our proposed pipeline is the first at-
tempt in this direction.
3 EXPERIMENTS
We evaluated our developed approaches on collected
datasets, along with carefully conducted ablation
studies. In the end, we illustrate a system integrating
all the developed approaches. It takes the raw road-
side video as input and outputs truck attributes and
associated commodities automatically.
3.1 Dataset Collection and Processing
Benchmark Datasets. We evaluated our logo detec-
tion and recognition approaches on video frames cap-
tured by roadside cameras provided by the Florida
Department of Transportation (FDOT). From these
videos, we chose 26 frequently appearing logo classes
for our experiments. We collected a dataset, referred
VEHITS 2020 - 6th International Conference on Vehicle Technology and Intelligent Transport Systems
232
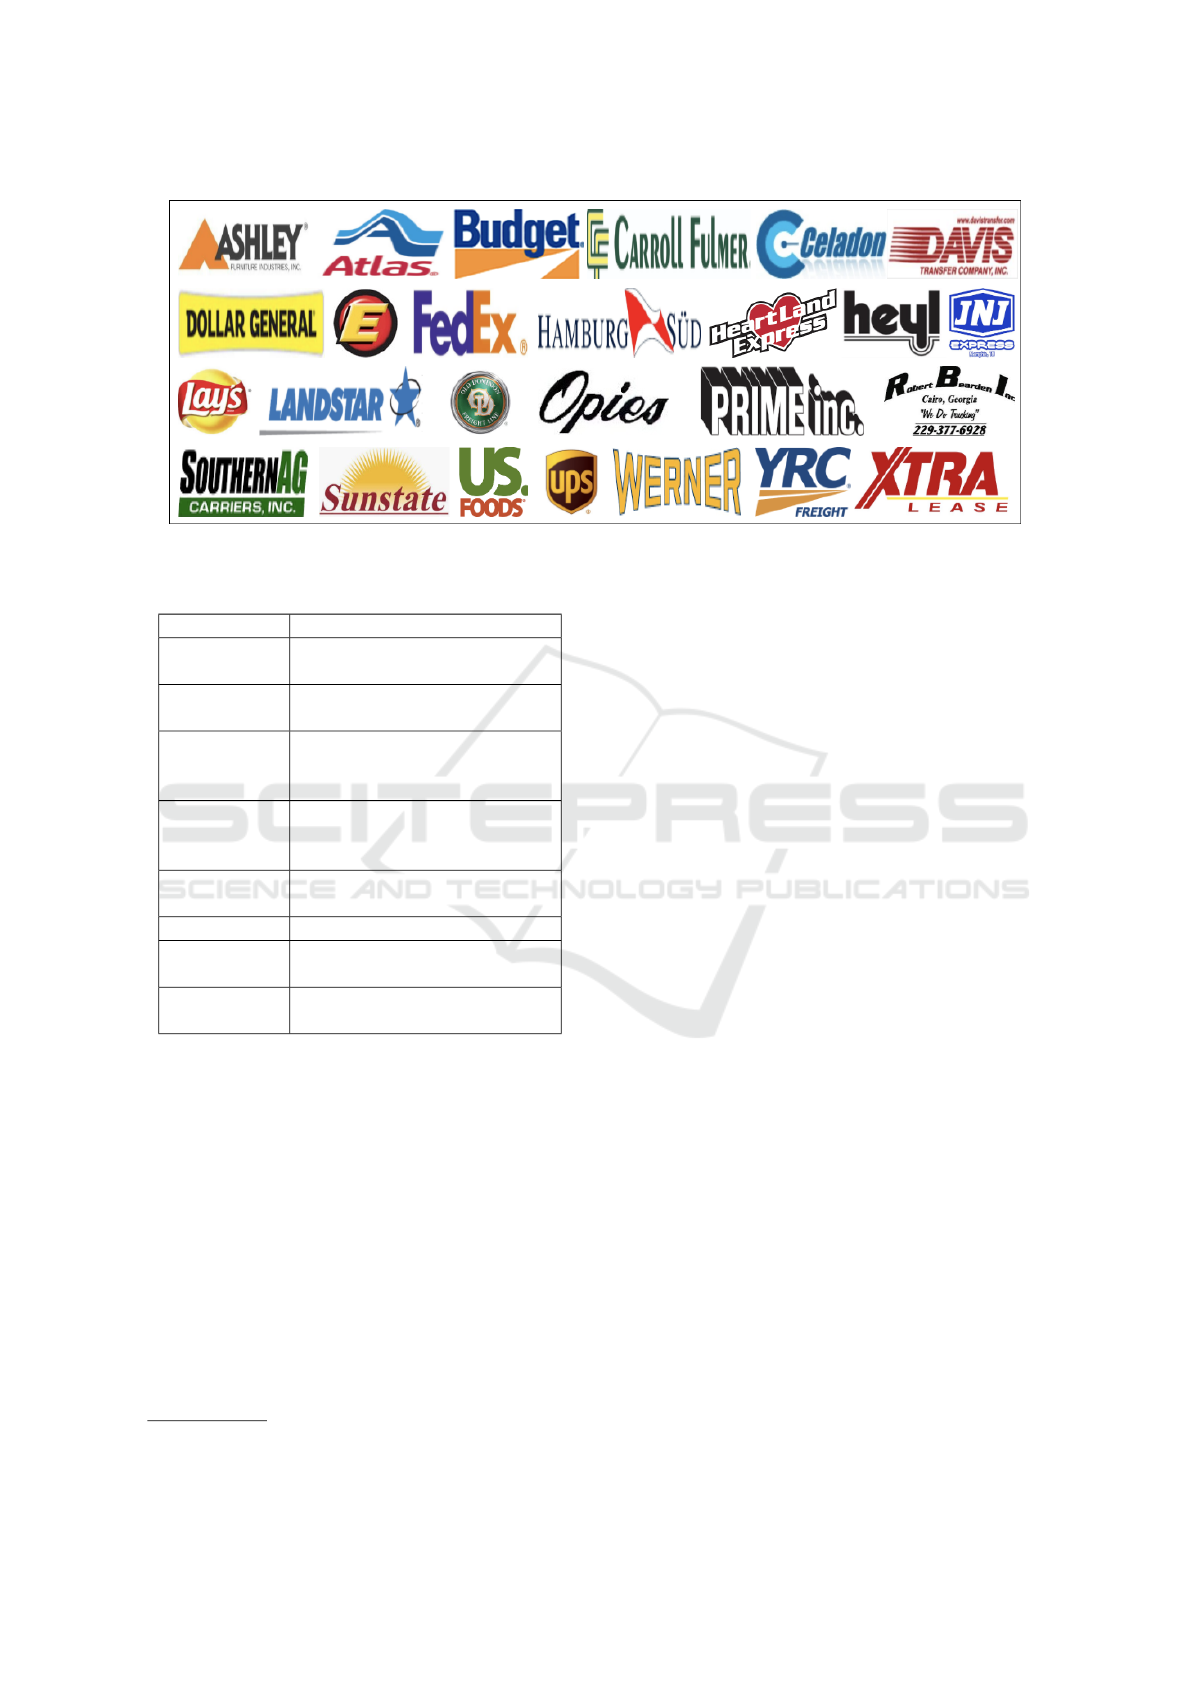
Figure 3: Illustration of logo classes.
Table 1: Samples of the NAICS code searching.
NAICS Code Description
311919 Other Snack Food Manufactur-
ing
337127 Institutional Furniture Manu-
facturing
424490 Other Grocery and Related
Products Merchant Whole-
salers
445110 Supermarkets and Other Gro-
cery (except Convenience)
Stores
484121 General Freight Trucking
Long-Distance Truckload
485119 Other Urban Transit Systems
532120 Truck Utility Trailer and RV
Rental and Leasing
551112 Offices of Other Holding Com-
panies
to as the Annotated Logo Dataset (ALD), for eval-
uating logo detection and classification. This ALD
dataset was carefully annotated with bounding boxes
attached to logo regions. In addition to the annota-
tions of logo locations, we labeled each logo accord-
ing to its corresponding trademark name.
The dataset consists of 4, 486 images and 5, 020
logos. Detailed distributions of logo classes are
shown in Table 2. These images were used for eval-
uating the end-to-end logo detection and recognition
and commodity classification.
The logo classes were chosen based on the fre-
quency of occurrence in our testing videos, which
contains several top carrier companies in the US
1
.
We diverse the classes by including styled text lo-
1
https://www.ttnews.com/top100/for-hire/2019
gos, shape-based logos, and logos shown on different
types of trailers. The chosen 26 classes are not full
coverage of all logo classes of interest but are illustra-
tive to evaluate our proposed approach.
Logo Grouping. To better describe the challenges of
logo recognition, we further divided all logo classes
into three individual groups (’easy’, ’medium’, and
’difficult’) based on the difficulties. The detailed divi-
sion can be found in Table 5, Table 6, and Table 7. For
’easy’ class, most of the logo images are high contrast
with relatively clean backgrounds, such as the ’Dollar
General’, where the background is a smooth single
color. The text (dark color) and background (yellow
color) are distinct from each other due to high con-
trast. In addition, the font of the logo texts is readable,
in contrast to fancy-style fonts that will be categorized
into the other two classes. These characteristics made
it easier for models to extract discriminative feature
and obtain good performance. For ’medium’ class,
we considered logos consisting of multiple text lines
such as ’Heartland Express’ and ’US Foods’. We also
include logos with figures underneath the text, such
as ’Heartland Express’, and logos with unusual font,
such as ’Heyl’. These characteristics require captur-
ing the overall logo structure with different colors,
textures, text arrangements and the ability to tolerant
misrecognized letters. For ’difficult’ class, we mainly
choose the ones with fewer characters in artistic fonts,
(i.e., ’OD’ and ’E’). Besides, the size of logos in this
class is usually much smaller than the others, which
makes the recognizer suffer from low resolution. The
’Opies’ serves as a special one since it usually showed
up on a silver surface which reflects sunlight so that
the only part of the logo is visible.
Evaluation Protocols. For evaluating the perfor-
mance of our developed approaches, we adopted
the standard evaluation protocol for object detection.
Video-based Machine Learning System for Commodity Classification
233
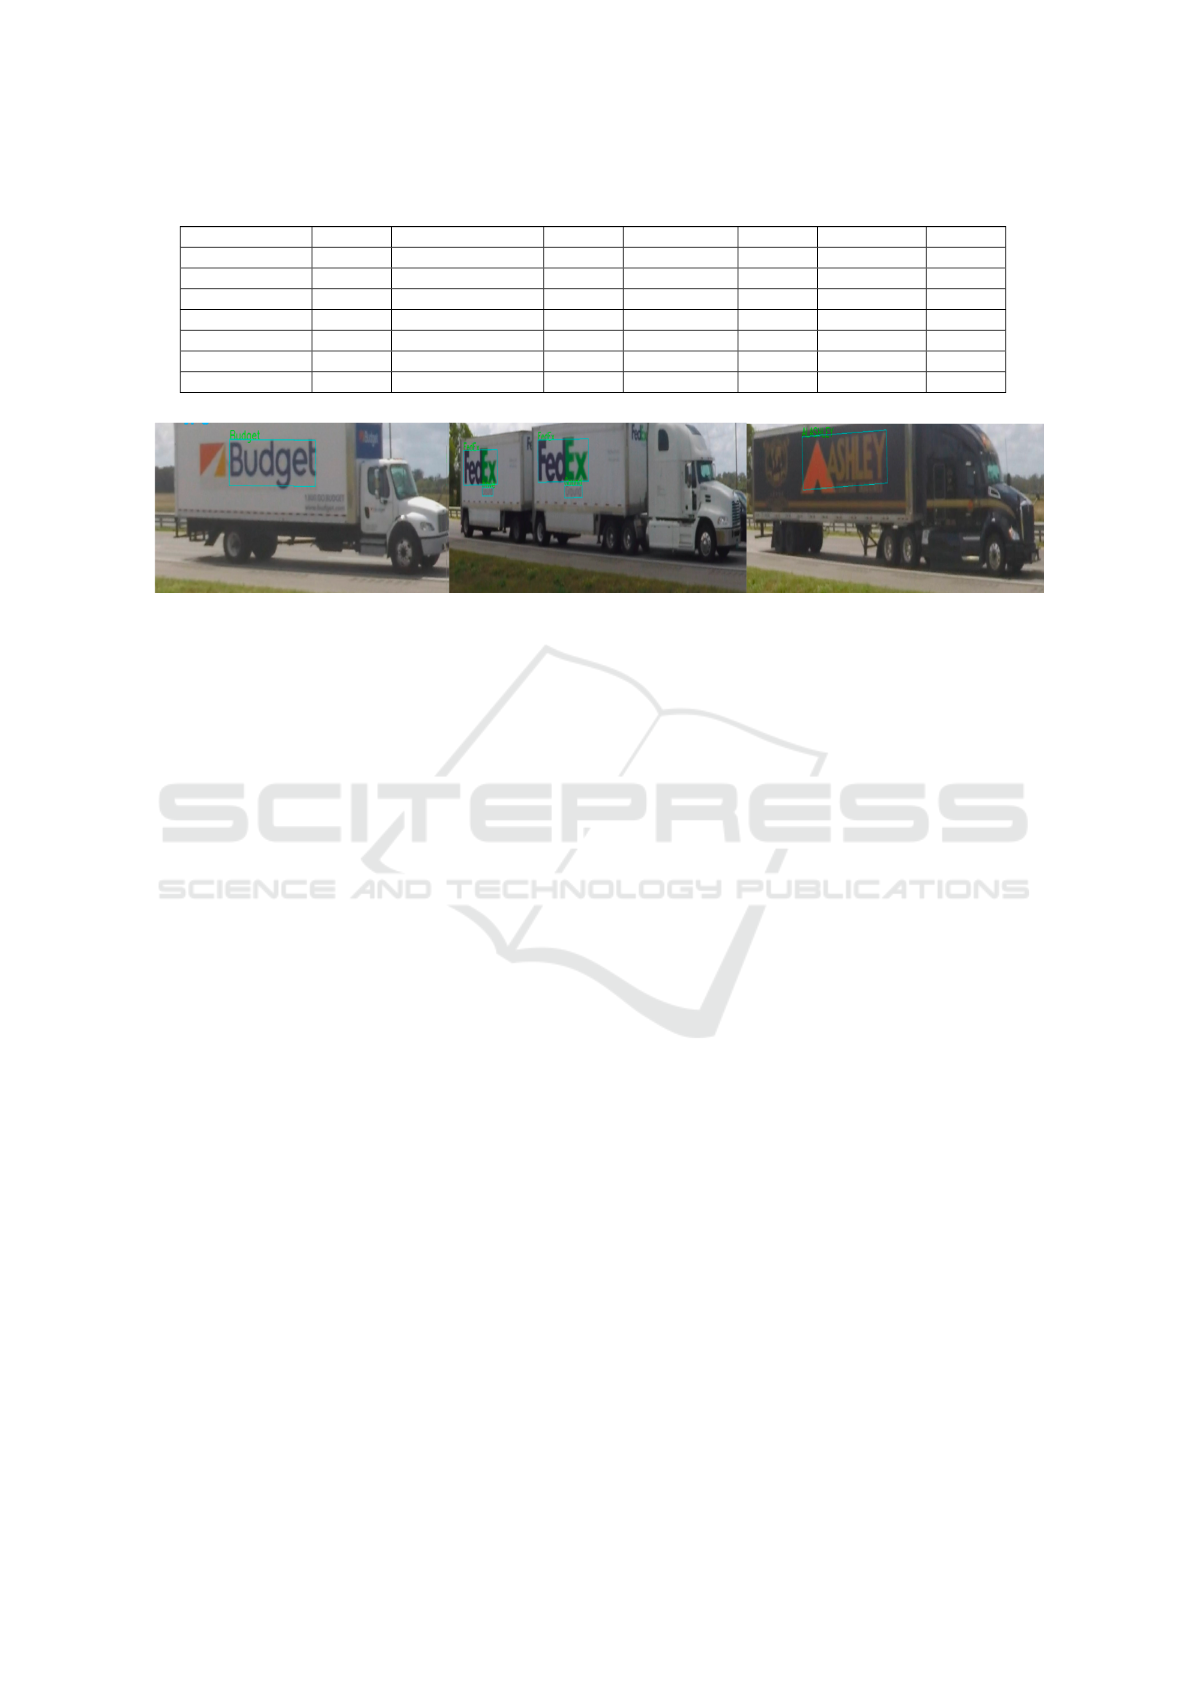
Table 2: Logo distributions of the Annotated Logo Dataset.
Logo Class Images Logo Class Images Logo Class Images Logo Class Images
Ashley 83 E 248 Lays 64 UPS 236
Atlas 52 FedEx 1128 OD 392 US Foods 163
Budget 47 HamburgSUD 63 Opies 51 Werner 142
CarrollFulmer 30 HeartlandExpress 245 Prime 48 XTRA 489
Celadon 107 Heyl 50 RBI 281 YRC 53
Davis 95 JNJ 168 SouthernAG 174 Total 5,020
Dollar General 199 Landstar 362 Sunstate 50
Figure 4: The developed algorithms achieved a high recall with a competitive recognition accuracy. Notice that some of the
recognition results missed or wrongly predicted one or a few characters, which in reality should not cause many problems
because the recognition results are further processed by matching the most similar results.
Two commonly used metrics, recall (Rec) and preci-
sion (Prec), are used. Besides, we use the average
precision (AP) that measures the detection accuracy
of the developed universal logo detector. It computes
the average precision for recall values ranging from 0
to 1. The general definition has the formula:
AP
AP
AP =
Z
1
0
p
p
p(r)dr (6)
where p
p
p(r) is the precision value at the recall value r.
In practice, the equation is replaced with a finite sum
over several recall values, such as the 11-point inter-
polated AP used in the Pascal VOC challenge (Ever-
ingham et al., 2010) that is defined as the mean pre-
cision at a set of 11 equally spaced recall values ([0,
0.1, 0.2, ..., 1]). We follow the new evaluation pro-
tocol of the Pascal VOC challenge where they use all
data points, rather than interpolating only 11 equally
spaced points (Everingham et al., 2010). The mean
Average Precision (mAP) is used for evaluating the
logo detection and recognition for all logo classes.
We considered a detection correct if the IoU (Intersec-
tion over Union) between predicted logos and ground
truth logos exceeded a certain threshold (such as 0.5).
3.2 Experimental Results
In this section, we evaluated the proposed approaches
for the following: evaluation on logo detection, evalu-
ations on end-to-end logo recognition. We conducted
ablation studies for each step with different threshold
settings. These studies illustrated and detailed advan-
tages and disadvantages of each model component,
which sheds light on exploring commodity classifica-
tion.
3.2.1 Qualitative Results
The results are illustrated in Figure 4. The logo texts
appear on different truck bodies where some of texts
are extremely tiny (e.g., the ’FedEx’ in the right). It
can detect words in a high recall with competitive
recognition accuracy. With these predictions, we fur-
ther merge words that are horizontally close to each
other into a single prediction. By doing so, we can
partly handle the cases where the logo class contains
multiple words such as ’Dollar General’.
3.2.2 Quantitative Results
Logo Text Detection. We evaluate the perfor-
mance of the developed text detector on our proposed
dataset. As illustrated in Table 3, it achieves a high re-
call (Rec ) of 94.04% and a good precision of 89.20%
with the threshold value 0.3. Both the recall and pre-
cision drop rapidly when we further increase the IoU
threhold. The reason is ascribed to the fact that the de-
veloped text detection method tends to predict tighter
bounding boxes around text regions. The logo region
is usually larger than text regions as it usually consists
of both text and figure regions. The gap is seen in the
annotation process of our ALD dataset where we an-
notate bounding boxes by covering the whole logo re-
gions. Predictions from our text solution are expected
to be smaller than the ground truth annotations, which
can worsen the recall. Therefore, we argue that setting
VEHITS 2020 - 6th International Conference on Vehicle Technology and Intelligent Transport Systems
234
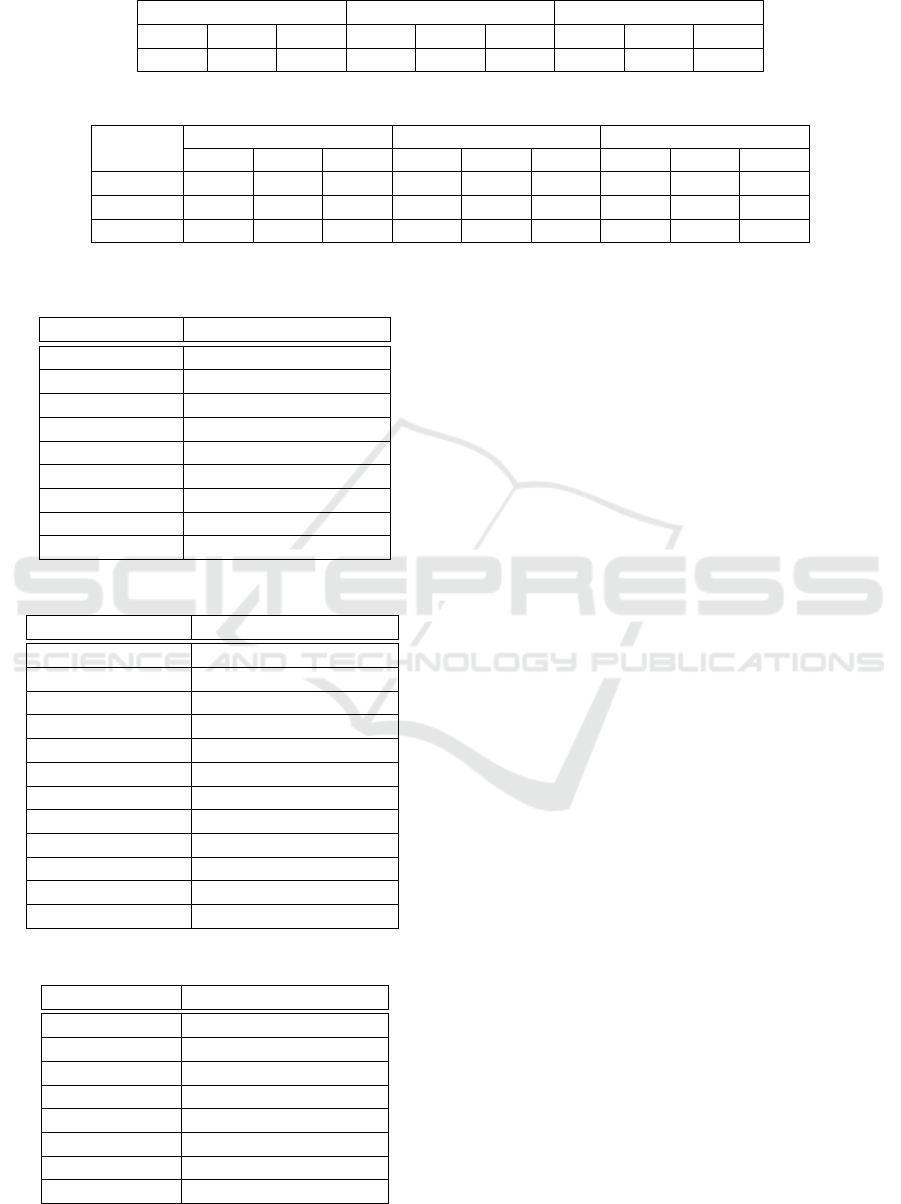
Table 3: Results of logo text detection.
IoU = 0.1 IoU = 0.3 IoU = 0.5
Prec Rec AP Prec Rec AP Prec Rec AP
91.59 96.56 93.12 89.20 94.04 87.25 56.60 59.67 36.75
Table 4: Evaluations on three logo groups with different thresholds.
IoU = 0.1 IoU = 0.3 IoU = 0.5
Prec Rec AP Pre Rec AP Prec Rec AP
Easy 93.07 98.55 96.31 90.65 95.55 91.72 66.06 68.98 63.51
Medium 93.43 90.64 88.92 93.43 90.64 88.92 66.75 63.11 56.83
Difficult 39.88 24.53 23.43 39.88 24.53 23.43 37.21 23.32 21.67
Table 5: Detailed results on easy logo classes.
Easy Class Prec Rec AP
Ashley 100.0 98.8 98.8
Celadon 86.99 100.0 98.26
Dollar General 100.0 98.99 98.99
Fedex 86.79 91.09 89.41
Landstar 61.02 75.69 53.92
Prime 90.57 100.0 94.55
Sunstate 100.0 100.0 100.0
XTRA 99.8 99.8 99.8
Mean 90.65 95.55 91.72
Table 6: Detailed results on medium logo classes.
Medium Class Prec Rec AP
Atlas 96.3 100.0 98.11
Budget 74.6 100.0 88.68
CarrollFulmer 100.0 73.33 73.33
HamburgSUD 100.0 87.3 87.3
HeartlanEexpress 100.0 62.04 62.04
Heyl 100.0 100.0 100.0
JNJ 100.0 75.0 75.0
Lays 98.46 100.0 98.63
SouthernAG 98.86 100.0 99.12
US Foods 100.0 99.39 99.39
YRC 59.55 100.0 96.57
Mean 93.43 90.64 88.92
Table 7: Detailed results on difficult logo classes.
Difficult Class Prec Rec AP
Davis 100.0 91.58 91.58
E 0.0 0.0 0.0
OD 0.0 0.0 0.0
Opies 0.0 0.0 0.0
RBI 0.0 0.0 0.0
UPS 84.62 43.48 36.79
Werner 94.55 36.62 35.62
Mean 39.88 24.53 23.43
a slightly lower threshold value (e.g., 0.3) is fair to
evaluate the logo detection. In addition, the multiple
texts and multi-line texts presented in the logo regions
cause another fundamental challenge where it intro-
duces the semantic gap of scene text understanding
between machine and human beings. It is straightfor-
ward for human beings to localize, recognize, and or-
ganize the texts (e.g., multi-line texts, oriented texts,
artistic texts) into meaningful text regions or blocks,
while it is much more difficult for a machine system
to handle these cases.
Logo Recognition and Commodity Classification.
As can be found in Table 4, the text-based approach
performs well in the easy and medium categories. It
achieves high AP of 91.72% and 88.92% on easy and
medium categories, respectively. However, it fails to
detect logo classes in difficult category such as ’OD’,
’Opies’, and ’E’, where ’E’ and ’OD’ logos are de-
signed with artistic fonts and figures. The ’Opies’
logo usually appears on the body of the tank truck,
where the compartment is made of reflective materi-
als. The lighting reflection causes the failure of the
text-based approach to detecting ’Opies’. A more de-
tailed evaluation is illustrated in Table 5, Table 6, and
Table 7 where the results of each logo class are pre-
sented.
4 VISUALIZATION SYSTEM
To demonstrate the pipeline of our proposed ap-
proach, we integrate all the developed approaches,
resulting in an end-to-end visualization system. It
takes the raw roadside video as input and outputs the
truck locations, truck classes, trailer classes, detected
logo texts, and final commodity predictions automat-
ically. The visualization system plays an important
role in evaluating the effectiveness and exposing the
deficiencies of each component used in our approach.
In summary, our developed pipeline took advan-
Video-based Machine Learning System for Commodity Classification
235

tage of recent advances in deep neural networks for
object detection, semantic segmentation, and edge de-
tection. We developed deep learning algorithms that
used transfer learning to determine whether an image
frame had a truck and, if the answer is affirmative, lo-
calize the area from the image frame where the truck
is most likely to be present. We utilized a hybrid truck
classification approach that integrated deep learning
models and geometric truck features for recognizing
and classifying various truck attributes, such as trac-
tor type, trailer type, and refrigeration units, that are
useful in commodity prediction. Using logo text de-
tection and recognition, we developed state-of-the-art
techniques for extracting vendor information corre-
sponding to a truck. All these information are used
for the final commodity classification.
5 SUMMARY AND CONCLUSION
We have presented the novel end-to-end road video
processing system to provide real-time dynamic com-
modity information (indispensable downstream for
tracking commodity movements) by deploying sen-
sors and edge devices in locations of interest. Be-
sides, we have developed a new commodity classi-
fication benchmark based on logo data. To our best
knowledge, it is the first dataset collected to evalu-
ate commodity classification based on logo data. It
can be useful in providing traffic engineers and re-
searchers a dataset to systematically evaluate their de-
veloped freight classification models. Our results for
26 predominant logos derived from highway videos is
very promising. A visual system was developed to il-
lustrate the concept of commodity classification. We
believe that this accuracy can be further improved by
both adding more annotated images to the dataset as
well as by proposing an integrated technique to take
into account a image-based matching.
ACKNOWLEDGEMENTS
This paper is based upon work supported by
NSF CNS 1922782, and FDOT (BDV31-977-81,
Truck Taxonomy and Classification Using Video and
Weigh-In-Motion (WIM) Technology). The opinions,
findings, and conclusions expressed in this publica-
tion are those of the author(s) and not necessarily
those of the Florida Department of Transportation or
the U.S. Department of Transportation.
REFERENCES
Bronzini, M., Firestine, T., Fletcher, W., Greene, D.,
McGuckin, N., Meyer, M., Moore, W. H., Rick, C.,
and Sedor, J. (2018). Transportation statistics annual
report. United States Department of Transportation.
Everingham, M., Van Gool, L., Williams, C. K., Winn, J.,
and Zisserman, A. (2010). The pascal visual object
classes (voc) challenge. International journal of com-
puter vision, 88(2):303–338.
Feh
´
erv
´
ari, I. and Appalaraju, S. (2019). Scalable logo
recognition using proxies. In Winter Conference on
Applications of Computer Vision (WACV), pages 715–
725. IEEE.
Graves, A., Fern
´
andez, S., Gomez, F., and Schmidhu-
ber, J. (2006). Connectionist temporal classification:
labelling unsegmented sequence data with recurrent
neural networks. In the 23rd international conference
on Machine learning, pages 369–376. ACM.
He, P., Wu, A., Huang, X., Scott, J., Rangarajan, A., and
Ranka, S. (2019a). Deep learning based geometric
features for effective truck selection and classification
from highway videos. In International Conference
on Intelligent Transportation Systems (ITSC), 2019.
IEEE.
He, P., Wu, A., Rangarajan, A., and Ranka, S. (2019b).
Truck taxonomy and classification using video and
weigh-in motion (wim) technology final report. Final
Research Report Prepared for: Florida Department of
Transportation.
Hernandez, S. V., Tok, A., and Ritchie, S. G. (2016). Inte-
gration of Weigh-in-Motion (WIM) and inductive sig-
nature data for truck body classification. Transporta-
tion Research Part C: Emerging Technologies, 68:1–
21.
Huang, X., He, P., Rangarajan, A., and Ranka, S. (2020). In-
telligent intersection: Two-stream convolutional net-
works for real-time near-accident detection in traffic
video. ACM Transactions on Spatial Algorithms and
Systems (TSAS), 6(2):1–28.
Llorca, D. F., Arroyo, R., and Sotelo, M.-A. (2013). Vehi-
cle logo recognition in traffic images using hog fea-
tures and svm. In International Conference on In-
telligent Transportation Systems (ITSC), pages 2229–
2234. IEEE.
Psyllos, A. P., Anagnostopoulos, C.-N. E., and Kayafas, E.
(2010). Vehicle logo recognition using a sift-based
enhanced matching scheme. IEEE transactions on in-
telligent transportation systems, 11(2):322–328.
Redmon, J., Divvala, S., Girshick, R., and Farhadi, A.
(2016). You only look once: Unified, real-time ob-
ject detection. In the IEEE conference on computer
vision and pattern recognition, pages 779–788.
Shi, B., Bai, X., and Yao, C. (2016). An end-to-end train-
able neural network for image-based sequence recog-
nition and its application to scene text recognition.
IEEE transactions on pattern analysis and machine
intelligence, 39(11):2298–2304.
Zhou, X., Yao, C., Wen, H., Wang, Y., Zhou, S., He, W.,
and Liang, J. (2017). East: an efficient and accurate
scene text detector. In the IEEE conference on Com-
puter Vision and Pattern Recognition, pages 5551–
5560. IEEE.
VEHITS 2020 - 6th International Conference on Vehicle Technology and Intelligent Transport Systems
236
