
Longitudinal Evaluation of Open-source Software Maintainability
Arthur-Jozsef Molnar and Simona Motogna
Faculty of Mathematics and Computer Science, Babes¸ - Bolyai University, Cluj - Napoca, Romania
Keywords:
Software Quality, Software Metrics, Software Maintainability, Maintainability Index, Technical Debt,
Technical Debt Ratio.
Abstract:
We present a longitudinal study on the long-term evolution of maintainability in open-source software. Quality
assessment remains at the forefront of both software research and practice, with many models and assessment
methodologies proposed and used over time. Some of them helped create and shape standards such as ISO
9126 and 25010, which are well established today. Both describe software quality in terms of characteristics
such as reliability, security or maintainability. An important body of research exists linking these characteris-
tics with software metrics, and proposing ways to automate quality assessment by aggregating software metric
values into higher-level quality models. We employ the Maintainability Index, technical debt ratio and a main-
tainability model based on the ARiSA Compendium. Our study covers the entire 18 year development history
and all released versions for three complex, open-source applications. We determine the maintainability for
each version using the proposed models, we compare obtained results and use manual source code examina-
tion to put them into context. We examine the common development patterns of the target applications and
study the relation between refactoring and maintainability. Finally, we study the strengths and weaknesses of
each maintainability model using manual source code examination as the baseline.
1 INTRODUCTION
Maintainability represents the ”degree of effective-
ness and efficiency with which a product or system
can be modified to improve it, correct it or adapt
it to changes in environment, and in requirements”
(ISO/IEC 25010, 2011).
We can identify many cases of large, complex
software systems developed over a long period of
time, during which they were subjected to a large
number of modifications or extensions, many of
which were not planned from project onset. These
cases easily lead to increases in maintenance costs
related with unchecked software complexity, leading
to difficulties in localizing errors or the requirements
for carrying out source code modifications. In many
cases this is compounded by having different teams
for development and maintenance, increasing pro-
gram comprehension difficulty. This leads to main-
tenance being one of the key factors for continued in-
crease of costs during the software lifecycle.
One important cause is that maintenance is usually
considered during the late stages of software develop-
ment, which is usually focused on delivery. Provid-
ing the development team with adequate tool-backed
methodologies facilitates foresight of difficult situa-
tions and can help avoid some of the technical prob-
lems that otherwise build up in what is now known as
technical debt. Additional useful information is repre-
sented by discovering maintenance hotspots, namely
those parts of the source code that are most difficult
to maintain. Even more, agile practices such as con-
tinuous delivery have reinforced the importance of in-
tegrating maintenance activities tightly within the de-
velopment process.
Our goal is to study the long term evolution of
software maintainability in large open-source appli-
cations. We assess target application maintainabil-
ity using relevant software quality models. Our fo-
cus on open-source software allows us to validate tar-
get application source code, check that all functional-
ities are present and apply proposed quality models.
Several studies have investigated the relation between
maintainability and software metrics (Chidamber and
Kemerer, 1994; Heitlager et al., 2007; Marinescu,
2002; Li and Henry, 1993), while others have investi-
gated maintainability as a software quality factor (R.
Lincke, W. Lowe, 2019; ISO/IEC 25010, 2011; Hyn-
ninen et al., 2018). Previous work proves that a rela-
tion exists between software maintainability and met-
rics. However, further investigation is required to pro-
vide practitioners with actionable results that can be
120
Molnar, A. and Motogna, S.
Longitudinal Evaluation of Open-source Software Maintainability.
DOI: 10.5220/0009393501200131
In Proceedings of the 15th International Conference on Evaluation of Novel Approaches to Software Engineering (ENASE 2020), pages 120-131
ISBN: 978-989-758-421-3
Copyright
c
2020 by SCITEPRESS – Science and Technology Publications, Lda. All rights reserved

integrated into software development workflows.
The novelty of our approach consists in (i) study-
ing the evolution of software maintainability over the
long-term, by evaluating all released versions of the
target applications using several quality models; (ii)
identifying long-term trends in application maintain-
ability that are common across the studied applica-
tions and (iii) studying the quality models themselves
in order to analyze their strengths and weaknesses
through the lens of complex software systems.
The following section is dedicated to detailing the
maintainability models used in our study, while Sec-
tion 3 details our case study, carried out according to
best practices (Runeson and H
¨
ost, 2009). Relevant re-
lated work is presented in Section 4, while Section 5
is reserved for conclusions.
2 PRELIMINARIES
As DeMarco underlines: ”you cannot control what
you cannot measure” (DeMarco, 1982), software
metrics have become essential indicators for control-
ling software. Starting with the earliest employed
metrics, that measured the number of lines of code,
functions, modules, or classes in a program, and con-
tinuing with metrics associated with complexity, they
have proven their usefulness in measuring and con-
trolling software development. This is especially true
in the case of large-scale software. Object oriented
metrics (Chidamber and Kemerer, 1994) provided an
important boost to the domain, by using metrics to
detect code smells, improve maintainability and other
software quality characteristics.
The importance of maintainability is illustrated by
its inclusion as a quality factor in all proposed soft-
ware quality models. The most recent standardized
model is ISO 25010 (ISO/IEC 25010, 2011), in which
maintainability is comprised of sub-characteristics
Modularity, Reusability, Analyzability, Modifiability
and Testability. This provides an early indication re-
garding the aspects that are important to easily main-
tain code. Unfortunately it does not offer a method-
ology to improve this factor, nor a formalized way of
assigning it a numerical value. To fulfill this need,
several ways to model and measure maintainability
have been proposed. We selected three such models
for inclusion in our case study, and we describe them
in the following sections.
2.1 Maintainability Index
The Maintainability Index (MI) was introduced in
1992 (Oman and Hagemeister, 1992) and is perhaps
the most well established metric for software main-
tainability. The index can be applied at function, mod-
ule or program level. While several variants of it ex-
ist, we employ a version that is detailed within several
modern-day software tools (Virtual Machinery, 2019;
Microsoft VS Docs, 2020):
MI = 171 − 5.2 ∗ ln(aveV ) − 0.23 ∗ aveG − 16.2 ∗
ln(aveSTAT ), where:
• aveV - average Halstead volume. It reflects the
computational load of the code in terms of opera-
tors and operands used.
• aveG - average cyclomatic complexity. It reflects
the number of possible execution paths.
• aveSTAT - average number of source code state-
ments. Variants exist using the number of lines of
code, however the consideration is (Virtual Ma-
chinery, 2019) that the number of statements pro-
vides a better reflection of source code size.
In this form, MI values range from 171 down to neg-
ative numbers. However, negative MI values reflect
very poor maintainability. As such, the following nor-
malized value was introduced (Microsoft VS Docs,
2020): MI
normalized
= max(0,
100
171
∗ MI). Normalized
values range between 0 and 100, with values below 20
illustrating poor maintainability (Microsoft VS Docs,
2020). Several code inspection and development tools
can compute the MI, including JHawk (Virtual Ma-
chinery, 2019), SonarQube (SonarSource, 2019), the
Metrics .NET library (Metrics library, 2019) and Mi-
crosoft Visual Studio (Microsoft VS Docs, 2020).
However, studies exist criticizing this metric
(Heitlager et al., 2007; Welker, 2001; van Deursen,
2014). They illustrate different inconsistencies that
occur when used in the context of current program-
ming languages. In addition to various tools imple-
menting different versions of the MI, such as adding
an additional parameter for comments, we find dis-
agreement regarding threshold values for poor main-
tainability (Virtual Machinery, 2019; Naboulsi, 2011;
Microsoft VS Docs, 2020). As the MI was proposed
in the ’90s, it does not consider object orientation,
which emphasized new relations, such as inheritance,
coupling and cohesion to the forefront. These were
proven to have significant impact on maintainability
(Chidamber and Kemerer, 1994; Li and Henry, 1993;
Marinescu, 2002; Molnar and Motogna, 2017).
2.2 Technical Debt Ratio
Technical debt provides a numerical representation
of the required maintenance effort, tailored towards
large applications. Technical debt is used increas-
ingly often, especially in the context of agile devel-
Longitudinal Evaluation of Open-source Software Maintainability
121
opment methodologies. Originally introduced as a
metaphor borrowed from the financial sector (Cun-
ningham, 1992), technical debt suggests that the debt
accumulated during development is transformed in
a financial debt to be paid in the context of release
versions. Technical debt is considered a fair mea-
sure of the deficiencies in internal quality of software
(Fowler, 2019). The concept gained popularity after
it was detailed in the Software Quality Assessment
Based on Lifecycle Expectations (SQALE) method-
ology introduced by J.L. Letouzey (Letouzey, 2012).
SonarQube is perhaps the most well known tool
that calculates technical debt. It employs a config-
urable model where each issue discovered using static
analysis is associated with an estimation of the time
required to fix it. The technical debt represents the to-
tal time required to fix all discovered issues. The tech-
nical debt ratio puts the debt into context, by dividing
the amount of time required to fix all issues by the es-
timated time to create the software system
1
. As such,
technical debt ratio values range between 0 and 1. By
default, the SonarQube model (SonarSource, 2019)
assigns the best maintainability rating of A to code
with technical debt ratio smaller than 0.05, where fix-
ing all issues requires less than 5% of the total de-
velopment time. The worst rating of E is assigned to
code having debt ratio over 0.5.
2.3 ARiSA Model for Maintainability
Another approach for metric-driven measurement
of software maintainability is based on the Com-
pendium of Software Quality Standards and Metrics
(R. Lincke, W. Lowe, 2019), currently maintained by
ARiSA
2
, together with researchers at Linnaeus Uni-
versity
3
. The ARiSA Compendium explores the re-
lation between software quality, as expressed by the
ISO 9126 standard, and software metrics. The ISO
9126 quality model is comprised of six characteristics
and 27 sub-characteristics. One of the six character-
istics is Maintainability, with sub-characteristics An-
alyzability, Changeability, Stability, Testability and
Compliance. For each sub-characteristic, with the
exception of Compliance, the Compendium provides
a set of related metrics, as well as the strength and
direction of each metric’s influence. This informa-
tion is synthesized in Table 1. As shown, the influ-
ence can be direct (plus sign, showing a direct re-
lation between the metric value and corresponding
sub-characteristic) or inverse (minus sign), as well as
1
By default, SonarQube estimates 0.06 days to develop
one line of code.
2
http://www.arisa.se/index.php?lang=en
3
We refer to this work as the ARiSA Compendium.
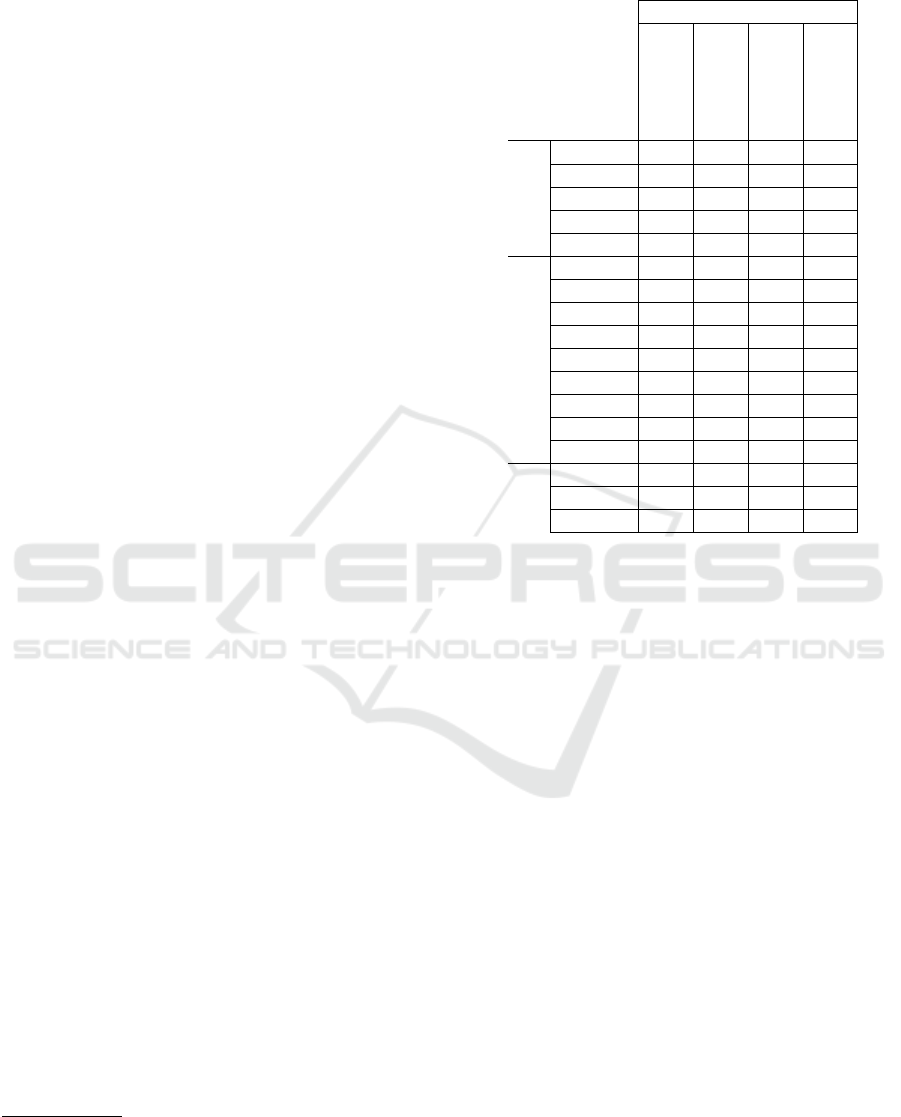
Table 1: Metric influences on maintainability according to
the ARiSA model.
Maintainability
Category
Metric
Analyzability
Changeability
Stability
Testability
Complexity
LOC −− −− - −−
NAM −− −− - −−
NOM −− −− - −−
WMC −− −− - −−
RFC −− −− - −−
Structure
DIT −− −− - −−
NOC - −− - -
CBO −− −− −− −−
DAC −− −− −− −−
LD ++ ++ ++ ++
MPC −− −− −− −−
LCOM −− −− −− −−
ILCOM −− −− −− −−
TCC ++ ++ ++ ++
Design
LOD −− −− - −−
LEN −− −− −− −−
CYC −− −− −− −−
strong (doubled sign). For example, increased LOC
has a strong and negative influence on Analyzability.
Metric values can be extracted using the
VizzMaintenance (ARISA Compendium, VizzMain-
tenance, 2019) Eclipse plugin, which can extract val-
ues for the following class-level metrics: lines of code
(LOC), number of attributes and methods (NAM),
number of methods (NOM), weighted method count
(WMC), response for class (RFC), depth of inher-
itance tree (DIT), number of children (NOC), cou-
pling between objects (CBO), data abstraction cou-
pling (DAC), locality of data (LD), message pass cou-
pling (MPC), lack of cohesion in methods (LCOM)
and its improved variant (ILCOM), tight class cohe-
sion (TCC), lack of documentation (LOD), length of
names (LEN) and number of classes in cycle (CYC).
The aim is to provide a comprehensive view of object-
oriented systems, capture their size, complexity, ar-
chitecture and structure. Formal definitions for these
metrics are available in the Compendium (R. Lincke,
W. Lowe, 2019) as well as detailed in existing re-
search (Barkmann et al., 2009; Molnar. et al., 2019).
The ARiSA model for maintainability is based
on metric values aggregated according to the weights
shown in Table 1. For each class, the percentage of
extreme metric values is computed. A value is con-
sidered extreme when it is within the top or bottom
15% of the metric’s value range for all system classes.
ENASE 2020 - 15th International Conference on Evaluation of Novel Approaches to Software Engineering
122

Once calculated for each metric, these are aggregated
for each criteria in accordance with the weight and di-
rection illustrated in Table 1. This results in a value
between 0 (no extreme values) and 1 (all metric val-
ues are extremes) for each of the four criteria, which
is then averaged to obtain the maintainability score of
the class. For example, let us assume a class having
a single extreme value, that of LOC. According to the
information in Table 1, its Analyzability score is
2
33
.
The numerator is given by the weight LOC has in An-
alyzability, represented by the two minus signs. The
sum of the weights for the Analyzability criteria is 33.
It follows then that Changeability is
2
34
, Stability is
1
26
and Testability is
2
33
. The maintainability score of the
class will be
2
33
+
2
34
+
1
26
+
2
33
4
≈ 0.0546, or 5.46%.
The ARiSA model was developed according to
ISO 9126. While superseded by the newer ISO
25010, their differences regarding maintainability are
small, so we believe models built on the older stan-
dard remain valid. When compared to the MI, the
ARiSA model appears more comprehensive by tak-
ing into consideration object-oriented metrics that ex-
press cohesion, coupling and inheritance. In order to
scale the model from class to system level, we take
a similar approach to the MI. We calculate the main-
tainability score for each system class and calculate
the geometric mean across system classes.
3 CASE STUDY
3.1 Research Objective
Our case study is organized according to the structure
proposed by (Runeson and H
¨
ost, 2009). The present
section details case study design, while target appli-
cations and the procedure for data collection are dis-
cussed in Section 3.2. We report the results of our
analysis in Section 3.3, and address the threats to va-
lidity in Section 3.4, using the structured approach
proposed by (Runeson and H
¨
ost, 2009).
The main objective of our work can be stated
using the goal question metric approach (Caldiera
and Rombach, 1994) as follows: ”study the long-
term evolution of maintainability in open-source soft-
ware through the lens of metric-based software qual-
ity models”. We distill the main objective into five
research questions that will guide the design and anal-
ysis phases of the case study:
R
R
RQ
Q
Q
1
: Is maintainability correlated with software
size? The purpose of RQ
1
is twofold. First, we check
that the proposed quality models do not actually mea-
sure software size. Second, we aim to study the in-
fluence of software size on reported maintainability.
For instance, as LOC is one of the components of the
MI, we expect it to be more readily influenced than
the technical debt ratio. We also aim to address the
na
¨
ıve expectation that increased application size leads
to lowered maintainability.
R
R
RQ
Q
Q
2
: How does the maintainability of open-
source software change from one version to another?
We use the quality models detailed within the pre-
vious section, coupled with manual examination of
the source code to identify both short and long-term
trends during application development. This enables
data triangulation as suggested by (Runeson and H
¨
ost,
2009), lowering the risk of maintainability changes
not being detected by the proposed models, and en-
ables comparing results. We study the relation be-
tween software functionalities, software size and re-
ported maintainability. We are also interested to iden-
tify and determine the impact that major changes to
software, such as the addition of important features or
refactoring, have on maintainability.
R
R
RQ
Q
Q
3
: Do differences exist between the maintain-
ability scores reported for the same software version?
Existing research (Molnar and Motogna, 2017) has
shown this as an important possibility. Given that
each quality model uses its own scale, we identify
those versions where differences exist in the main-
tainability change between the last and current studied
version.
R
R
RQ
Q
Q
4
: What causes the differences observed within
RQ
3
? We expect that answering RQ
4
will improve
the understanding of the strengths and limitations the
proposed models have when applied to complex soft-
ware. In addition, we aim to study any versions where
changes to maintainability were not discovered by any
of the proposed quality models.
R
R
RQ
Q
Q
5
: Which of the proposed models is the most
accurate at reflecting changes in software maintain-
ability? Answers to the previous research questions,
especially RQ
4
will highlight the strengths and weak-
nesses of each proposed model. The purpose of RQ
5
is not to determine which model provides the best ap-
proximation of software maintainability, but to deter-
mine which model is most suitable at reflecting the
changes that occur during the development of soft-
ware. In addition, we aim to identify the proper con-
text where each model provides valuable insight.
3.2 Target Applications
We defined a number of selection criteria for target
applications. The goal was to ensure that our case
study captures the development history for several ap-
plications, that results can be compared across the in-
Longitudinal Evaluation of Open-source Software Maintainability
123

cluded systems and that results can be extrapolated to
an important class of software systems.
First, we were interested in mature applications
having an important user base, for which we had
access to the entire development history. Second,
we limited our selection to GUI-driven Java applica-
tions. This ensures the same code metrics and mea-
surements can be used and compared across applica-
tions. Restricting the study to one popular applica-
tion category allows producing a more representative
picture. This is especially important when consider-
ing open-source software, as existing research (Bark-
mann et al., 2009) shows that in many cases, develop-
ment effort is not consistent and repositories include
incomplete source code, that does not run or cannot
be compiled. Finally, we steered towards applications
having few dependencies to external libraries or other
components, databases or the Internet. This facili-
tated setting up each application version and ensured
that the source code for application functionality was
self-contained.
We selected three open-source Java applications
having long development histories, a well-established
user base and a development repository that includes
source code, release version history and associated
change logs. The three applications are the Free-
Mind
4
mind mapper, the jEdit
5
text editor and the
TuxGuitar
6
tablature editor.
FreeMind: is a functionally-rich application for
creating and editing mind maps that was previously
used in empirical software engineering research (Arlt
et al., 2012). It has a consistent user base, with over
744k application downloads over the last 12 months,
and over 24 million over its lifetime
7
. Among the
applications in our case study, FreeMind’s develop-
ment history can be traced closest to the project’s
start. The first released version was 0.0.3
8
, and con-
sisted of 3.700 lines of code (LOC) and 60 classes.
Early versions do not have many functionalities, with
frequent changes to source code structure and appli-
cation architecture. Figure 1 illustrates the evolution
of LOC and class counts for each of the released ver-
sions. Early versions become more complex as more
functionalities are integrated. An important jump is
recorded in version 0.8.0, reflected both in the appli-
cation’s look and available functionalities as well as
recorded metrics. Application code is refactored in
4
http://freemind.sourceforge.net/wiki/index.php/Main Page
5
http://jedit.org
6
http://www.tuxguitar.com.ar
7
All data points from https://sourceforge.net/, recorded
December 12
th
, 2019.
8
We employ the version numbers provided by the devel-
opers.
version 0.9.0Beta17, resulting in reduced numbers for
LOC and classes, without impacting application func-
tionalities. Values for these metrics stabilize after this
version, showing a slow increase until the most recent
release.
jEdit: is a popular text-editor with plugin support
and a large user base. The application recorded 99k
downloads during the last year, and over 9 million
over its development history. The first version was re-
leased in January 2000. Compared to other early ap-
plication versions in our study, early versions of jEdit
are the most stable and fully featured. The application
was also used in empirical software research target-
ing the generation of GUI test cases (Arlt et al., 2012;
Yuan and Memon, 2010), software metrics (Molnar.
et al., 2019) and maintainability (Molnar and Mo-
togna, 2017). Figure 1 shows a steady increase in
the application code base throughout its development
history. The single notable exception is version 3.0fi-
nal, where refactoring caused a decrease in applica-
tion size. Like FreeMind, plugin source code was not
included in our evaluation.
TuxGuitar: is a multi-track guitar tablature ed-
itor. It employs an SWT-driven GUI across all
recorded versions, while FreeMind and jEdit use
AWT/Swing components. One of the application’s
key functionalities regards support for importing and
exporting data in multiple formats. This is imple-
mented in the form of plugins that ship with the de-
fault application installation and was included in our
evaluation.
Just like FreeMind and jEdit, TuxGuitar is also
a popular application with an established user base,
having over 218k downloads in the last year and 6.7
million during its lifetime. Figure 1 illustrates the sys-
tem’s evolution in size, which we find to be similar to
jEdit. The most significant difference is that we could
not find instances of decreasing application complex-
ity. However, it is possible that such changes were
carried out between releases and compensated by new
code.
Our study includes the 38 released versions of
FreeMind, 43 in the case of jEdit and 26 TuxGui-
tar releases. As shows in previous research, we can-
not make assumptions on source code in open-source
repositories. In their study, (Barkmann et al., 2009)
found that one third of the applications considered
in their case study required manual fixes before they
could be started. As such, we imported each version
into an IDE. The source code for each version was
manually examined. For the older application ver-
sions, small changes had to be made to ensure they
could be compiled and run under the Java 8 platform.
An example of such changes regards variables named
ENASE 2020 - 15th International Conference on Evaluation of Novel Approaches to Software Engineering
124
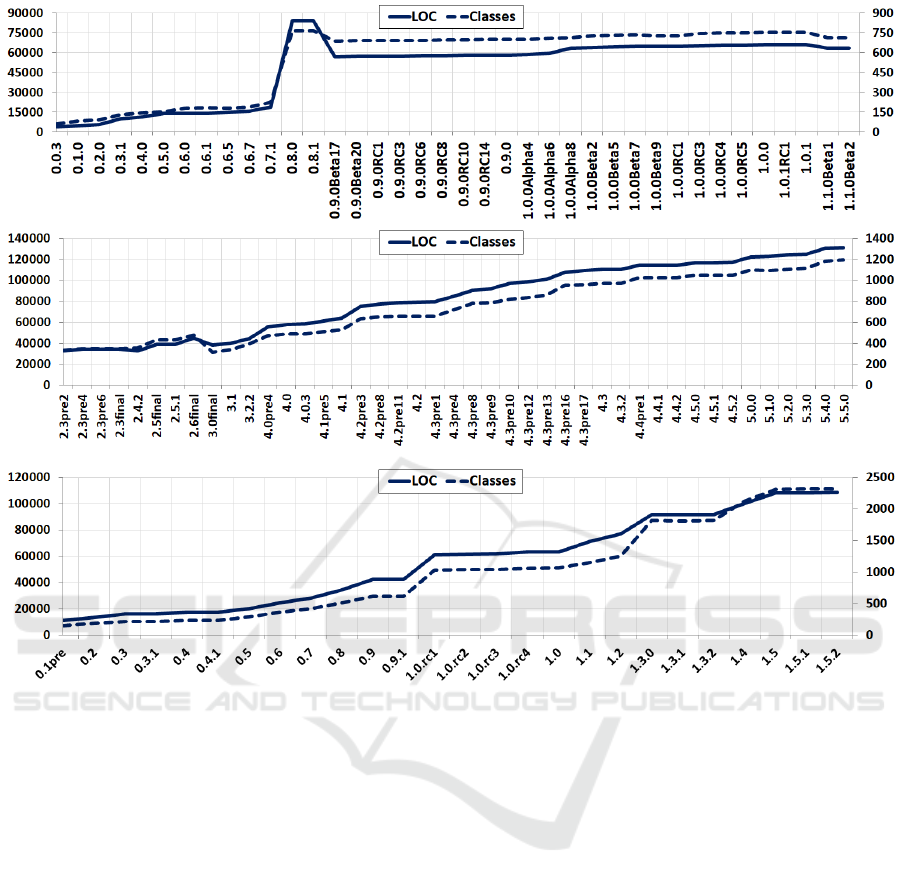
Figure 1: The size of FreeMind (top), jEdit (middle) and TuxGuitar (bottom) versions measured as lines of code (LOC) and
number of classes.
enum in older source code. As Java 1.5 introduced
the enum keyword, these variables had to be renamed
in order to ensure successful compilation. In sev-
eral cases, open-source library code was found bun-
dled together with application code. We separated
this code into library files in the application classpath,
to make sure it did not skew recorded metric values.
We started each application version and checked ev-
ery functionality to make sure the compiled source
code was complete.
3.3 Analysis
In this section we present our analysis of the collected
data and provide answers to the research questions.
To answer RQ
1
, we consider the number of a system’s
classes as a suitable proxy for its size. While this does
not account for differences in software architecture,
concurrency or distributed software, we believe it
to be suitable when limited to the selected category
of applications. We calculate the Spearman rank
correlation between the maintainability reported for
each application version and its number of classes.
Improved maintainability is represented by higher
values of the MI, and lower values in the ARiSA
model and technical debt ratio. Table 2 does not
reveal strong correlation between any of the applica-
tions and quality models.
FreeMind and jEdit results are similar. Both
ARiSA and MI measurements are inversely-
correlated with application size, but for different
reasons. For the ARiSA model, classes added to later
system versions serve to keep the mean value close
to constant, even when application size increases. In
the case of the MI, we observe that increased system
size generally drives joint increases in Halstead
volume, statement count and cyclomatic complexity.
This illustrates the na
¨
ıve expectation that lower
maintainability is reported for larger applications.
However, technical debt ratio remains independent of
both application’s sizes.
TuxGuitar results are determined by a conscien-
Longitudinal Evaluation of Open-source Software Maintainability
125
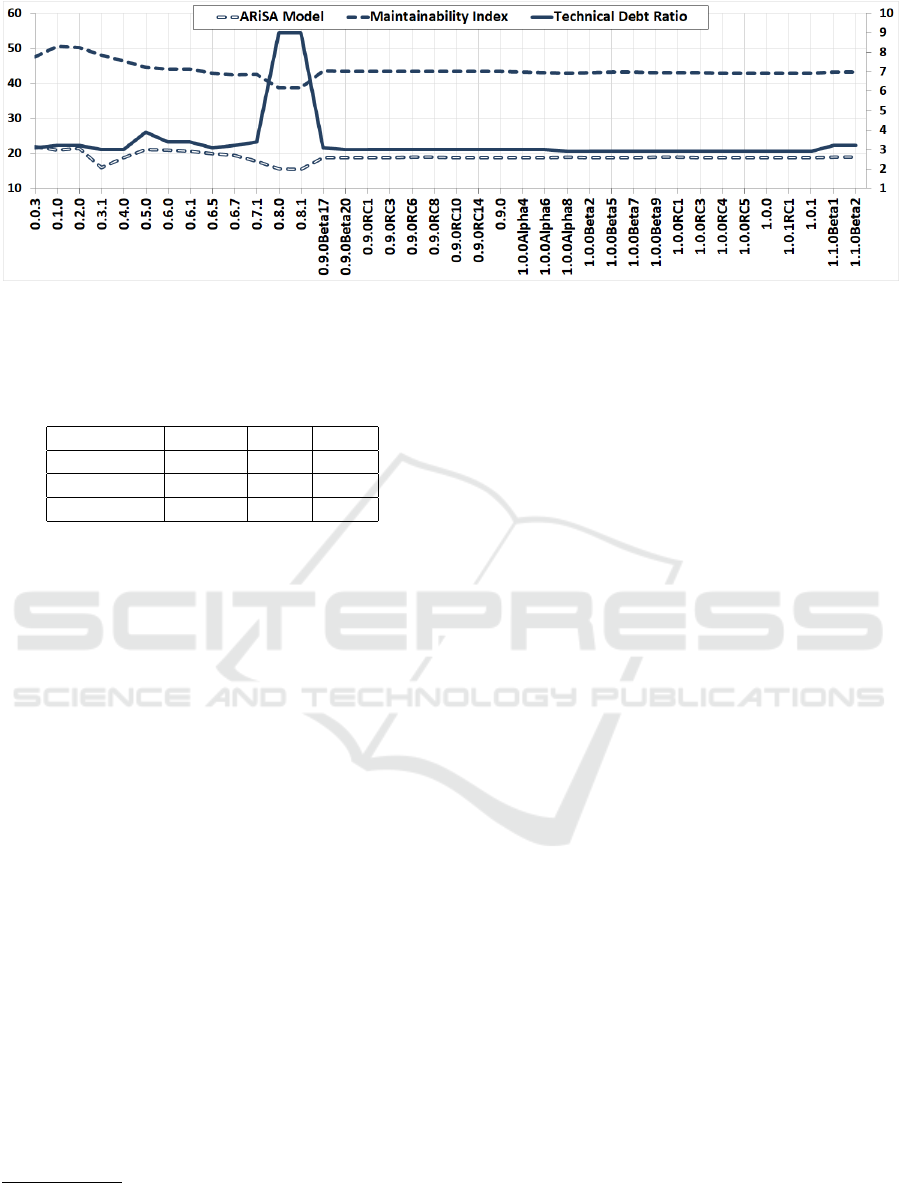
Figure 2: FreeMind maintainability according to the quality models. Technical debt ratio uses the scale on the right side.
Table 2: Spearman rank correlation between software size
and maintainability measured using the ARiSA model,
technical debt ratio (TDR) and the Maintainability Index
(MI).
Application ARiSA TDR MI
FreeMind -0.49 0.09 -0.67
jEdit -0.50 0.04 -0.32
TuxGuitar 0.67 -0.71 0.64
tious effort to keep technical debt in check within the
project’s latter versions. Figure 1 shows important in-
creases in system size for several versions, including
1.0rc1, 1.3 and 1.5. However, Figure 4 shows very
low levels of technical debt ratio. This is illustrated
through the correlation values in Table 2, as well as
in Figure 4, which shows improved MI values after
version 1.2 and a very low level of technical debt in
all versions following 0.9.1.
We answer RQ
2
using the maintainability data
points in Figures 2, 3 and 4. Data points were col-
lected after normalizing values to the [0, 100] range
9
.
Improved maintainability is illustrated using higher
values of the MI, and lower values using the ARiSA
model and technical debt ratio.
Our first observation continues the idea behind
RQ
1
. FreeMind versions newer than 0.9.0Beta17
have almost constant maintainability across all qual-
ity models, even with new features that increase class
count and LOC by 20%. For jEdit, the ARiSA-based
model and MI see small changes between versions
4.2pre3 and 5.2.0, even with the increased application
size shown in Figure 1. After version 4.0pre4, tech-
nical debt ratio remains on a downward slope, due to
newly added code introducing few code smells and
little technical debt. The same holds for TuxGuitar.
Versions after 0.9.1 show improved maintainability,
9
We used the MI
normalized
formula, while the numerical
values from the ARiSA model and technical debt ratio rep-
resent percentages.
even if later application versions more than double
LOC and class count, as shown in Figure 1.
The second observation regards early application
versions. The smallest application versions in our
case study are the early version of FreeMind, for
which we record frequent changes to maintainability.
The same can be observed for jEdit and TuxGuitar,
and manual examination of the code shows that appli-
cation structure remains fluid, with each release com-
bining new features with refactoring. As expected,
latter versions have a well defined architecture that
does not change as much, with new features imple-
mented over the existing system of plugins or event-
handling systems.
In several cases, sequences with little variance
in maintainability are bounded by versions where
recorded values change abruptly. The most repre-
sentative examples are FreeMind versions 0.8.0 and
0.9.0Beta17. All three models reflect the change in
maintainability. Versions 0.8.* are the only ones to
receive a B maintainability rating according to their
technical debt ratio, all the rest being A’s. The root
cause is a large push in development resulting in a
sharp increase in LOC and class count. 0.8.0 is the
first version to use external libraries for XML process-
ing and input forms. During use, it is clear that ver-
sion 0.8.0 is more complex and fully-featured, with
many visible changes at the user interface level, in-
cluding more complex application preferences and
features for mind map and node management. The
scope of changes remains apparent at source file level,
with only 21 out of the 92 source files remaining un-
changed from version 0.7.1. The number of source
files also increases greatly, from 92 to 469. Much of
the observed discrepancy between numbers of source
files, classes and LOC between the versions can be
explained by the newer application including 272
classes that were generated by the JAXB libraries
encoding most of the actions that can be performed
within the application. These classes contributed with
ENASE 2020 - 15th International Conference on Evaluation of Novel Approaches to Software Engineering
126

49.434 lines to the witnessed inflation of LOC. These
classes are removed in version 0.9.0Beta17, which
consists of only 127 source files. However, much of
the maintainability variance is not a result of changes
to system size. Version 0.9.0Beta17 has similar main-
tainability to 0.7.1, but tripled the class count and
LOC.
In the case of jEdit 4.0pre4, our examination re-
veals a disproportionate increase of the technical debt
when compared to LOC. This is caused by adding
high cyclomatic complexity code for text area man-
agement, text buffer events and the application doc-
ument model. Across most jEdit versions, these
functionalities include the application’s most complex
code.
TuxGuitar is characterized by a very good ratio
of technical debt. Version 1.0rc1 sees technical debt
ratio drop further, and keep the best values recorded
in our case study. This is due to extensive refactor-
ing that eliminated many code smells and lowered to-
tal technical debt from 326 hours to 290 hours. This,
coupled with increased size caused by adding support
for the song collection browser and new plugins leads
to the observed result. The MI also records an im-
provement in version 1.3.0. Manual examination re-
veals it to be only apparent, as it is caused by the ad-
dition of over 930 classes describing custom applica-
tion actions. They have few statements and low cyclo-
matic complexity which skews the MI by decreasing
mean values.
In order to address RQ
3
we identify software ver-
sions where the proposed quality models are in dis-
agreement. We take into consideration that each qual-
ity model uses its own scale, which does not allow us
a direct comparison of the results. We feel that a good
example are FreeMind versions 0.8.*, where a sharp
increase in technical debt ratio appears together with
a decrease of the MI. However, even these version are
rated B on SonarQube’s maintainability scale, which
ranges from A (best) to E (worst). As such, these ver-
sions do not fall under the purview of RQ
3
. Analyzing
the maintainability data reveals quality models are in
disagreement for jEdit version 4.0pre4, 4.1pre5 and
TuxGuitar versions 1.0rc1 and 1.3.0.
We examine these versions in detail in order to
provide an answer for RQ
4
. Version 4.0pre4 is an
important update, where all source files are modi-
fied, 80 new classes are added and LOC increases
by 25%. However, the complexity of added code
does not differ from that of the previous version’s
code base, it is averaged out from the MI and the
ARiSA model. However, SonarQube metrics report
over 2700 new code smells, which raise technical
debt by 50%, leading to decreased maintainability.
jEdit version 4.1pre5 highlights one limitation of the
ARiSA model, which examines class-level maintain-
ability in the context of the entire system. In this
case, the observed improvement is the result of the
way maintainability is calculated. For instance, the
ARiSA model reports different maintainability levels
for some of the most complex system classes, even
when their code was not changed.
TuxGuitar 1.0rc1 is an important update, during
which all but 3 source files were modified. Both LOC
and class count increased by 50%. New functional-
ities, such as the song collection browser and data
management plugins were added. Like in the previous
case, newly introduced code shows similar metrics to
the existing code base, so changes do not influence
the MI or ARiSA model. However, as detailed in the
RQ
2
paragraph, technical debt is decreased, both in
absolute (fewer code smells and less technical debt)
and relative size.
In the case of version 1.3.0, we again find im-
proved MI to be the result of adding a large number of
small, low-complexity classes that skew mean values,
and not the result of a real improvement to software
quality. Added code also causes a small increase in
technical debt ratio.
In order to provide an answer for RQ
5
, we exam-
ined all consecutive application version pairs manu-
ally. We started by examining each version’s package
structure, followed by a perusal of the source code
in new packages. For packages found in several ver-
sions, we examined the code changes at class-level in
order to localise architecture details and application
features. Our analysis confirmed the findings reported
for RQ
3
and RQ
4
. As such, it is our belief that from
a software development point of view, the technical
debt ratio is the most accurate of the examined main-
tainability models. We also found it to be suitable for
discovering maintainability changes across versions,
as evidenced when examining jEdit 4.0pre4 and Tux-
Guitar 1.3.0.
In contrast, we believe the MI is useful when de-
ployed for smaller code units. At method or class-
level, the skewing effect of data averaging is not
present, so the MI provides useful indication regard-
ing code complexity and readability. The scale pro-
posed in (Microsoft VS Docs, 2020) can be used dur-
ing development and code review to prevent issues
from accumulating. We found this to be important
especially during an application’s early versions. As
these versions already contain some of the most com-
plex code, preventing them from being part of the
technical debt package can be a worthwhile goal in
the long term.
The ARiSA model is best used to discover main-
Longitudinal Evaluation of Open-source Software Maintainability
127
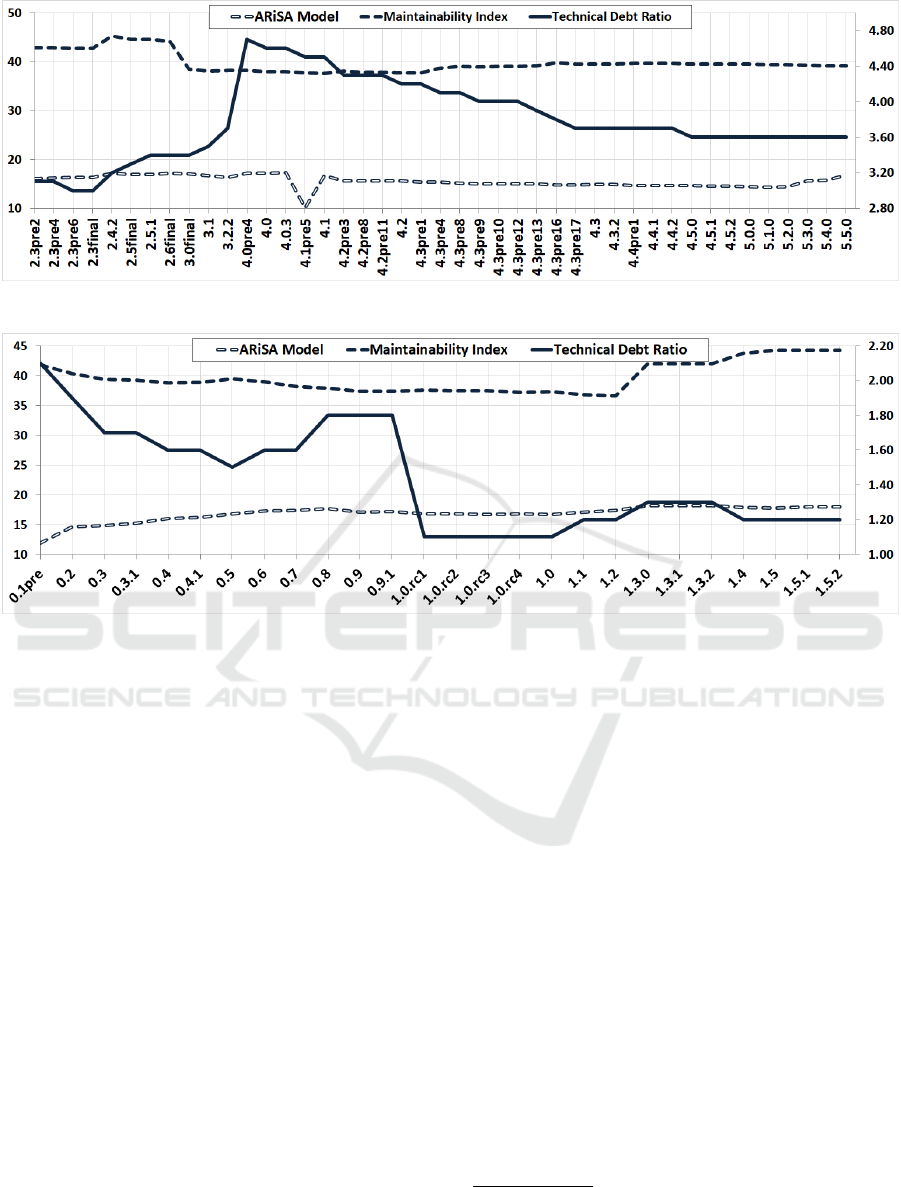
Figure 3: jEdit maintainability according to the quality models. Technical debt ratio uses the scale on the right side.
Figure 4: TuxGuitar maintainability according to the quality models. Technical debt ratio uses the scale on the right side.
tainability hot spots within the code base. Unlike the
MI, it employs a wide range of metrics, making it sen-
sitive to object-oriented code. However, using lower-
level code metrics makes it less amenable to provid-
ing a general assessment of an application. Finally,
we also observe that both MI and the ARiSA models
can be readily adapted or implemented for new lan-
guages or platforms, while doing so for the technical
debt ratio requires significant more work.
3.4 Threats to Validity
The case study was guided by (Runeson and H
¨
ost,
2009), and consisted of the following steps: identify-
ing and preparing target applications, manual source
code examination, data collection and analysis. We
documented all steps to ensure the study can be repli-
cated.
Target application selection targeted complex,
popular applications for which we could analyze both
early as well as mature versions. We restricted candi-
date applications to a narrow, but nevertheless popular
type to allow data triangulation and comparison. To
the best of our knowledge, target applications were
developed by independent teams. The study’s authors
had no involvement with the development of the target
applications, or of the metric extraction tools. Given
that each extraction tool uses its own metric defini-
tions, this can impact obtained results (Lincke et al.,
2008; Sham et al., 2012). We employed several tools
to extract metrics values
10
and cross-checked the ac-
curacy of collected data, which is available on our
website
11
.
The quality models employed were selected ac-
cording to their presence in existing literature, varying
level of implementation complexity and the possibil-
ity of obtaining a numerical value to represent main-
tainability for each software version.
We calculated both line and statement count ver-
sions of the Maintainability Index. As we found they
correlated almost perfectly (coefficient over 0.99), we
used the statement-based version. For the ARiSA
model, we aggregated values using the geometric
mean. While a different aggregation strategy might
improve the accuracy of the model, researching this
remained beyond the scope of the present paper. Be-
fore the research questions were addressed, we calcu-
10
MetricsReloaded IntelliJ plugin and the VizzMain-
tainance Eclipse plugin.
11
https://bitbucket.org/guiresearch/tools
ENASE 2020 - 15th International Conference on Evaluation of Novel Approaches to Software Engineering
128

lated the correlation between the reported values, and
made sure there was no risk of collinearity.
Threats to internal validity were addressed by car-
rying out the manual source code examination be-
fore data analysis. This was done to prevent biases
that could be introduced by the availability of main-
tainability data. Code examination was assisted by
scripts that allowed us to easily compare the source
code across different versions and summarize the size
and scope of changes.
External validity was addressed through the target
application selection process. Our analysis facilitated
finding trends that were common across the applica-
tions. Added value for cementing these results is pos-
sible through a replication study with a larger scope.
However, the requirements for testing that each ver-
sion is complete and sanitizing it, as described in Sec-
tion 3.2 make this a laborious process.
4 RELATED WORK
Existing studies regarding maintainability can be clas-
sified in two categories. The first is where maintain-
ability is computed using software metrics and the
second is where maintainability is primarily consid-
ered a software quality factor.
The relation between maintainability and software
metrics has been thoroughly investigated (Heitlager
et al., 2007; Li and Henry, 1993; Marinescu, 2002;
Molnar and Motogna, 2017). This is especially true
after the introduction of the Chidamber & Kemerer
metrics suite (Chidamber and Kemerer, 1994), as
research highlighted that predicting software main-
tenance effort was possible (Li and Henry, 1993).
Research also showed that evaluating maintainabil-
ity should take cohesion and coupling, as viewed
within the lens of object-oriented systems into ac-
count (Darcy and Kemerer, 2005). During our litera-
ture review we identified two important drawbacks of
existing approaches. First, most of the studies prove
the influence of several factors over maintainability,
but lack a computational or methodological approach
that can be used in practice. Second, where they exist,
numerical threshold values for maintainability, such
as presented in Section 2.1 remain debatable.
The most comprehensive survey of the relation be-
tween metrics and software quality attributes, includ-
ing maintainability, can be found in (R. Lincke, W.
Lowe, 2019). The survey is built on the ISO 9126
quality model. The approach is based on decompos-
ing quality characteristics in sub-characteristics and
computing the influence of several software metrics
on them, proposing a descriptive method. This repre-
sents the structured foundation for the ARiSA model
detailed in Section 2.3.
An approach to evaluate maintainability based on
the most recent ISO 25010 standard is proposed in
(T Hynninen, 2018). The study offers an interesting
perspective, but it is still in early stages, and other
direct or indirect measures should be included. The
SIG Maintainability model offers a similar proposal
(D
¨
ohmen et al., 2016; Heitlager et al., 2007), by asso-
ciating source code properties to maintainability sub-
factors, and validating this hypothesis on a large num-
ber of industrial applications. The result is repre-
sented using a scale of five levels of influence between
sub-factors and code properties. The most important
drawback of studying maintainability as a software
quality factor is the fact that it is descriptive, estab-
lishing relations or influences, but lacks a computa-
tional perspective. This precludes such models from
being included as automated steps of software devel-
opment pipelines, and represents an important imped-
iment to their adoption by practitioners.
5 CONCLUSIONS
We carried out a longitudinal exploratory case study
where three software quality models and manual
source code examination were used to study software
maintainability over the long-term. We report the re-
sults of our analysis that covered over 18 years of de-
velopment history for three complex, popular appli-
cations.
Our first conclusion, that we observed for all three
target applications is that maintainability can remain
independent of application size. While class count
and LOC generally increased throughout application
development, we noticed consistent refactoring ef-
forts that improved reported maintainability. Further-
more, we observed source code that was newly added
to latter versions to have very good maintainability,
helping to keep overall software quality high. Deter-
mining the reason for this is beyond the scope of our
research. However, we believe a well established ap-
plication architecture, or having experienced develop-
ers contribute to complex application versions might
contribute to this effect.
We also highlight the common development trend
of these open-source applications. Early versions are
susceptible to fluctuations in source code quality, as
well as metric values (Molnar. et al., 2019). Once
application architecture, in the form of package struc-
ture, used libraries and event handling mechanisms
are established, we find smaller fluctuations in subse-
quent versions. An important exception to this is rep-
Longitudinal Evaluation of Open-source Software Maintainability
129

resented by the existence of milestone versions, which
have a large variance in quality. These are character-
ized by the addition of many new features, which is
also apparent while using the application. In the case
of jEdit 4.0pre4 and TuxGuitar 1.0rc1, these are also
evident from version numbers. However, the opposite
is not true.
Regarding the quality models employed in our
case study, we believe each of the methods can be
useful in discovering maintainability changes. While
beyond the scope of our present paper, all three mod-
els can be used with finer granularity, at package and
class levels. Each model contributed insight regarding
the quality of the target applications, and we believe
that comprehensive analysis using several models is
useful in order to improve the characterization of soft-
ware quality.
We intend to expand our study to cover addi-
tional system types prevalent today, such as frame-
works, distributed applications or those targeting mo-
bile devices. We aim to further study system size
and complexity beyond line of code and class counts
in order to improve our understanding of its relation
with maintainability. In addition, we believe a cross-
sectional approach is also valuable, as it can improve
our baseline by facilitating the study of a larger num-
ber of target applications.
REFERENCES
ARISA Compendium, VizzMaintenance (2019). Technical
documentation of the VizzMaintenance metric extrac-
tion tool.
Arlt, S., Banerjee, I., Bertolini, C., Memon, A. M., and
Schaf, M. (2012). Grey-box gui testing: Efficient gen-
eration of event sequences. CoRR, abs/1205.4928.
Barkmann, H., Lincke, R., and L
¨
owe, W. (2009). Quanti-
tative evaluation of software quality metrics in open-
source projects. In 2009 International Conference on
Advanced Information Networking and Applications
Workshops, pages 1067–1072.
Caldiera, V. R. B. G. and Rombach, H. D. (1994). The Goal
Question Metric approach. Encyclopedia of software
engineering, pages 528–532.
Chidamber, S. and Kemerer, C. (1994). A Metric Suite for
Object- Oriented Design. IEEE Transactions on Soft-
ware Engineering, 20(6):476–493.
Cunningham, W. (1992). The wycash portfolio manage-
ment system. SIGPLAN OOPS Mess., 4(2):29–30.
Darcy, D. P. and Kemerer, C. F. (2005). Oo metrics in prac-
tice. IEEE Softw., 22(6):17–19.
DeMarco, T. (1982). Controlling Software Projects; Man-
agement, Measurement and Estimation. Yourdan
Press, New Jersey.
D
¨
ohmen, T., Bruntink, M., Ceolin, D., and Visser, J. (2016).
Towards a benchmark for the maintainability evolu-
tion of industrial software systems. 2016 Joint Con-
ference of the International Workshop on Software
Measurement and the International Conference on
Software Process and Product Measurement (IWSM-
MENSURA), pages 11–21.
Fowler, M. (2019). Technical debt. https://martinfowler.
com/bliki/TechnicalDebt.html.
Heitlager, I., Kuipers, T., and Visser, J. (2007). A practi-
cal model for measuring maintainability. In Quality of
Information and Communications Technology, 6th In-
ternational Conference on the Quality of Information
and Communications Technology, QUATIC 2007, Lis-
bon, Portugal, September 12-14, 2007, Proceedings,
pages 30–39.
Hynninen, T., Kasurinen, J., and Taipale, O. (2018). Frame-
work for observing the maintenance needs, runtime
metrics and the overall quality-in-use. Journal of Soft-
ware Engineering and Applications, 11:139–152.
ISO/IEC 25010 (2011). Software quality standards. http:
//www.iso.org.
Letouzey, J.-L. (2012). The sqale method for evaluating
technical debt. In Proceedings of the Third Interna-
tional Workshop on Managing Technical Debt, MTD
’12, pages 31–36. IEEE Press.
Li, W. and Henry, S. (1993). Maintenance metrics for the
object oriented paradigm. IEEE Proc. First Interna-
tional Software Metrics Symp, pages 52–60.
Lincke, R., Lundberg, J., and L
¨
owe, W. (2008). Comparing
software metrics tools. In Proceedings of the 2008 in-
ternational symposium on Software testing and anal-
ysis - ISSTA ’08.
Marinescu, R. (2002). Measurement and Quality in Object
Oriented Design. PhD thesis, Faculty of Automatics
and Computer Science, University of Timisoara.
Metrics library, N. (2019). https://github.com/etishor/
Metrics.NET.
Microsoft VS Docs (2020). https://docs.microsoft.com/
en-us/visualstudio/code-quality/code-metrics-values.
Molnar, A. and Motogna, S. (2017). Discovering maintain-
ability changes in large software systems. In Proceed-
ings of the 27th International Workshop on Software
Measurement and 12th International Conference on
Software Process and Product Measurement, IWSM
Mensura ’17, pages 88–93, New York, NY, USA.
ACM.
Molnar., A., Neamt¸u., A., and Motogna., S. (2019). Lon-
gitudinal evaluation of software quality metrics in
open-source applications. In Proceedings of the
14th International Conference on Evaluation of Novel
Approaches to Software Engineering - Volume 1:
ENASE,, pages 80–91. INSTICC, SciTePress.
Naboulsi, Z. (2011). Maintainability Index in
Microsoft Visual Studio. https://blogs.
msdn.microsoft.com/zainnab/2011/05/26/
code-metrics-maintainability-index/.
Oman, P. and Hagemeister, J. (1992). Metrics for as-
sessing a software system’s maintainability. In Pro-
ceedings Conference on Software Maintenance 1992,
pages 337–344.
R. Lincke, W. Lowe (2019). Compendium of Software
Quality Standards and Metrics.
ENASE 2020 - 15th International Conference on Evaluation of Novel Approaches to Software Engineering
130

Runeson, P. and H
¨
ost, M. (2009). Guidelines for conduct-
ing and reporting case study research in software en-
gineering. Empirical Software Engineering.
Sham, N., Bakar, A. A., and Boughton, C. V. (2012). Vali-
dation of Measurement Tools to Extract Metrics from
Open Source Projects.
SonarSource (2019). Sonarqube. https://www.sonarqube.
org.
T Hynninen, J Kasurinen, O. T. (2018). Framework for ob-
serving the maintenance needs, runtime metrics and
the overall quality-in-use. Journal of Software Engi-
neering and Applications, 11 (04):139–152.
van Deursen, A. (2014). Think twice
before using the maintainability in-
dex. https://avandeursen.com/2014/08/29/
think-twice-before-using-the-maintainability-index/.
Virtual Machinery (2019). Discussion on measuring the
maintanability index. http://www.virtualmachinery.
com/sidebar4.htm.
Welker, K. (2001). Software maintainability index revisited.
Journal of Defense Software Engineering, none.
Yuan, X. and Memon, A. M. (2010). Generating event
sequence-based test cases using GUI run-time state
feedback. IEEE Transactions on Software Engineer-
ing, 36(1).
Longitudinal Evaluation of Open-source Software Maintainability
131
