
Predicting User Satisfaction in Software Projects using Machine
Learning Techniques
Łukasz Radli
´
nski
a
Faculty of Computer Science and Information Technology, West Pomeranian University of Technology in Szczecin,
˙
Keywords:
User Satisfaction, Software Projects, Prediction Models, Machine Learning, ISBSG.
Abstract:
User satisfaction is an important aspect of software quality. Factors of user satisfaction and its impact on
project success were analysed in various studies. However, very few studies investigated the ability to predict
user satisfaction. This paper presents results of such challenge. The analysis was performed with the ISBSG
dataset of software projects. The target variable, satisfaction score, was defined as a sum of eight variables
reflecting different aspects of user satisfaction. Twelve machine learning algorithms were used to build 40
predictive models. Each model was evaluated on 20 passes with a test subset. On average, a random forest
model with missing data imputation by mode and mean achieved the best performance with the macro mean
absolute error of 1.88. Four variables with the highest importance on predictions for this model are: survey
respondent role, log(effort estimate), log(summary work effort), and proportion of major defects. On average
14 models performed worse than a simple baseline model. While best performing models deliver predictions
with satisfactory accuracy, high variability of performance between different model variants was observed.
Thus, a careful selection of model settings is required when attempting to use such model in practise.
1 INTRODUCTION
Project success is typically evaluated in the main three
dimensions: time and budget for process performance
and requirements for product performance. However,
more and more often management approaches high-
light the criticality of stakeholder satisfaction (Dieg-
mann et al., 2017). The ISO/IEC 25010:2011 stan-
dard defined satisfaction as a ”degree to which user
needs are satisfied when a product or system is used
in a specified context of use” (ISO/IEC, 2011).
Numerous studies investigated factors influencing
user satisfaction in a software project. The impor-
tance of user satisfaction was confirmed by an empir-
ical analysis in a study (Bano et al., 2017) which con-
cluded that user satisfaction significantly contributes
to the system success even when schedule and budget
goals are not met. Recently published results from a
systematic literature review show that one of the main
factors that affects customer satisfaction is related to
the application of agile development methodologies
due to their deep involvement of the customer in the
development process (Amirova et al., 2019).
Some authors claim that user satisfaction is mea-
a
https://orcid.org/0000-0003-1007-6597
surable but not predictable (Jones, 2008, p. 456). Low
number of empirical studies on this problem partially
confirms this claim. Furthermore, as discussed in Sec-
tion 2, existing literature reveals the difficulty of pre-
dicting user satisfaction with the acceptable accuracy.
Still, it shows that there is a potential for taking up
with this challenge. This paper investigates the fol-
lowing five research questions (RQ):
1. What accuracy of predictions can be achieved by
different models?
2. What are the ranks of each prediction model?
3. What accuracy of predictions can be achieved by
model variants for each prediction technique?
4. How accurate are predictions from the best per-
forming model?
5. Which attributes (predictors) are the most impor-
tant for the best performing model?
This study used the extended edition of the ISBSG
R11 dataset of software projects (ISBSG, 2009). This
extended dataset contains additional attributes de-
scribing software development process and, most im-
portantly, eight attributes reflecting user satisfaction.
For the needs of this study these eight attributes were
aggregated into a single target variable as explained
374
Radli
´
nski, Ł.
Predicting User Satisfaction in Software Projects using Machine Learning Techniques.
DOI: 10.5220/0009391803740381
In Proceedings of the 15th International Conference on Evaluation of Novel Approaches to Software Engineering (ENASE 2020), pages 374-381
ISBN: 978-989-758-421-3
Copyright
c
2020 by SCITEPRESS – Science and Technology Publications, Lda. All rights reserved

in Section 3. Twelve machine learning techniques
were used to predict this aggregated user satisfaction.
For most techniques several variants were built that
involved various combinations of the following: dif-
ferent type of dataset used for learning, missing value
imputation technique, data normalization, and appli-
cation of feature selection technique.
This paper makes the following contributions to
the applied science and practice: It evaluates a range
of predictive models and provides their ranking for
predicting the aggregated user satisfaction in software
projects. It also provides results from a deeper analy-
sis of performance of the most accurate model.
The paper is organized as follows: Section 2 dis-
cusses related work. Section 3 explains the data and
research method used in this study. Section 4 presents
obtained results by providing answers to each re-
search question. Section 5 discusses limitations and
threats to validity of results. Section 6 formulates
conclusions and ideas for future work.
2 RELATED WORK
There are two earlier studies which scope is the clos-
est to the current study, i.e. they also involved pre-
dicting user satisfaction with machine learning tech-
niques and using ISBSG dataset. The first of them
(Radli
´
nski, 2015) was focused on predicting one at-
tribute of user satisfaction, i.e., ability of system to
meet stated objectives. The values of that target
variable were transformed to binary values reflect-
ing whether satisfaction in this aspect was achieved
or not. As a result, the prediction task was a binary
classification. A total of 288 prediction schemes, i.e.
model variants, were evaluated in the ability to pre-
dict the target variable. These schemes were built as
combinations of their components, i.e. attribute pre-
selection, elimination of missing values, automated
attribute selection, and a classifier. Two best perform-
ing schemes based on LMT and SimpleLogistic clas-
sifiers achieved the accuracy measured as Matthews
correlation coefficient of 0.71 in the test subset.
The second study (Radli
´
nski, 2018) was at a sig-
nificantly larger scale as it involved building, evaluat-
ing and comparing 15,600 prediction schemes. Each
scheme was built as a combination of its components:
manual attribute pre-selection, handling missing val-
ues, outlier elimination, value normalization, auto-
mated attribute selection, and a classifier. That study
also involved a binary classification task. However,
the target variable was an aggregated user satisfac-
tion, i.e., a mean of eight satisfaction variables sub-
sequently dichotomized to a logical variable. The
research procedure involved training and evaluation
of each prediction scheme using a 10-fold cross-
validation and a separate testing, both repeated 10
times. For best performing schemes achieved level
of accuracy expressed by Matthews correlation coef-
ficient was about 0.5 in the cross-validation and about
0.5–0.6 in the testing stage.
The scope of other studies involving user satisfac-
tion was different compared to the current one. For
example, a study (Fenton et al., 2004) was focused
mainly on predicting development resources. Devel-
oped model also was able to predict user satisfaction.
However, that study did not report achieved accuracy
predictions. A study (Cerpa et al., 2016) compared
various schemes to predict project outcome, i.e., ‘suc-
cess’ or ‘failure’. The authors found that attribute se-
lection using information gain score improved accu-
racy, statistical and ensemble classifiers were robust
for predicting project outcome, and on average ran-
dom forest provided the most accurate predictions.
A range of studies (Bano et al., 2017; Buchan
et al., 2017; Cartaxo et al., 2013; Montesdioca and
Mac¸ada, 2015; Raza et al., 2010; Subramanyam et al.,
2010; Tarafdar et al., 2010) involved empirical anal-
yses of gathered data to investigate the relationships
between user satisfaction and other factors describ-
ing software development projects and processes. Be-
cause the focus of the current study is on predicting
user satisfaction the results from these analytical stud-
ies were not further investigated here.
3 DATA AND METHOD
This study used the extended version of the ISBSG
dataset (ISBSG, 2009) of software projects which are
described by the attributes reflecting their type, size,
duration, development activities involved, environ-
mental factors, objectives, and documents and tech-
niques used. This extended version contains 205 at-
tributes. Eight of them reflect user satisfaction with:
• the ability of system to meet stated objectives,
• the ability of system to meet business require-
ments,
• the quality of the functionality provided,
• the quality of the documentation provided,
• the ease of use,
• the training given,
• the speed of defining solution,
• the speed of providing solution.
Predicting User Satisfaction in Software Projects using Machine Learning Techniques
375
They are defined at the 4-point ranked scale where ’1’
indicates that user needs were met to a limited extent
or not at all and ’4’ indicates that user expectations
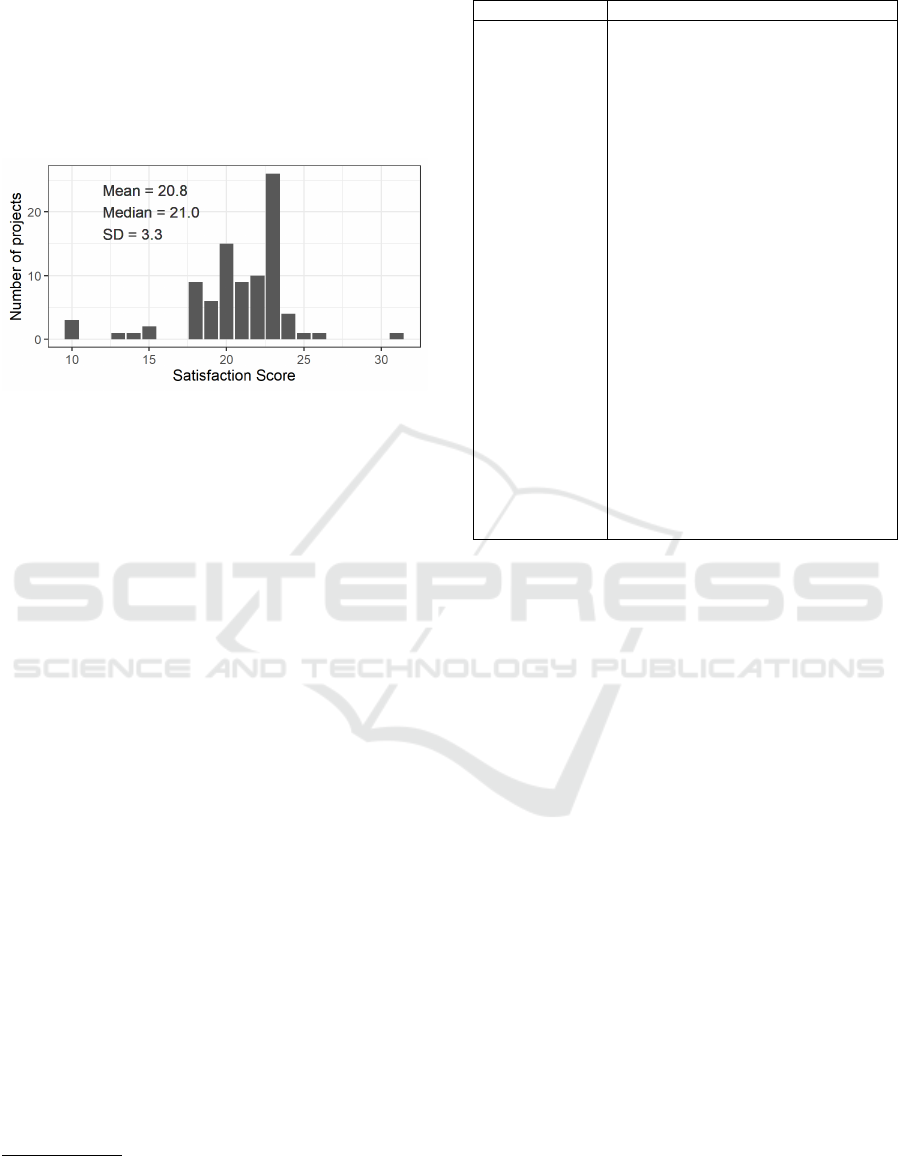
were exceeded. The target variable for prediction, i.e.
satisfaction score, was defined as the sum of values of
these eight individual attributes. Figure 1 illustrates
the distribution of satisfaction score.
Figure 1: Distribution of Satisfaction Score.
Preparation of the dataset involved actions on clean-
ing the data, correcting obvious mistakes in data
values, changing data types, creating new attributes
from multiple response nominal attributes or as log-
transformations of highly skewed numeric attributes,
removing attributes with fraction of missing values
exceeding 0.6, removing attributes with problems
limiting their usability (e.g. a single value, many val-
ues but with low counts, unclear interpretation, incon-
sistent values when compared to other attributes, not
applicable as predictors). Due to limited space it is
beyond the scope of this paper to discuss the details
of this data preprocessing. Additional on-line mate-
rials document all preparation actions, model learn-
ing and generating predictions
1
. The dataset was fil-
tered by data quality rating attribute and, more im-
portantly, only cases with eight satisfaction attributes
with non-missing values were kept. After this filtering
the dataset contained 89 cases.
The experimental analysis was performed using R
language
2
and the caret package
3
. Table 1 lists tech-
niques used to build predictive models. These tech-
niques were selected because they were widely used
in similar studies. The abbreviation for each tech-
nique indicates the name of the model implementa-
tion in the caret package. For comparison, a baseline
model was also used. Because the satisfaction score is
an integer number the implementations of each tech-
nique were adjusted so that they provided predictions
rounded to the nearest integer.
1
https://doi.org/10.5281/zenodo.3685484
2
https://www.R-project.org/
3
https://cran.r-project.org/package=caret
Table 1: Summary of Prediction Techniques.
Abbr. / Library Technique & Ref.
baselineMean null model predicting mean value
enet elastic net (Zou and Hastie, 2005)
gbm generalized boosted regression
(Friedman, 2001)
glmnet generalized linear regression with
convex penalties (Friedman et al.,
2010)
glmStepAIC generalized linear regression with
stepwise feature selection (Venables
and Ripley, 2002)
knn k-nearest neighbour regression (Alt-
man, 1992)
lm linear regression (Wilkinson and
Rogers, 1973)
lmStepAIC linear regression model with step-
wise feature selection (Venables and
Ripley, 2002)
M5 model trees and rule learner (Wang
and Witten, 1997; Witten et al., 2011)
ranger random forest (Breiman, 2001)
rpart2 recursive partitioning and regression
tree (Breiman et al., 1984)
svm support vector machines (Chang and
Lin, 2007)
xgbTree extreme gradient boosting (Chen and
Guestrin, 2016)
For each technique one or more models were created,
depending on the applicability of particular variant to
given technique. A total of 41 variants were used (see
Section 4.3). These models differed in:
• a dataset version used: regular including logical
and nominal attributes, or numeric with all logical
and nominal attributes transformed to numeric, as
required by some techniques,
• missing value imputation technique: none, by
mean (for numeric attributes), or mode (for non-
numeric attributes),
• numeric values normalization (only for numeric
version of a dataset) or no such pre-processing,
• attribute selection: none (then all available at-
tributes were used) or by principal component
analysis (PCA) with minimum fraction of cap-
tured variance of 0.85.
The experimental part involving model training and
evaluation was performed in the following way. The
dataset was divided into a cross-validation (CV) and
test subsets with randomly selected 79 and 10 cases,
respectively. The CV subset was used to train and
tune the model by selecting the best hyperparameters.
We used M × N-way CV, i.e., with N = 5 folds and re-
peated M = 3 times. Then the final model was trained
using the whole CV subset and evaluated with the re-
maining test subset. This procedure ensured that the
ENASE 2020 - 15th International Conference on Evaluation of Novel Approaches to Software Engineering
376

evaluation of the final model was performed on an in-
dependent subset of data that was not used in CV for
model tuning. This process was repeated 20 times
with different random data splits in each pass.
Random and exhaustive grid search (Bergstra and
Bengio, 2012) are popular strategies of hyperparame-
ter selection. In this study, a large number of hyperpa-
rameter combinations were defined for some models.
Thus, considering the time-efficiency, a stepwise grid
search strategy was applied. It starts with a random
search and iteratively adapts the best performing hy-
perparameter sets until no improvement is achieved
4
.
To evaluate the accuracy of predictions a mean ab-
solute error (MAE) was used. This measure is pre-
ferred over mean relative error used in some studies
(Shepperd and MacDonell, 2012).
4 RESULTS
4.1 RQ1: What Accuracy of Predictions
Can Be Achieved by Different
Models?
To answer this RQ the distribution of MAE across
passes for each model was investigated (Figure 2).
The blue diamonds on this and subsequent figure in-
dicate the macro mean across all passes, i.e., the mean
of MAE (MMAE). On average, models using ranger,
xgbTree and svm techniques performed the best. The
ranger model involving a regular dataset and using
missing value imputation by mode and mean reached
the highest accuracy with mean MMAE = 1.88.
The baselineMean model reached the MMAE =
2.36. On average, some variants of xgbTree per-
formed only slightly better and 14 models performed
worse than the baselineMean. However, for all of
them at least one variant based on particular tech-
nique performed better than this baselineMean model.
The two worst performing models were based on the
lmStepAIC and reached the MMAE = 5.53, signifi-
cantly worse than all other models.
4.2 RQ2: What Are the Ranks of Each
Prediction Model?
Apart from comparing models based on values of
MAE we also investigated model ranks. Each model’s
4
Due to limited space, an overview of this algorithm and
initial ranges/sets of values for hyperparameters were pro-
vided on-line at https://doi.org/10.5281/zenodo.3685484.
MAE was compared to MAE of all other models, sep-
arately in each pass, to calculate model ranks. The
distributions of these ranks are shown in Figure 3
where the models were sorted by the mean rank which
exact values are provided in Table 2.
Three models based on ranger achieved the best,
i.e. the lowest, mean ranks of 6.95, 8.50, and 9.15,
respectively. They were followed by some variants
of svm, xgbTree and ranger and all three variants of
enet. The baselineMean reached a mean rank of 22.55
which was superior to 13 other models.
We can observe high variability of ranks across
passes. Except for two lmStepAIC that consistently
performed the worst, three ranger models with top
mean ranks also achieved lowest range of these ranks.
However, even they performed quite poor in some
passes with worst ranks of 18, 19, and 26. A total
of 19 models in at least one pass reached the top rank
or at least tied for it – these for which the left-side
whisker starts at rank 1 in Figure 3.
4.3 RQ3: What Accuracy of Predictions
Can be Achieved by Model Variants
for Each Prediction Technique?
To answer this RQ a comparison of mean ranks of all
models grouped by variants of settings for each pre-
diction techniques was performed. Table 2 illustrates
these mean ranks. Techniques were sorted by the best
mean rank for each technique. Cells with no value
provided indicate that a particular model variant was
not defined. This was caused by the following rea-
sons: some techniques need only numeric version of
the dataset, only xgbTree could work with missing
values, for standard lm the dataset must have more
cases than attributes (thus PCA was applied), and for
baselineMean there was no need to use other model
variants as they would provide the same predictions.
For each technique there was at least one model
variant which performed better than baselineMean.
However, there are no common variant settings which
would perform the best for each technique. For exam-
ple, for ranger, glmStepAIC and rpart2 the best ranks
were achieved using a regular dataset, with missing
values replaced with mode and median. However,
for most techniques, i.e., svm, enet, knn, ln, gbm,
and M5 the best ranks were achieved using numeric
dataset, with missing values replaced by median, with
normalization of values and with attribute selection
using PCA. Most notably, xgbTree, which was the
only model that could be trained with missing values,
achieved the best performance in the variant without
missing value imputation applied.
Predicting User Satisfaction in Software Projects using Machine Learning Techniques
377
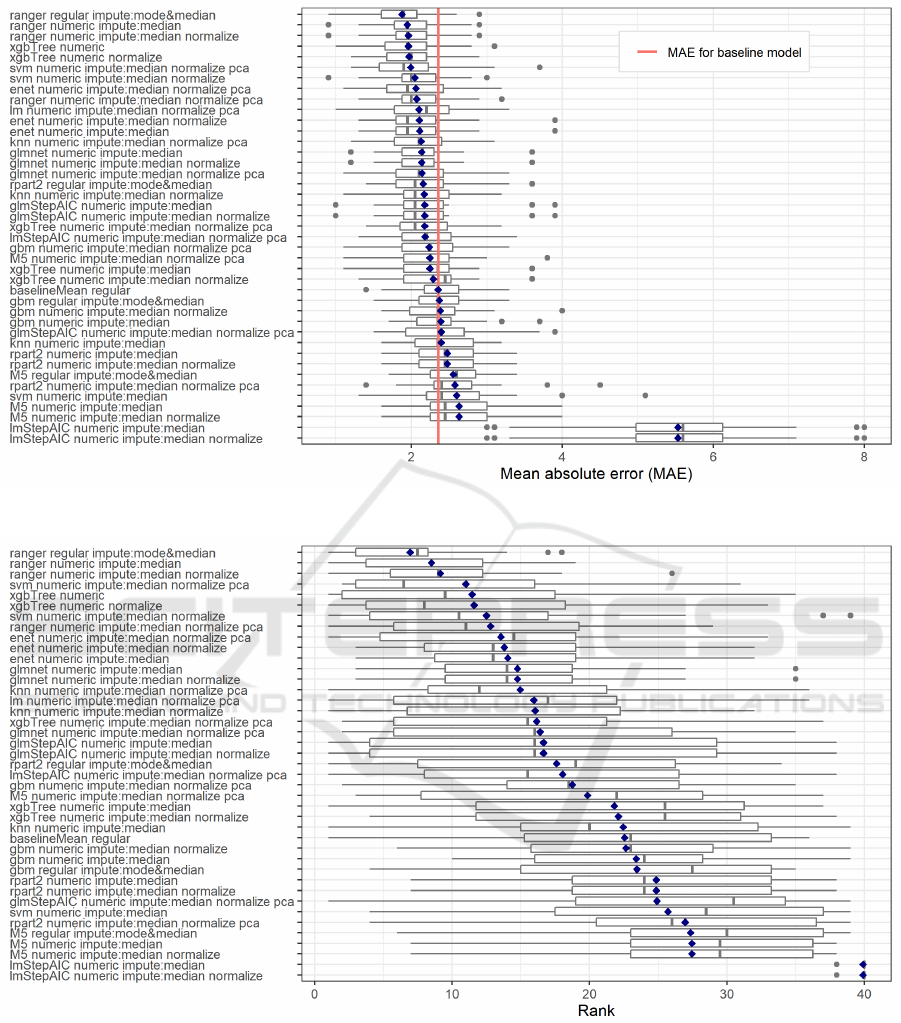
Figure 2: Distribution of Mean Absolute Error across Passes for Each Model Variant.
Figure 3: Distribution of Ranks across Passes for Each Model Variant.
4.4 RQ4: How Accurate Are the
Predictions from the Best
Performing Model?
Previous RQs showed that a ranger model using a reg-
ular dataset and missing value imputation by mode
and median performed the best. This subsection in-
vestigates deeper predictions from this single model.
Figure 4 illustrates the actual vs predicted values of
satisfaction score in all passes for the test subsets.
The ideal predictor, to achieve a perfect accuracy
with MAE = 0, would give predictions which would
be plotted on the diagonal dashed line. While this
ranger model provided the most accurate predictions
we can observe some issues. Some points on the fig-
ENASE 2020 - 15th International Conference on Evaluation of Novel Approaches to Software Engineering
378
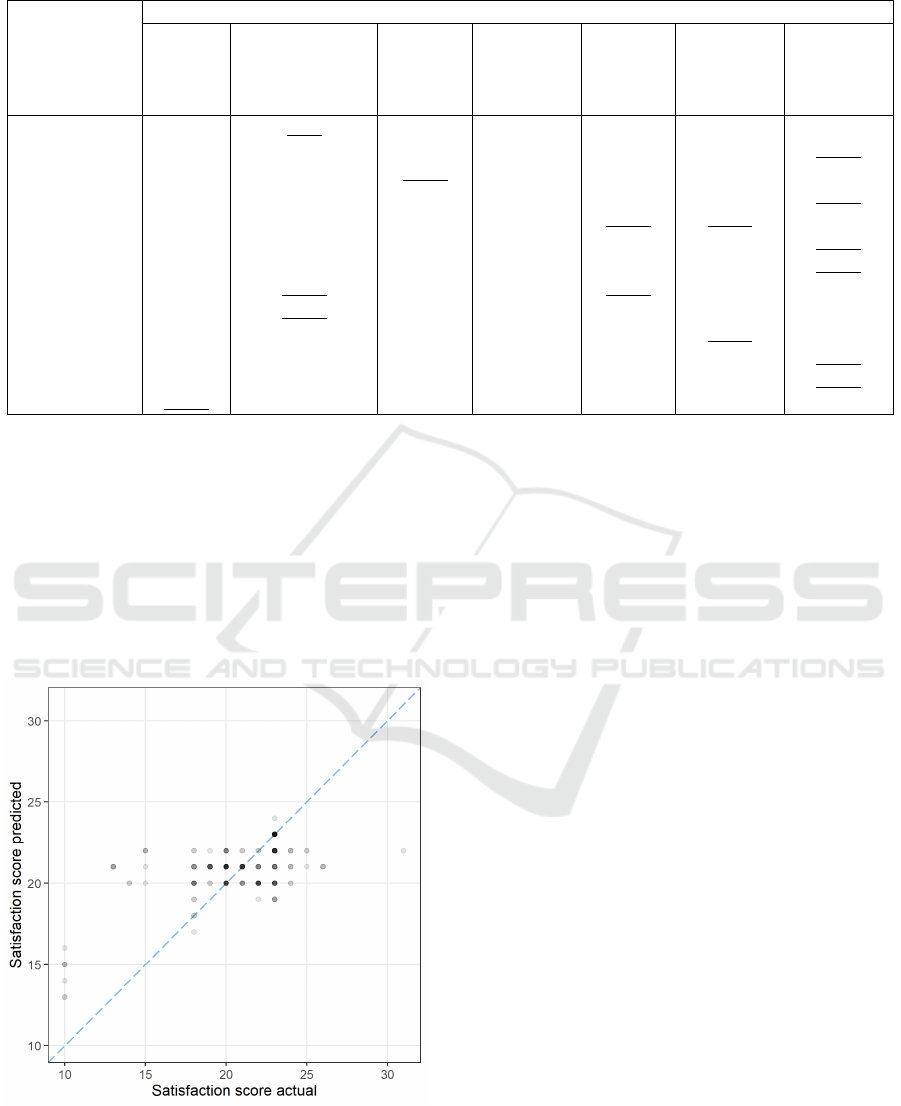
Table 2: Mean Ranks of Model Variants across Passes (Best Performing Variants for Each Technique Are Underlined).
Technique
Settings
Regular Regular
Mode&Median
Numeric Numeric
Normalize
Numeric
Median
Numeric
Median
Normalize
Numeric
Median
Normalize
PCA
ranger 6.95 8.50 9.15 12.80
svm 25.70 12.50 11.00
xgbTree 11.45 11.60 21.80 22.1 16.15
enet 14.05 13.80 13.55
glmnet 14.75 14.75 16.40
knn 22.45 16.05 14.95
lm 15.95
glmStepAIC 16.65 16.65 24.90
rpart2 17.60 24.85 24.85 26.95
lmStepAIC 39.90 39.90 18.05
gbm 23.45 23.40 22.65 18.75
M5 27.35 27.45 27.45 19.85
baselineMean 22.55
ure deviate from this perfect prediction line, mostly
for projects with extreme values of satisfaction score,
i.e. ≤ 15 (7 cases) or ≥ 26 (2 cases).
The second issue is related to the range of pre-
dicted values. While the actual values are in the inter-
val [10..31], the predicted values are in the narrower
interval [13..24]. This shows that even though this
ranger model on average performed the best, it faced
problems with predicting particular cases.
Figure 4: Scatterplot of Actual Vs Predicted Satisfaction
Score by Most Accurate Model.
4.5 RQ5: Which Attributes Are the
Most Important for the Best
Performing Model?
To answer this RQ the importance of each attribute
was evaluated. In each pass a different ranger model
was built, i.e., using different CV subset. For each at-
tribute its importance was calculated as impurity, the
variance of the responses, that was scaled to an inter-
val [0, 100]. Figure 5 illustrates the distribution of this
attribute importance across all passes for the top 20
attributes with the highest mean importance.
On average, the survey respondent role was the
most important. It was followed by effort estimate,
summary work effort (both log-transformed) and pro-
portion of major defects. The top seven attributes
achieved the importance of 100 in at least one pass.
Among the attributes describing project environ-
ment the most important were project manager expe-
rience and selected development techniques, decision
making process, and intended market.
Surprisingly, only two attributes related to defects,
proportion of major defects and proportion of minor
defects, appeared as important when predicting sat-
isfaction score with this ranger model. The dataset
contained also other attributes related to defects, e.g.
defect rate, total # defects, proportion of extreme de-
fects as well as counts for extreme, major and minor
defects, that appeared with lower importance. Among
them the most important was log-transformed defect
rate with mean importance of 17.3 (at rank 39 of 100).
Predicting User Satisfaction in Software Projects using Machine Learning Techniques
379
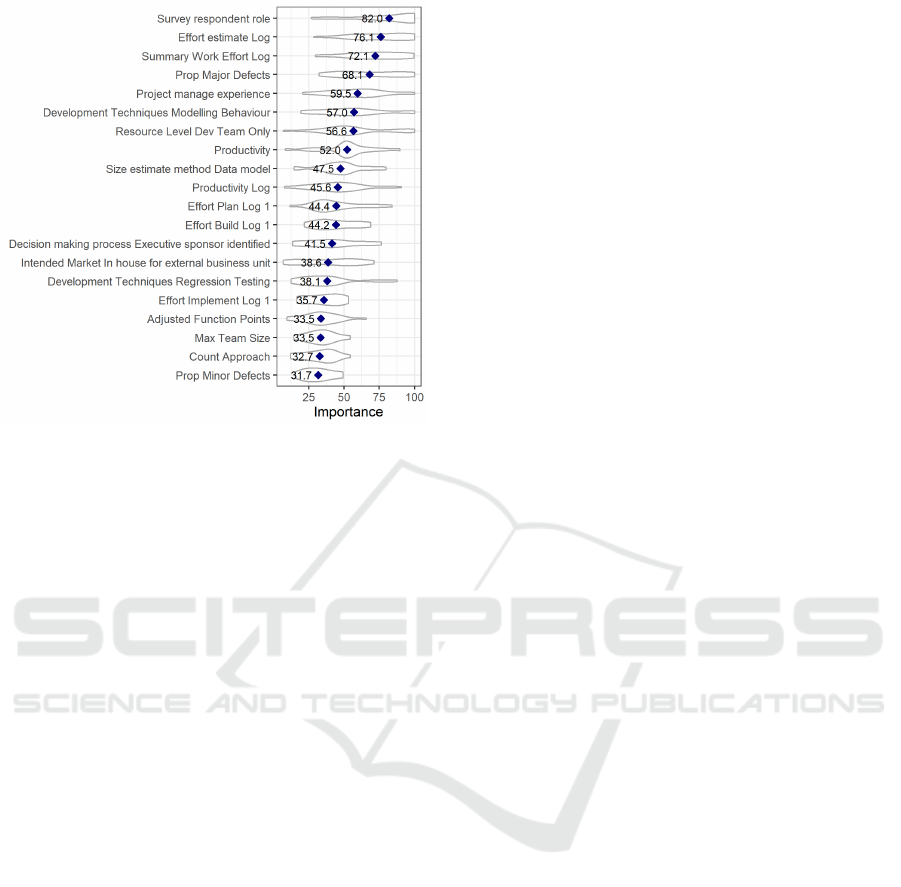
Figure 5: Distribution of Attribute Importance for the Most
Accurate Model.
5 LIMITATIONS AND THREATS
TO VALIDITY
Results from this study are subject to some limitations
and threats to validity. The first of them is related
to the fact that only one dataset was used. Accord-
ing to authors’ knowledge, among the publicly avail-
able datasets only the extended version of the ISBSG
dataset contains attributes on user satisfaction. Hence,
no comparison with other datasets was possible. Also,
this is the first study on user satisfaction prediction
where the target variable is numeric. Thus, the MAE
was used to evaluate the model performance, not mea-
sures applicable for classification problems as in other
studies. Hence, results obtained in this study are not
comparable with results in other studies even if they
used the same ISBSG dataset.
Second, the study used a subset of the data con-
taining 89 cases of 5024 before filtering. Such strong
reduction was caused mostly by the low number of
projects with non-missing values for user satisfaction.
Because the dataset is not a random sample from pop-
ulation and the above issues, obtained results cannot
be generalized outside the context of this dataset.
Furthermore, subjective decisions were made
when designing the experiment, e.g. on selection of
prediction techniques, model settings, data prepro-
cessing. To partially reduce this problem, this was
performed as in similar studies investigating various
software quality prediction problems and with subjec-
tivity as limited as possible.
The target variable is an aggregation of eight in-
dividual attributes of user satisfaction. Each of them
was assigned the same weight when calculating satis-
faction score. In certain projects the real importance
might have been unequal but such information was
not available in the dataset.
6 CONCLUSIONS AND FUTURE
WORK
This study was focused on predicting aggregated user
satisfaction, i.e. satisfaction score using the extended
ISBSG dataset. It provided answers to five research
questions in this matter. Based on obtained results it
can be found that it is possible to predict satisfaction
score with satisfactory accuracy. The best perform-
ing ranger (random forest) model delivered predic-
tions with MMAE = 1.88 and achieved a mean rank
of 6.95 across all passes.
Four attributes with the highest importance on pre-
dictions for this model were: survey respondent role,
log(effort estimate), log(summary work effort), and
proportion of major defects. Only two attributes re-
ferring to defects were found among the top-20 most
important for that model.
Apart from this ranger model, two other best per-
forming techniques were xgbTree and svm. How-
ever, some models performed poorly, i.e., on aver-
age 14 models performed worse than a simple base-
line model when comparing MMAE and 13 models
when comparing models’ mean ranks. Despite this,
for each prediction technique there was at least one
model variant which achieved better mean rank than
a baselineMean model.
Achieved results may be extended in the future re-
search in various ways. First, other types of prediction
models may be used. This includes e.g. neural net-
works and more complex ensemble models that can
be built as a combinations of base models and which
in various studies perform superior to other simpler
machine learning models such as those investigated in
this paper. Second, partial analyses started or reported
in this study may be enhanced and completed. This
includes the analysis of importance of various predic-
tors. In this paper this was performed only for the
most accurate model but it can be extended to aggre-
gate importance across a range of used models. This
also includes analysis of performance of the hyper-
parameter tuning method. Such analysis would incor-
porate investigation of influence of method’s input pa-
rameters and comparison with other methods of tun-
ing hyperparameters.
ENASE 2020 - 15th International Conference on Evaluation of Novel Approaches to Software Engineering
380

REFERENCES
Altman, N. S. (1992). An Introduction to Kernel and
Nearest-Neighbor Nonparametric Regression. The
American Statistician, 46(3):175–185.
Amirova, R., Khomyakov, I., Mirgalimova, R., and Sil-
litti, A. (2019). Software Development and Cus-
tomer Satisfaction: A Systematic Literature Review.
In Mazzara, M., Bruel, J., Meyer, B., and Petrenko,
A., editors, Software Technology: Methods and Tools.
TOOLS 2019, pages 136–149. Springer, Cham.
Bano, M., Zowghi, D., and da Rimini, F. (2017). User satis-
faction and system success: an empirical exploration
of user involvement in software development. Empir-
ical Software Engineering, 22(5):2339–2372.
Bergstra, J. and Bengio, Y. (2012). Random search for
hyper-parameter optimization. Journal of Machine
Learning Research, 13(1):281–305.
Breiman, L. (2001). Random Forests. Machine Learning,
45(1):5–32.
Breiman, L., Friedman, J., Stone, C. J., and Olshen, R.
(1984). Classification and Regression Trees. Chap-
man & Hall, Boca Raton.
Buchan, J., Bano, M., Zowghi, D., MacDonell, S., and
Shinde, A. (2017). Alignment of Stakeholder Expec-
tations about User Involvement in Agile Software De-
velopment. In Proceedings of the 21st International
Conference on Evaluation and Assessment in Software
Engineering - EASE’17, pages 334–343, New York,
New York, USA. ACM Press.
Cartaxo, B., Araujo, A., Barreto, A. S., and Soares, S.
(2013). The Impact of Scrum on Customer Satisfac-
tion: An Empirical Study. In 2013 27th Brazilian
Symposium on Software Engineering, pages 129–136.
IEEE.
Cerpa, N., Bardeen, M., Astudillo, C. A., and Verner, J.
(2016). Evaluating different families of prediction
methods for estimating software project outcomes.
Journal of Systems and Software, 112:48–64.
Chang, C.-C. and Lin, C.-J. (2007). LIBSVM: A library
for support vector machines. ACM Transactions on
Intelligent Systems and Technology, 2(3).
Chen, T. and Guestrin, C. (2016). XGBoost: A Scalable
Tree Boosting System. In Proceedings of the 22nd
ACM SIGKDD International Conference on Knowl-
edge Discovery and Data Mining - KDD ’16, pages
785–794, New York. ACM Press.
Diegmann, P., Basten, D., and Pankratz, O. (2017). In-
fluence of Communication on Client Satisfaction in
Information System Projects: A Quantitative Field
Study. Project Management Journal, 48(1):81–99.
Fenton, N., Marsh, W., Neil, M., Cates, P., Forey, S., and
Tailor, M. (2004). Making Resource Decisions for
Software Projects. In Proceedings of the 26th Inter-
national Conference on Software Engineering, pages
397–406, Washington, DC. IEEE Computer Society.
Friedman, J., Hastie, T., and Tibshirani, R. (2010). Reg-
ularization Paths for Generalized Linear Models via
Coordinate Descent. Journal of Statistical Software,
33(1).
Friedman, J. H. (2001). Greedy function approximation: A
gradient boosting machine. The Annals of Statistics,
29(5):1189–1232.
ISBSG (2009). ISBSG Repository Data Release 11. Inter-
national Software Benchmarking Standards Group.
ISO/IEC (2011). Software engineering – Software prod-
uct Quality Requirements and Evaluation (SQuaRE) –
System and software quality models, volume ISO/IEC
25010:2011(E).
Jones, C. (2008). Applied Software Measurement: Global
Analysis of Productivity and Quality. McGraw-Hill
Education, 3rd edition.
Montesdioca, G. P. Z. and Mac¸ada, A. C. G. (2015).
Measuring user satisfaction with information security
practices. Computers & Security, 48:267–280.
Radli
´
nski, Ł. (2015). Preliminary evaluation of schemes for
predicting user satisfaction with the ability of system
to meet stated objectives. Journal of Theoretical and
Applied Computer Science, 9(2):32–50.
Radli
´
nski, Ł. (2018). Predicting Aggregated User Satisfac-
tion in Software Projects. Foundations of Computing
and Decision Sciences, 43(4):335–357.
Raza, A., Capretz, L. F., and Ahmed, F. (2010). Improve-
ment of Open Source Software Usability: An Em-
pirical Evaluation from Developers’ Perspective. Ad-
vances in Software Engineering, 2010:1–12.
Shepperd, M. and MacDonell, S. (2012). Evaluating pre-
diction systems in software project estimation. Infor-
mation and Software Technology, 54(8):820–827.
Subramanyam, R., Weisstein, F. L., and Krishnan, M. S.
(2010). User participation in software development
projects. Communications of the ACM, 53(3):137–
141.
Tarafdar, M., Tu, Q., and Ragu-Nathan, T. S. (2010). Impact
of Technostress on End-User Satisfaction and Perfor-
mance. Journal of Management Information Systems,
27(3):303–334.
Venables, W. N. and Ripley, B. D. (2002). Modern Applied
Statistics with S. Statistics and Computing. Springer,
New York, NY, 4th edition.
Wang, Y. and Witten, I. H. (1997). Induction of model trees
for predicting continuous classes. In Proceedings
of the Poster Papers of the European Conference on
Machine Learning, Prague. University of Economics,
Faculty of Informatics and Statistics.
Wilkinson, G. N. and Rogers, C. E. (1973). Symbolic De-
scription of Factorial Models for Analysis of Variance.
Applied Statistics, 22(3):392.
Witten, I., Frank, E., and Hall, M. (2011). Data Mining:
Practical Machine Learning Tools and Techniques.
Elsevier, 3rd edition.
Zou, H. and Hastie, T. (2005). Regularization and variable
selection via the elastic net. Journal of the Royal Sta-
tistical Society: Series B (Statistical Methodology),
67(2):301–320.
Predicting User Satisfaction in Software Projects using Machine Learning Techniques
381
