
Users’ Learning Pathways on Cross-site Open Educational Resources
Ays¸e Saliha Sunar
1,2 a
, Erik Novak
2 b
and Dunja Mladeni
´
c
2 c
1
Bitlis Eren University, Rahva Yerleskesi, Bitlis, Turkey
2
Jozef Stefan Institute, Ljubljana, Slovenia
Keywords:
OER, Clustering, Learning Analytics, Learning Pathways, Cross-site Analysis, Cross-domain Analysis.
Abstract:
The availability of open educational resources is growing at an increasingly fast pace since its first promotion
by UNESCO in 2002. Today, large variability of opportunities for free and online educational resources are
available and accessible by everyone from all around the world who has access to the Internet. An Internet
user may exploit numbers of different platforms to find what they are looking for, where one platform may
fit their study goal while another platform suits their learning approach. Finding the appropriate content and
platform could be like searching for a needle in the haystack where users desperately need help from per-
sonalised recommendations. Many platforms aim to transform to a more personalised learning environment,
mostly by recommending a content or a peer to study with, providing timely feedback, or a gamified learn-
ing environment within the platform. We expect that in the next decade it will be necessary to provide user
guidance to the Open Educational Resources not only in a single domain but in cross-domain, cross-site, and
cross-cultural nature of the Internet. In this paper, we investigate the users’ learning behaviour by analysing
their clickstream data across different learning platforms. The results indicate that most of the users tend to
stay on a website for a short duration. Also, the design of materials on different websites affect the number of
clicks and the pattern of engagement.
1 INTRODUCTION
As defined by the Hewlett Foundation
1
, ”Open Ed-
ucational Resources (OERs) are teaching, learning
and research materials in any medium - digital or oth-
erwise - that reside in the public domain or have been
released under an open license that permits no-cost
access, use, adaptation and redistribution by others
with no or limited restrictions.”
These materials are associated with the so-called
5R
2
, which describes the actions that can be per-
formed with open content: retain, reuse, revise,
remix, and redistribute. All of these actions enable
the users to freely access the materials, modify them
and use them for their own purposes. Due to these
actions, the OERs are becoming increasingly popular
in the educational sector as it provides a number of
advantages, which are:
a
https://orcid.org/0000-0002-0836-5616
b
https://orcid.org/0000-0002-7010-314X
c
https://orcid.org/0000-0002-0360-6505
1
https://hewlett.org/strategy/open-educational-resources/
2
http://opencontent.org/definition/
• Enable the users to access the materials anywhere
and at anytime;
• Allow the users to modify the materials for their
own purposes, extracting only the content that is
relevant to them;
• Can be used to support different learning ap-
proaches;
• Are available online, therefore, it is quicker to be
published than in a textbook format;
• Provide cost savings for the students since the ma-
terials are online.
There are multiple OER repositories available
across the globe. One of the most well known is MIT
OpenCourseWare
3
, a Massachusetts Institute of Tech-
nology initiative to publish all of their educational
materials from its undergraduate and graduate-level
courses online, which are freely and openly avail-
able to anyone. Another such repository is Videolec-
tures.NET
4
, an award-winning free and open access
educational video lectures repository. The lectures
3
https://ocw.mit.edu/index.htm
4
http://videolectures.net/
84
Sunar, A., Novak, E. and Mladeni
´
c, D.
Users’ Learning Pathways on Cross-site Open Educational Resources.
DOI: 10.5220/0009391600840095
In Proceedings of the 12th International Conference on Computer Supported Education (CSEDU 2020) - Volume 2, pages 84-95
ISBN: 978-989-758-417-6
Copyright
c
2020 by SCITEPRESS – Science and Technology Publications, Lda. All rights reserved

published there are provided by distinguished schol-
ars and scientists at the most important and promi-
nent scientific events including conferences, summer
schools, and workshops.
There is a wide variety of OER repositories, pro-
viding educational materials on numerous of topics in
different formats i.e. videos or lecture notes, for dif-
ferent target groups i.e. students in K12 education,
life-long learners, or professionals, for different study
purposes i.e. acquiring basic knowledge or earning
a certificate on a micro level. Finding the appropri-
ate educational material for a teacher or a learner can
be an overwhelmingly difficult and time-consuming
task. To overcome this difficulty, we have connected
several available OER repositories and developed a
recommender engine that provides cross-site user rec-
ommendations based on the content they have vis-
ited. These recommendations consist of a selection
of OERs that are found in any of the connected repos-
itories and their content are determined as similar. In
addition, we have logged the user data regarding their
transitions from one resource to another within and
across the connected repositories.
In order to improve users’ learning experience in
a platform, it is crucial to understand the user prefer-
ences, their pattern of engagement, and their needs.
Learning analytics is one of the effective methods,
which is proven by the literature, to get insight into
the users’ behaviour. The results of learning ana-
lytics could be then used for serving the users the
educational materials in a more effective way such
as providing personalised recommendation, changing
the design of platforms, or providing timely feedback.
The main aim of our research is to identify the
different patterns of engagement in the numbers of
OER repositories which are registered in our con-
nected service, so that the results could be eventually
used to improve the performance of connection ser-
vice and recommender engine which currently pro-
duces content-base recommendations only. As a first
stage of our research, this paper focus on the analysis
of users’ activities collected through the repositories
registered in the connect service.
The research reported in this paper is conducted to
answer the following questions:
1. RQ1: Are there any recognisable engagement pat-
terns which can be used for grouping the users by
applying learning analytics?
2. RQ2: If so, what are the main differences between
the groups?
3. RQ3: Are these patterns distinctive by OER
repositories?
The remainder of the paper is structured as fol-
lows. Section 2 reports on the related work con-
ducted in the fields of learning analytics and recom-
mender systems. Next, the paper describes the analy-
sis methodology in Section 3 and its results in Sec-
tion 4, followed by a discussion in Section 5. We
conclude the paper in Section 6 where we provide an
overview of the results and present the next steps of
our research.
2 RELATED WORKS
2.1 Cross-site Collaborative Open
Educational Resources
While the many institutions create and shared OERs
as a main provider, Luo et al. (2010) highlights
the importance of cross-institutional collaboration in
creating and sharing OERs for the sustainability of
OERs. There are studies showing interest in collab-
oration of creation and dissemination of OERs. For
example, Lane (2012) investigates a number of con-
sortium for OER collaboration to feature the potential
of cross-institutional OERs in global teaching prac-
tices and the challenges.
Another collaboration on institutional level could
be implemented through Massive Open Online
Courses (MOOCs) platforms that are bringing insti-
tutes together in sharing OERs. However, on MOOC
platforms, the institutions generally create OER mate-
rials by themselves in a given format by the platforms
and less commonly institutions execute a MOOC col-
laboratively (Nortvig and Christiansen, 2017).
Apart from the examples that demonstrate the
cross-institutional collaboration in OER creation and
dissemination, there are a mere number of initiatives
that creates a recommender engine to cross-site search
for relevant OERs rather than collecting OERs on a
single platform (Shelton et al., 2010). In this pa-
per, we also use the data collected through a selec-
tion of OER repositories that collaborate in build-
ing a cross-site OER recommendation engine
5
(Novak
et al., 2018).
2.2 Identification of Learning Pathways
by Learning Analytics
Understanding the users’ online behaviour i.e. how
they learn, what they need for pursuing their study,
and what is the best way for providing materials, re-
quires extensive interdisciplinary research including
5
https://www.x5gon.org/
Users’ Learning Pathways on Cross-site Open Educational Resources
85

from the computer science and statistics to psychol-
ogy and pedagogy (Khalil and Ebner, 2016).
The users’ activities on educational platforms are
collected as log data which contains valuable infor-
mation about the users’ behaviour. Learning analyt-
ics has potentially valuable methods for acquiring the
necessary information out of the user data.
The Society for Learning Analytics and Research
(SoLAR)
6
defines the process of interpreting user
data i.e. learning analytics as ”the measurement, col-
lection, analysis and reporting of data about learners
and their contexts, for purposes of understanding and
optimizing learning and the environments in which it
occurs”.
Learning analytics could be applied at any scale
of data and any type of learning whether or not it is
online, on campus, or blended learning. However,
with the spread of open and free online educational
resources, the number of online learners grows fast,
where effectively diagnosing each learner and their
needs is comparatively more difficult than for those
on campus or in blended learning with less users in
a face-to-face setting. In this kind of online environ-
ments, the data collected through learners’ online ac-
tivities is the only source available to get insight into
their study.
For example, the instructors of online courses ex-
tensively exploit the learning analytics techniques to
inform about their learners and keep them engaged
throughout the time span of the course. Wise et al.
(2014) applied learning analytics to online discus-
sions and design intervention by reflecting the results
of learning analytics. Ma et al. (2015) used the data in
a Chinese university’s learning platform to investigate
the impact of instructors on engagement of students.
In addition to the micro use cases of learning an-
alytics in online learning, Drachsler and Kalz (2016)
proposed a conceptual framework for developing the
research evaluation, course designs, policymaking
guidelines for MOOCs which are recently become
very popular as they offer free online courses without
any prior requirements to enroll for learners.
The examples from the literature referred here in-
dicate the effort of applying learning analytics into
massive scale data in a single domain or platform.
There is also an attempt for open access collabora-
tive data analytics platform to visualise MOOC data
without sharing the data (Dernoncourt et al., 2013).
They propose a unified data modelling for three part-
ner MOOC platforms and enable the statistical analy-
sis and data visualisation using open tools such as the
6
1st International Conference on Learning Analytics
and Knowledge, Banff, Alberta, February 27 - March 1,
2011, https://tekri.athabascau.ca/analytics.
Python programming language and support for col-
laboration such as Github. This platform currently
performs simple, interactive, and descriptive statis-
tics, as well as comparative statistics, rather than
learning analytics.
To the best of our knowledge, there is a gap in
the literature proposing cross-site learning analytics
in open educational resources. There are numbers of
cross-platform user behaviour analysis especially in
online shopping (Huang et al., 2018) and in social
networking tools (Yan et al., 2013) but none in the
educational context. We believe our research would
contribute to this area.
If an OER platform requires enrollment for the
users to study on the platform i.e. online courses, the
user information can be used for user modelling and
providing personalised recommendations. However,
OER repositories heavily depend on the users’ per-
mission to use their personal information i.e. cook-
ies. If a user does not let the system anonymously
record their activities, it is difficult for the system
to produce personalised recommendations beyond the
content-based filtered recommendation.
In such cases, clustering users based on the past
engagements of other fellow users in a platform could
be a useful solution for categorising the users within a
chunk of identified engagement pattern without indi-
vidually identifying each user (Kizilcec et al., 2013).
In this paper, we propose to investigate the users’
clusters by applying learning analytics based on their
engagement within several OER repositories so that it
might be possible to better understand their behaviour.
As an ultimate goal in long term, the findings could
help us to provide better personalised recommenda-
tions on the respective OER repositories.
3 METHODOLOGY
3.1 Data
There are two data sources in the designed cross-site
project: Connect Service and Recommender Plug-in.
Connect Service. The first source is a library which
is included into the repository website and inform our
system that a user has visited a particular page con-
taining OER materials. The data provides:
• User ID. The identifier of the user that accessed
the material. This value is generated by the li-
brary and, with the user’s permission, is stored as
a cookie in the user’s browser. The identifier is
randomly generated and cannot be used to trace
back to the user.
CSEDU 2020 - 12th International Conference on Computer Supported Education
86

• Material URL. The URL of the visited website
containing OER materials.
• Referrer URL. The URL of the website from
which the user is navigated from.
• Access Date. The date at which the material was
accessed.
• User Agents. The information about the technol-
ogy used to access the material.
• Language. The language configuration in the
user’s technology.
We have also asked the repositories to include a
cookie policy option for the users to disable this li-
brary’s functionalities - meaning we have acquired
only the data of the users that agreed to providing.
The data is cleaned, removing the activities by
bots and system administrators. After cleaning the
data, there are 213,674 transitions collected from
the following repositories: eU
ˇ
cbeniki
7
, University of
Nantes, Universitat Polit
´
ecnica de Val
´
encia (UPV),
Videolectures.NET (VL), and virtOUS by University
of Osnabrueck
8
. These repositories are used in this
research as they integrated the Connect Service into
their platforms. If other OER repositories happen
to register themselves in to the system in the future,
it would be possible to rich our research including
those repositories. The transitions were provided by
110,778 unique users who agreed sharing their per-
sonal information. This is the main dataset used in
our research.
Recommendation Plugin. The recommendation plu-
gin was designed to be easily included on the repos-
itory websites. The plugin can be configured to pro-
vide recommendations of materials that are similar or
associated with the materials on a particular website.
When the user selects an item on the list.
In this paper, however, we did not use the data
collected through the recommender engine.
3.2 Creation of Sessions
There are different approaches to analyse the data for
identifying the behaviour patterns.
• User Perspective. The learning pathway for each
user could be analysed. However, there are some
old users having sustained interactions over the
years while the other newly enrolled users have
limited interactions. Comparing these groups of
users would provide a bias the analysis.
7
https://eucbeniki.sio.si
8
https://www.virtuos.uni-osnabrueck.de/
zentrum fuer digitale lehre campus management und
hochschuldidaktik.html
• Material Perspective. Mapping of the materials’
usage patterns. This kind of analysis is useful to
see the overall interaction and to inform the most
visited materials and intersections among the ma-
terials.
• Session-based Perspective. In order to overcome
the inadequacies of the other two approaches,
analysing the users’ behaviour in a certain period
of time, i.e. sessions, could be a good solution.
In this approach, the user activities are divided
into the sessions. It enables us to see what are the
frequent behaviours and patterns of study when a
user starts interacting with the website.
In this paper, we took the session-based approach
to analyse the users’ cross-site behaviour. de Barba
et al. (2019) suggest that analysing users’ behaviours
in sessions is becoming increasingly popular as it is
very practical especially analysing the self-regulated
and life-long learners’ behaviours. The definition of
sessions could also be various depending on the de-
sign of the learning platform or the objective of the
researcher. As we do not have the information regard-
ing the logouts or the time they closed the web page,
we only know when a user visited a certain material’s
URL. Therefore, in this research, the time between
two sequential clicks on the material’s url will be con-
sider to build up the sessions. If the time passed be-
tween two clicks is sufficiently close, then these two
actions will be classified as in the same session. De-
ciding the duration of the user’s sessions is crucial in
this scenario. The duration should not be too long -
losing the accuracy of the results - and should not be
too short - missing the ongoing activities. To decide
the session duration, we investigated the time passed
between two page visits by users with the violin plots
in Figure 1.
According to in Figure 1.(a), the majority of the
visits happened in less than in an hour. In fact, major-
ity of the visits happened in less than a minute as can
be seen in Figure 1.(b).
Since there are some more than 1 hour long
videos, we have decided that 2 hours is a reasonable
time-length as a threshold time between two visits.
In our research, the user session is defined as a se-
quence of material visits where the time between the
two consecutive material visits is less than 2 hours, as
illustrated in Figure 2.
The total length of a session and the number of
materials visited in a session could vary per session.
Some users are moving backward and forward be-
tween a couple of materials while some others jump
amongst as many materials as possible. There are also
some users who visit a single page and leave. Since
the page closures are not logged in our data, we are
Users’ Learning Pathways on Cross-site Open Educational Resources
87
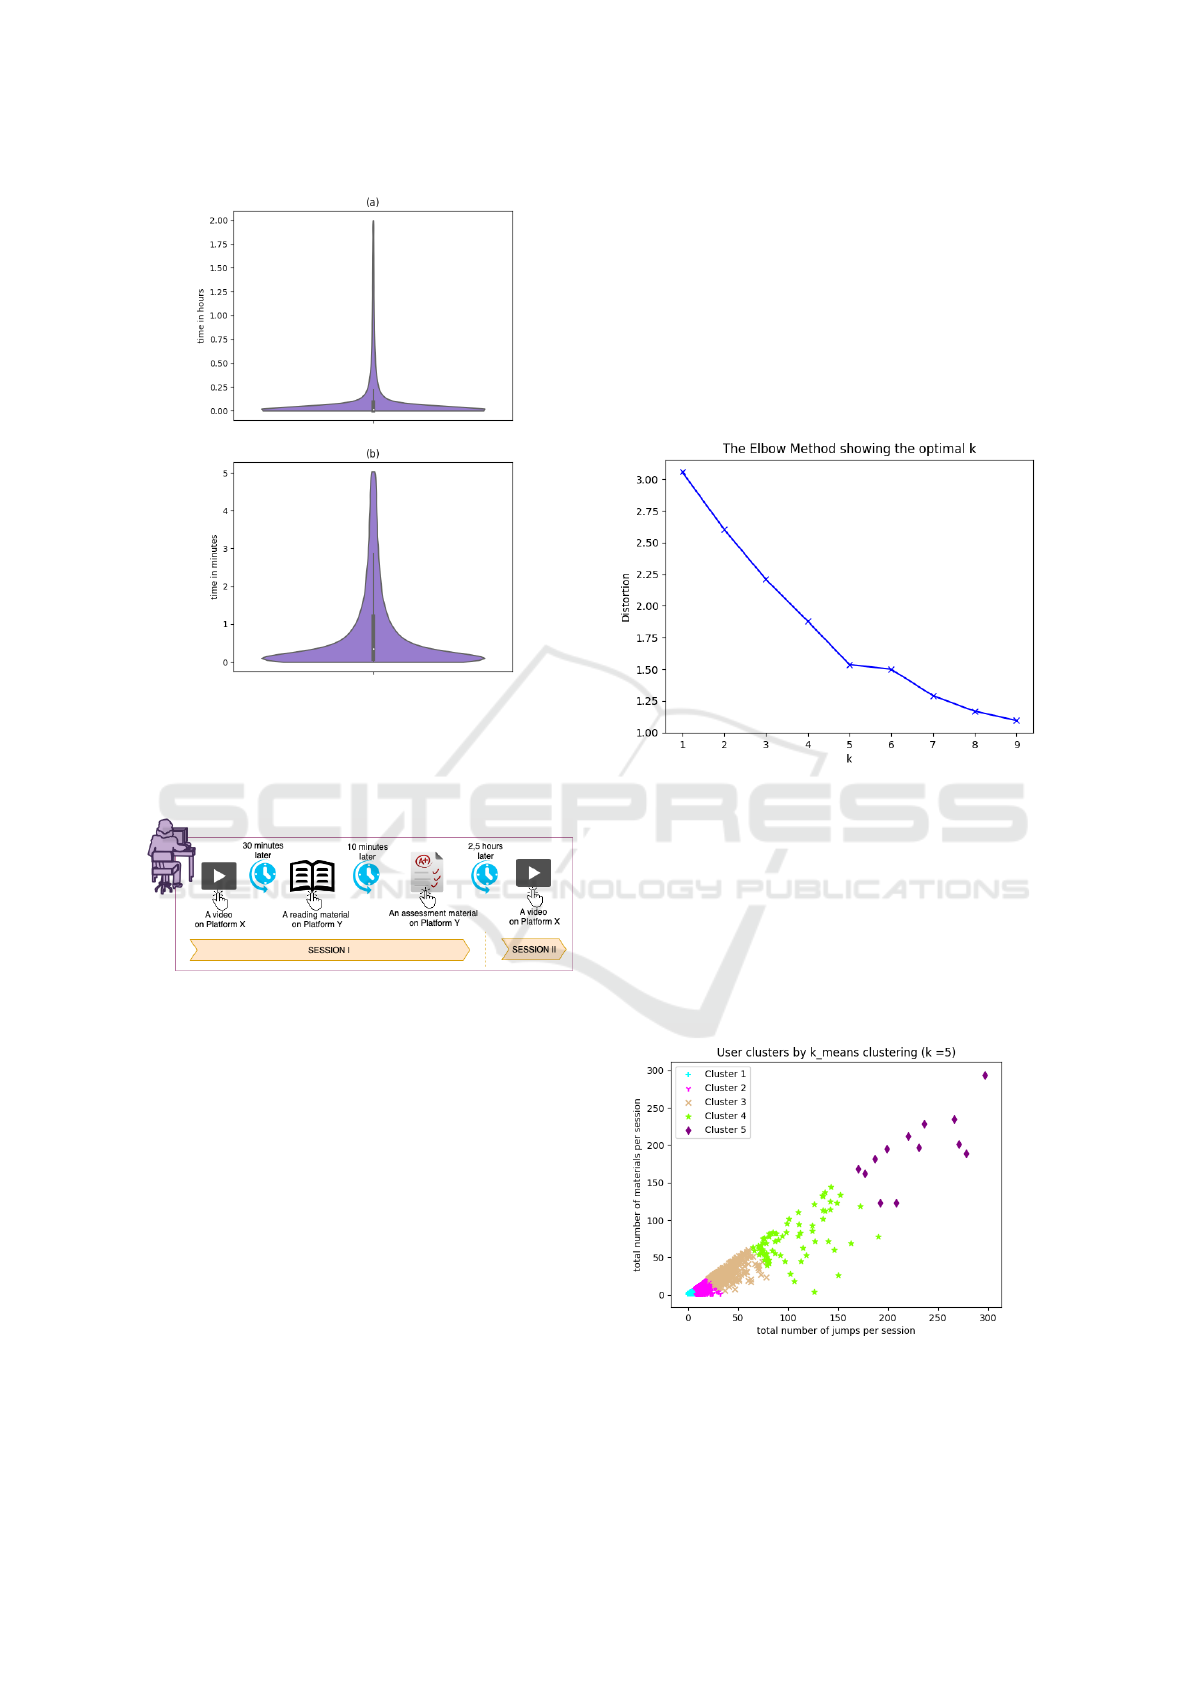
Figure 1: Time passed between two consecutive page vis-
its. Figure (a) shows the time passed (in hours) between
two visits in a 2 hours period, and Figure (b) shows the time
passed (in minutes) between two visits in a 5 minutes pe-
riod.
Figure 2: Illustration of the session creation. When the time
of two sequential user visits is greater than 2 hours, we cre-
ate a new session for that user.
not able to detect the exact length of the user sessions.
4 ANALYSIS AND RESULTS
4.1 Analysis of Users’ Session
Behaviours
In order to understand the behaviour patterns in a ses-
sion, the sessions were clustered based on the num-
ber of materials and number of transitions in a ses-
sion. For clustering, the elbow and k-means cluster-
ing methods have been used.
The k-means algorithm is a clustering algorithm
which assigns each pattern one of the k clusters, k is
assigned by the user. First, the algorithm chooses k
random points - called centroids - within the pattern
space and assigns each pattern to the closest centroid.
Afterwards, the centroid is re-calculated as the aver-
age of the patterns’ features. The process is repeated
with the now existing centroids until there is no or
minimal reassignment of patterns to the centroids, or
minimal decrease in squared error (Jain et al., 1999).
The patterns that are closest to a given centroid from
a cluster.
Figure 3: Elbow graph for k-means clustering. When k = 5,
the slope of the graph starts to get more stable, making it an
appropriate candidate parameter for clustering the data.
The elbow method helps to find out the appropri-
ate number of clustering by calculating the sum of
squared errors indicating the point that adding another
cluster does not add sufficient information (Madhu-
latha, 2012). The results of elbow method show that
k = 5 seems like an appropriate parameter for cluster-
ing our sample of data as shown in Figure 3.
Figure 4: Five clusters extracted by k-means clustering
method based on number of materials visited in a session
and number of clicks made in a session.
CSEDU 2020 - 12th International Conference on Computer Supported Education
88
Afterwards, we have used the k-means cluster-
ing method with k = 5 to cluster the patterns. Fig-
ure 4 shows the user clusters with regards to the total
number of jumps (clicks between materials) and total
number of materials visited per session.
For the clustering, the activities were not identi-
fied by their repositories but threatened as unified. In
order to identify the differences between clusters, we
have used the Gephi
9
visualisation tool to extract the
engagement patterns for each cluster. During this pro-
cess, the materials were coloured by their repositories
and mapped as a directed graph. The nodes were sized
by the clustering coefficient, which shows how con-
nected it is to its neighbours. The size of the node is
the biggest when it is in a fully connected neighbour-
hood.
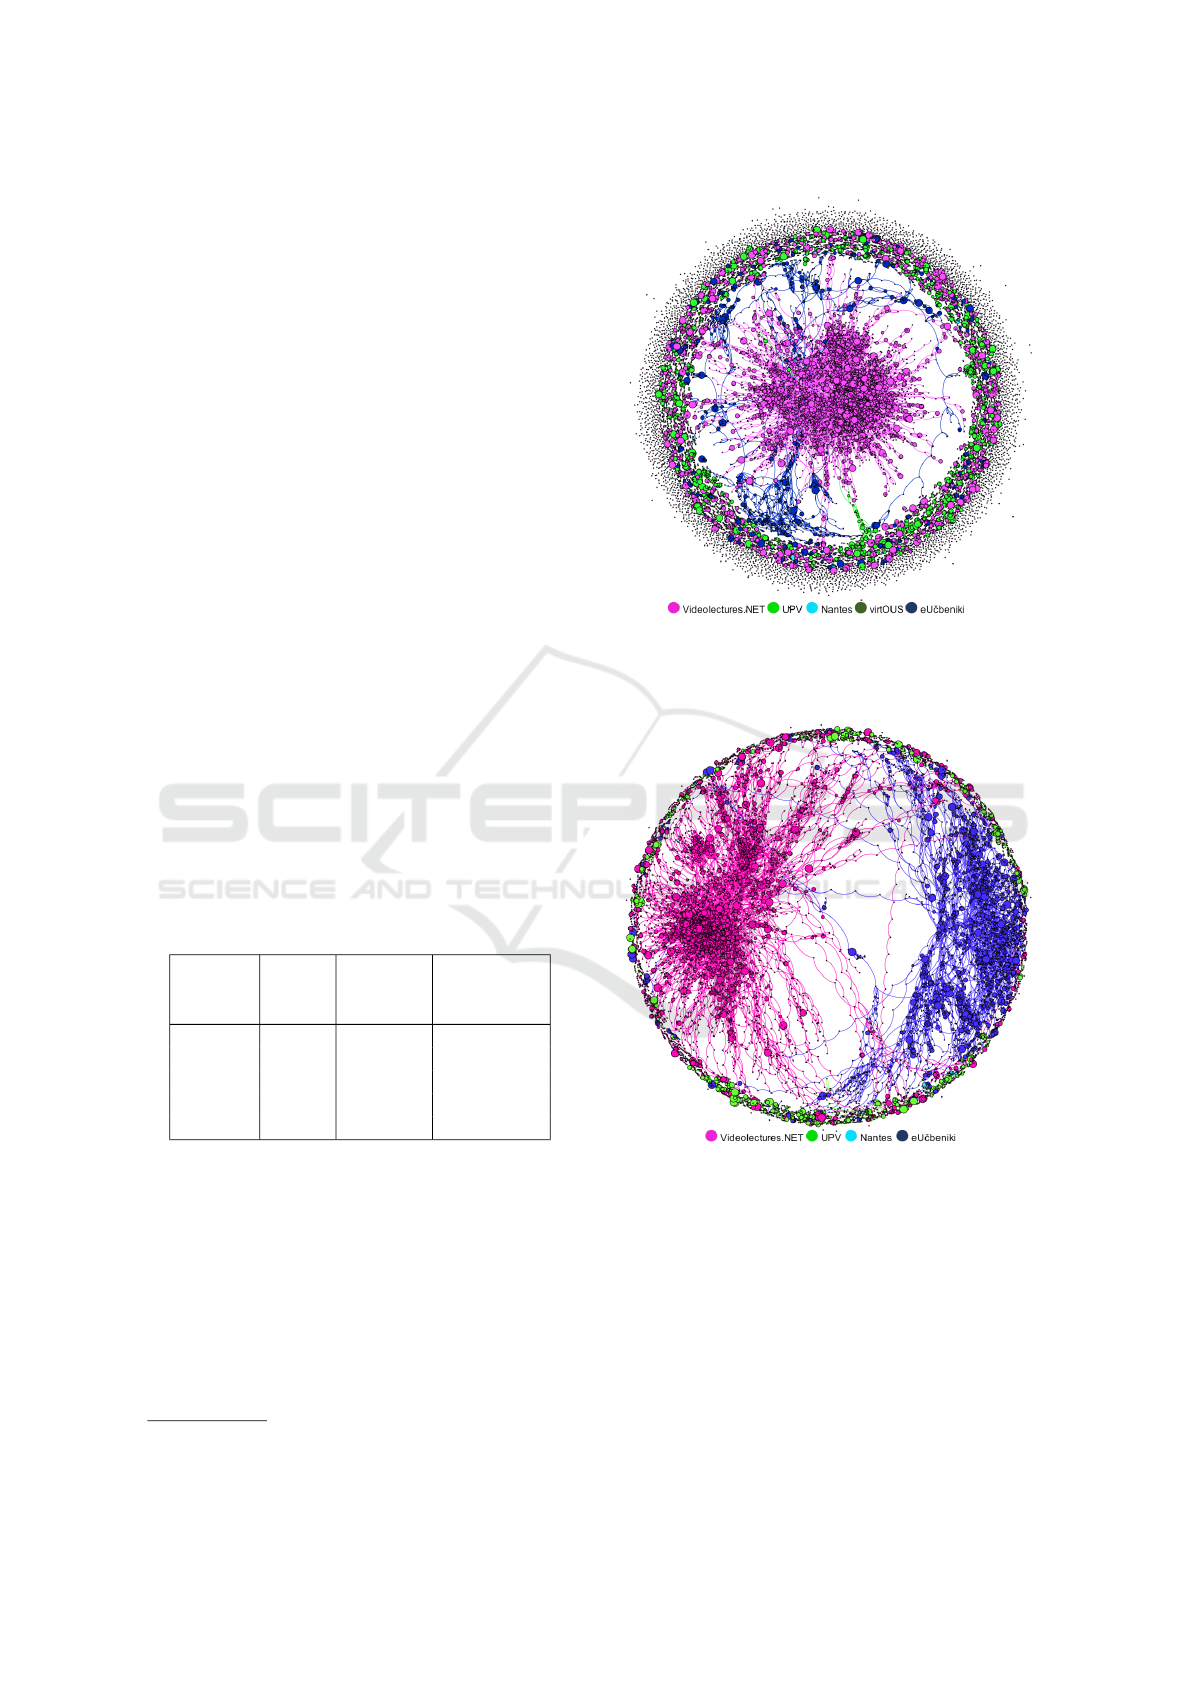
Figures 5, 6, 7, 8, and 9 represent the overall
users’ interactions on the registered repositories with
the materials in each cluster, respectively. The nodes
represent the learning materials on OER repositories
which are coloured by content provider. The edges
represent a transition of a user between two materials.
The overall engagement patterns show that the
pattern and the frequency of engagement vary by the
different content providers. The diversity in differ-
ent OER repositories in a cluster decreases over the
clusters i.e. while five different OER repositories in
Cluster 1, there are only two repositories in Clusters 4
and 5. When the results are considered together with
Table 1, it is seen that the number of materials in a
session decreasing over the clusters.
Table 1: Summary of statistics for each Cluster.
Clusters
Single
page
visits
Page
refreshes
# of
repositories
seen
1 32.6% 22.5% 5
2 0 7% 4
3 0 3.8% 3
4 0 3.2% 2
5 0 2% 2
It is remarkably seen that there are too many single
page views and page refreshes from the outer circle of
the graph in Cluster 1 (Figure 5) where the transitions
mostly happened by the users on VL (75%) and UPV
(16%). Following them, 8% of the transitions hap-
pened by users on eU
ˇ
cbeniki and 2% of the them hap-
pened by users on Nantes and virtOUS. Apart from
the single page views, it is also seen that there is not
much interaction hubs - most of the transitions hap-
pened in the centre of the cluster, indicating there are
short sessions between a limited number of materials
9
https://gephi.org
Figure 5: Cross-site material interaction in Cluster 1. Too
many single page views are observed. Dominated by the
users on VL and UPV.
Figure 6: Cross-site material interaction in Cluster 2. Less
single page view, longer paths dominated by users on VL
and eU
ˇ
cbeniki.
(Average path length is 7.1).
Transitions in Cluster 2, similar to Cluster 1,
mostly happened by users on VL (53%). The rest
is from eU
ˇ
cbeniki (30%), UPV (17%), and Nantes
(0.1%). No transitions were provided from virtOUS.
In this cluster, there are no single page views and very
rare page refreshes in this cluster where it is seen as
isolated small circles outside of the connected circled
materials, there are longer paths and more materials
Users’ Learning Pathways on Cross-site Open Educational Resources
89
that are connected as seen in Figure 6, there are more
number of connected nodes in the centre of the graph
and less number of shortly connected materials at the
outer circle of the graph in comparison to the Cluster
1 in Figure 5.
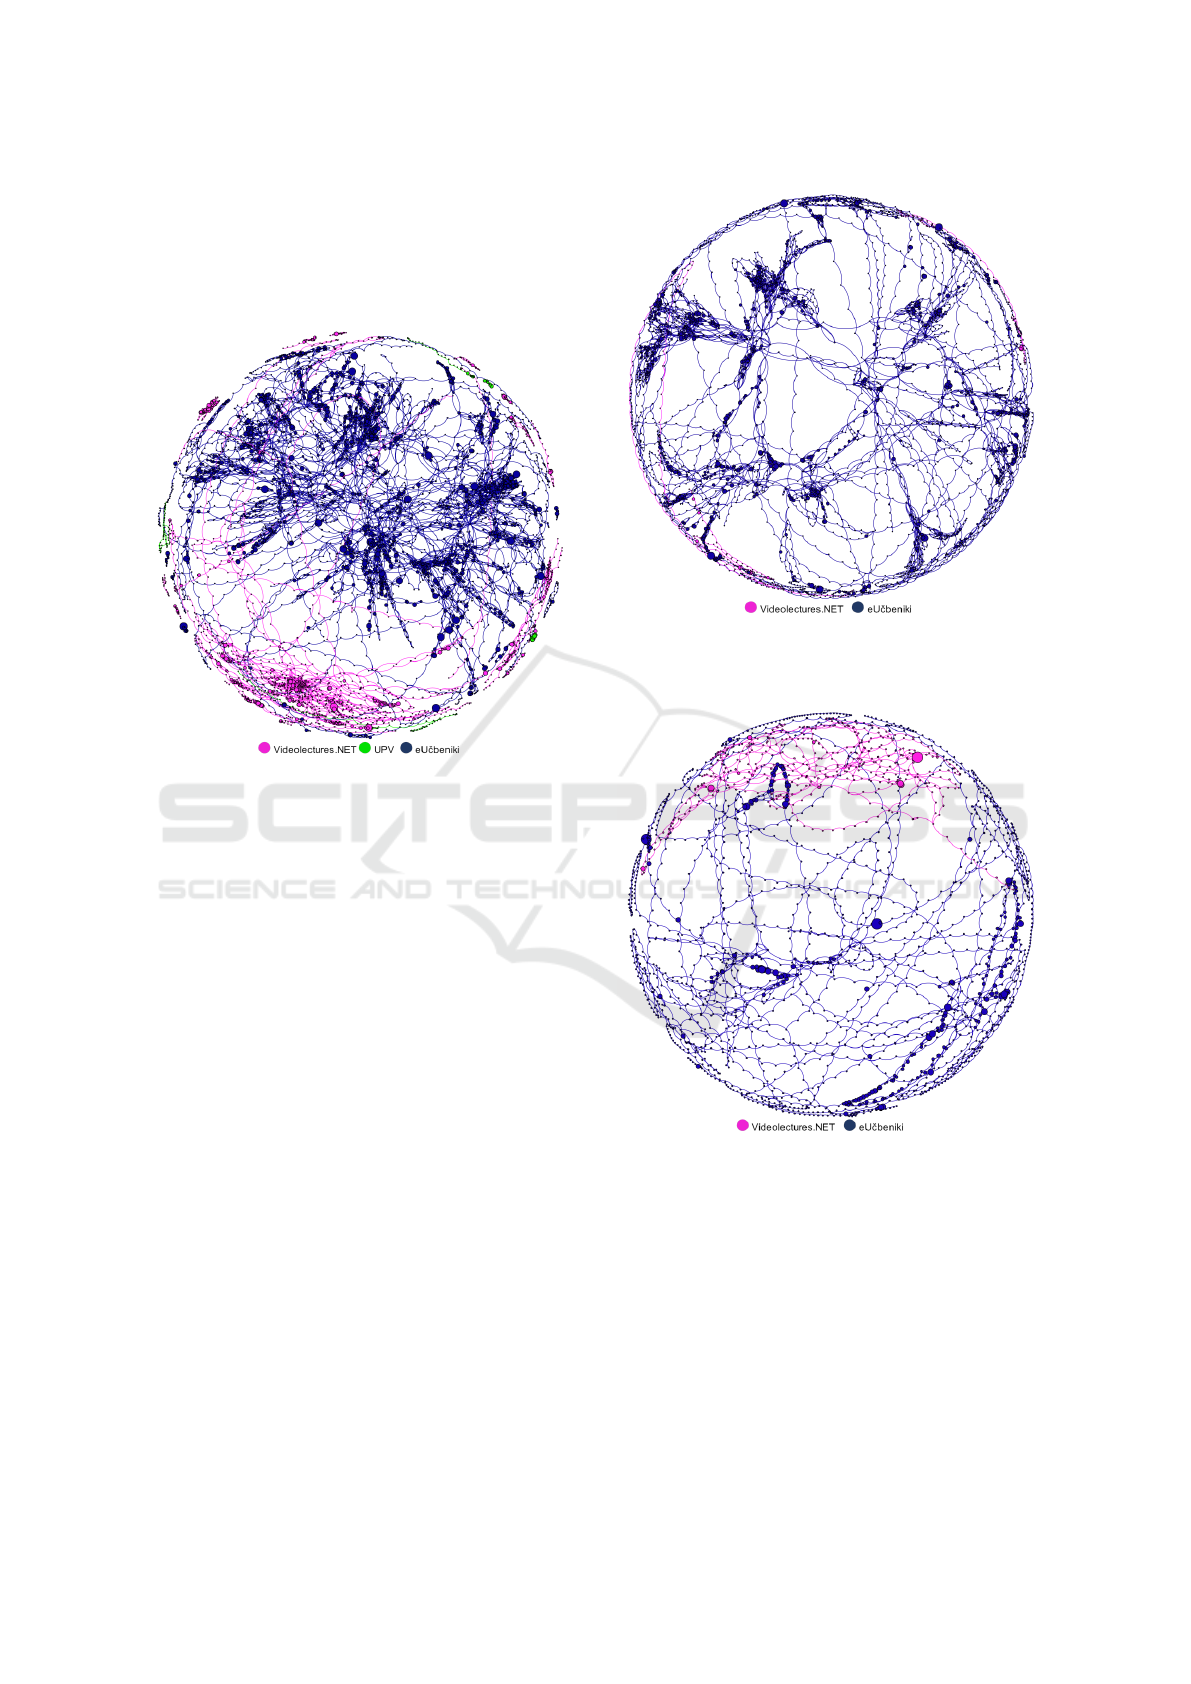
Figure 7: Cross-site material interaction in Cluster 3.
No single page views anymore. Dominated by users on
eU
ˇ
cbeniki and UPV.
Figure 7 shows that there is no single page views
anymore. That means there is at least one connec-
tion (edge) between two materials (nodes), therefore,
at least two materials have been seen in a session.
In comparison to the previous clusters, the length of
paths are much more longer and the network is dom-
inated by the users on eU
ˇ
cbeniki (77%). The rest of
the transitions happened by the users on VL (21%)
and UPV (2%).
It is observed in Cluster 4 represented in Figure 8
that there are only two repositories left in the network:
eU
ˇ
cbeniki (97%) and VL (3%). The number of peo-
ple in this cluster is much smaller than in the previous
clusters. However, the number of material visits in
the users’ sessions is greater. In addition, the materi-
als are more connected.
Similar to Cluster 4, users in Cluster 5 pro-
vide longer sessions. It is remarkably seen in Fig-
ure 9, there are many sequential page viewings where
the transitions mostly happened by the users on
eU
ˇ
cbeniki (83%) - which can be explained by the
repository’s structure. The eU
ˇ
cbeniki repository is an
educational platform where the learning materials are
designed as sequential pages, where each page is de-
signed to provide a single small learning objectives
i.e. multiplying one-digit numbers. Therefore, users
Figure 8: Cross-site material interaction in Cluster 4. More
connected and longer paths dominated by the users on
eU
ˇ
cbeniki.
Figure 9: Cross-site material interaction in Cluster 5. Long
sequential page views dominated by users on eU
ˇ
cbeniki.
do not spend hours on a page and quickly navigate to
the next page. This would explain the sequential long
paths comparing to the patterns dominated by users
on VL and UPV where they usually interact with long
videos which, in turn, generate shorter sessions or a
single page view.
To compare the clusters, Table 2 and Table 3 show
the statistical results of the networks for each cluster.
There are three statistical measurements listed in the
table:
CSEDU 2020 - 12th International Conference on Computer Supported Education
90

Table 2: Average Degree and Average Path Length of Net-
works for each Cluster.
Clusters Avg. degree Avg. path length
1 1.224 7.148
2 1.679 11.664
3 1.712 22.5
4 1.570 36.351
5 1.199 52.132
• (Average) Degree: represents the number of con-
nections that a node has to other nodes in the net-
work.
• (Average) Path Length: represents the average
number of steps along the shortest paths for all
possible pairs of network nodes.
• Modularity (Number of Communities): mea-
sures the division strength of a network into mod-
ules, i.e. communities. Networks with high mod-
ularity have dense connections between the nodes
within modules but sparse connections between
nodes in different modules.
While the average path length in the networks are
distinctively different, the average degree of networks
are quite similar. This result implies that even though
the length of the connected nodes (OERs) varies, the
number of nodes that another node is connected to
is generally one. However, while the average path
length within a network is the smallest for Cluster 1,
where the single page viewing appears quite often, the
average path length within the network of Cluster 5 is
over 52, which is eight times bigger than the smallest
length.
Table 3: Modularity, Nodes and Edges of Networks for each
Cluster.
Cluster #Nodes #Edges
Modularity
(# communities)
1 16970 20766 0.893 (5940)
2 10364 17401 0.921 (461)
3 5990 10254 0.945 (80)
4 3976 6242 0.942 (47)
5 2281 2734 0.944 (42)
In order to make a meaningful comparison, Ta-
ble 3 shows the network modularity with the number
of edges and nodes. The modularity measure shows
the divisions in the network. While the modularity is
very similar for all the cluster (ranging between 0.893
and 0.945), the number of communities is quite differ-
ent (with 5940 communities in Cluster 1, 461 commu-
nities in Cluster 2, 80 communities in Cluster 3 and
about 45 in Clusters 4 and 5).
Figures 10, 11, 12, 13, and 14 show the distribu-
tion of community sizes for Clusters 1 to 5, respec-
tively. The figures provide a deeper insight into the
results provided by Table 3.
Figure 10: Community size distribution of Cluster 1. Over
5500 small communities with usually less than 10 members,
showing that the nodes are so dispersed in the network.
According to the graphs, the way that the
materials are connected produces too many sub-
communities with small number of members in Clus-
ters 1 and 2. Towards Cluster 5, however, there are
numbers of communities where the materials are dis-
tributed reasonably.
Figure 11: Community size distribution of Cluster 2. Over
450 small communities with usually less than 10 members.
In Cluster 1 represented by Figure 10, there are
over 5500 small communities in the network where
each of them usually has a few materials. This re-
sults is aligned with the many single page view pat-
tern. The similar community size distribution is also
seen in Cluster 2 represented by Figure 11. However,
the number of communities has drastically decreased
to 450.
Another dramatic decrease in the number of com-
munities has been observed in Cluster 3 in Figure 12.
Even though there are some communities with less
than 10 materials, the overall size per modularity dis-
tribution is different from the previous cluster distri-
butions.
Users’ Learning Pathways on Cross-site Open Educational Resources
91
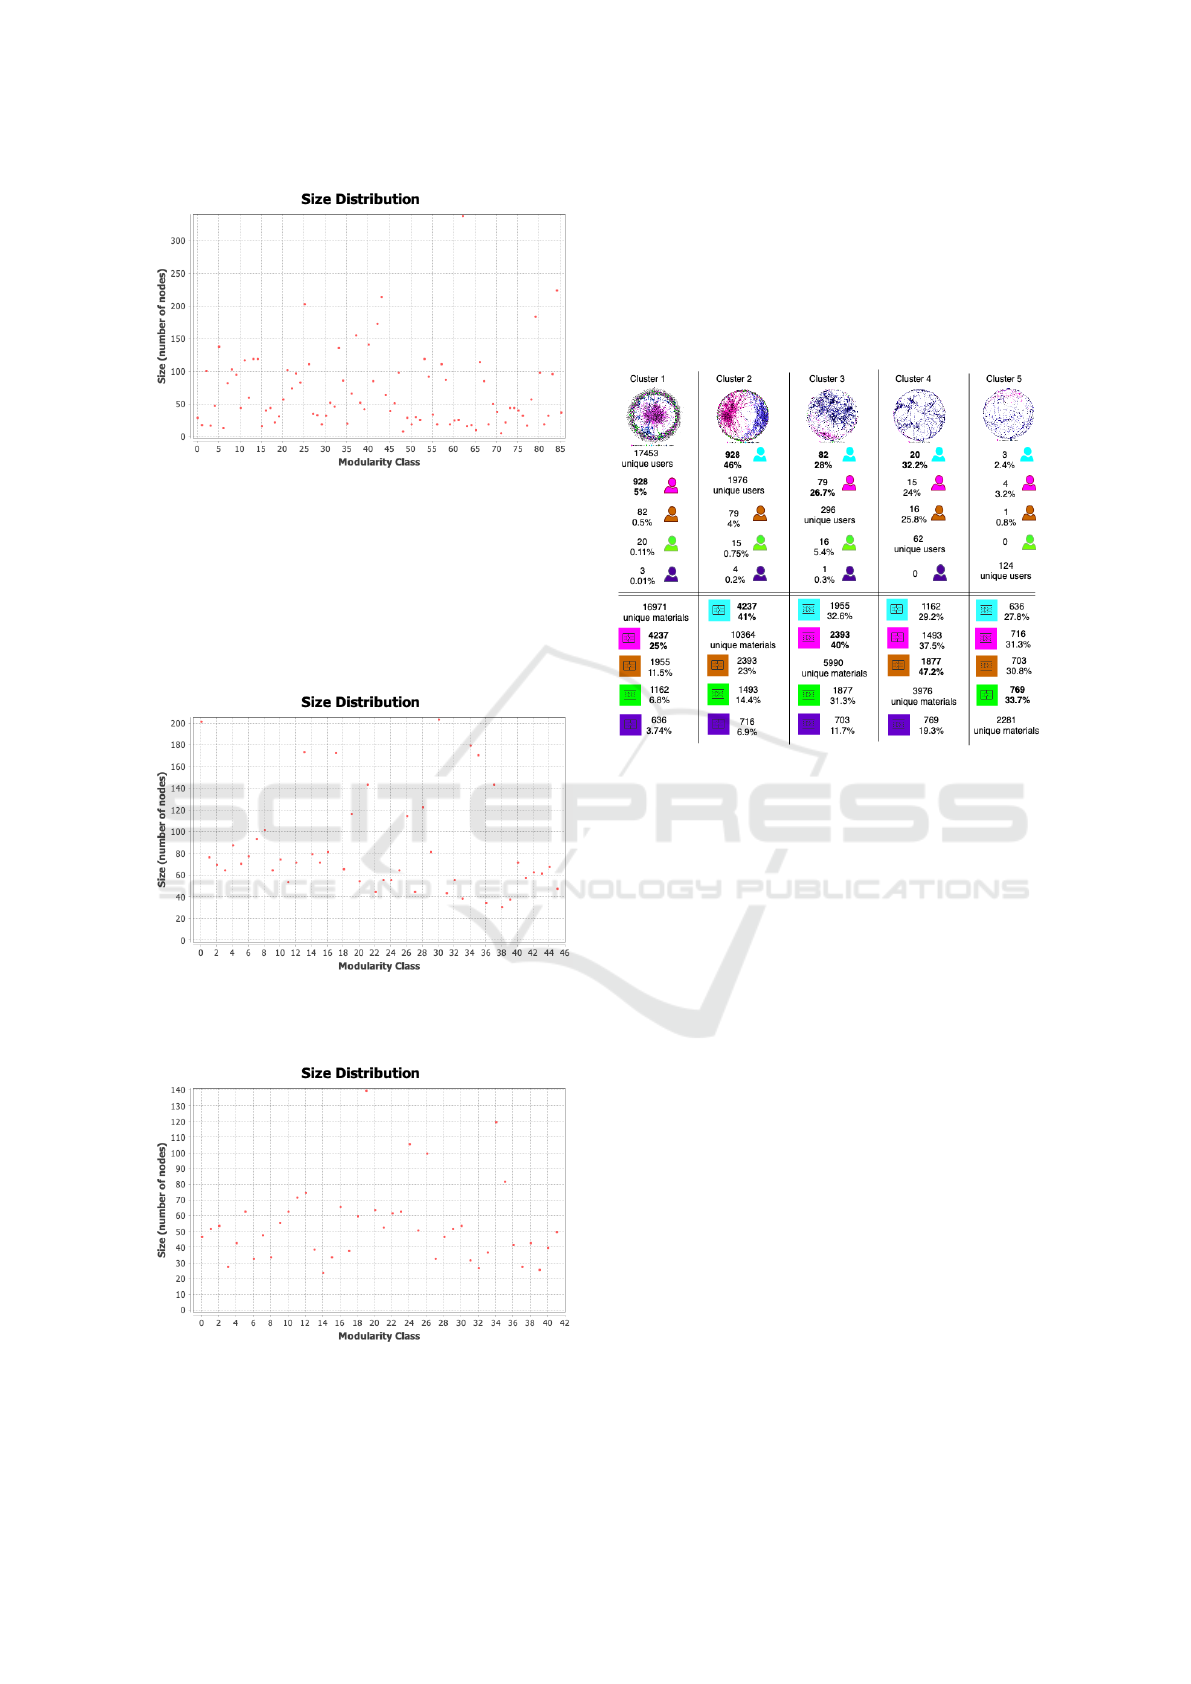
Figure 12: Community size distribution of Cluster 3. Al-
most 85 small communities with usually members around
10 to 100.
While the number of communities is almost half in
Cluster 4 in Figure 13, it remains stable in Cluster 5
in Figure 14 with a similar community number. How-
ever, the distribution size in Cluster 5 moves around
40 while it is around 70 in Cluster 4.
Figure 13: Community size distribution of Cluster 4. Less
than 46 small communities with more than 30 members per
se.
Figure 14: Community size distribution of Cluster 5. Less
than 42 small communities with more than 20 members per
se.
This result implies that the materials are densely
inter-connected where users can go easily from one
to another. In our study, this result can be concluded
as that the users in Clusters 1 and 2 did not find easy
to navigate between the learning materials and inter-
acted with a limited number of materials in a single
session.
Figure 15: Proportions of users and materials commonly
seen per cluster. Users in Cluster 1 and Cluster 5 usually
not seen in other Clusters. Even though the users in Clusters
2, 3 and 4 are seen in Cluster 1, the percentage is around
30. Unlike the interchange amongst users, the materials are
more commonly seen in different clusters.
In order to understand the reason why the patterns
appeared in such way i.e. due to users’ choice or
the material design, we have analysed the number of
users and the number of materials that appeared in
different clusters.
Figure 15 shows the proportion of the users and
materials that are detected in more than one cluster. It
is observed that the users in Cluster 1 are rarely seen
in other clusters, which is an expected result as there
are too many single page views and short pathways.
Similarly, users in Cluster 5, who made long sequen-
tial learning pathways by interacting with large num-
ber of learning materials, are almost never seen in an-
other cluster. These two clusters could be thought as
the two polar clusters which are furthest of one an-
other.
On the reverse side, the biggest proportion of the
users that were present in other clusters are the users
found in Cluster 1. This indicates that actively en-
gaged users sometimes had limited interactions as
well.
Stimulating new questions, the users who showed
different patterns in multiple clusters, usually hap-
CSEDU 2020 - 12th International Conference on Computer Supported Education
92

pened to be in closer clusters. For example, a lot of
users found in Clusters 3 are also present in both Clus-
ters 1 and 2.
The distribution of materials per cluster are rather
different than the user distribution in the clusters. It
is observed that a large amount of materials are found
in multiple clusters. These statistics indicate that the
users interacted with the very same material in a dif-
ferent patterns of engagement.
However, there is still not enough evidence to say
that the patterns in the clusters are driven by solely the
users’ choice or the design and characteristic of mate-
rials. Therefore, there might be an argument support-
ing clustering based on users not the sessions. Since
there is a limited access to the users including their de-
mographic data, one of the best options is to analyse
the patterns of users’ integration with the materials in
sessions in this kind of OER environments. This is
an open research question which will be one of the
focuses of future research.
5 DISCUSSION
In this paper, we have analysed the clusters of users
according to their pattern of engagement with the
open learning materials provided by the numbers of
different OER providers and repositories.
According to the results, we have observed that
there are a number of users showing different patterns
of engagement as well as a number of OER materi-
als commonly seen in different clusters. This result
implies that both the users themselves and the char-
acteristics of learning material are an important fac-
tor. There is a need for another research to clarify this
point. We need to investigate the design of the plat-
forms along with the semantic relationship amongst
the learning materials, in addition to the users who
interacted with the items, to make a conclusion about
this issue.
One ultimate limitation of this kind of research is
that we will never be able to identify the internal moti-
vation and external situation of the users during their
study unless we ask for constant feedback, which is
impossible at the practical level. For example, there
might be a user that received an urgent phone call and
had to leave the session earlier than expected, which
may mislead the classification of the engagement pat-
terns. A user could have an exam on a particular topic
and was never interested in the recommendations the
plugin gave them based on their previous visits. This
has to be considered while interpreting and evaluating
an online recommender system.
Throughout our research, we tried to collect as
many educational material metadata as possible to im-
prove the dataset we are analysing. Through this pro-
cess, we have found that although OERs are publicly
accessible, they are hard to be located and acquire
programmatically. This can be improved by OER
repository in the following way:
1. Allow Crawlers to Acquire OER Material
Metadata. We have found that OER repositories
do not allow crawlers to go through certain web
pages. This is done by configuring the robots.txt
file
10
. In some cases we have seen that the main
endpoint for accessing to the OER materials (usu-
ally the /search route or some other variation) is
disallowed in the robots configuration. Although
following the robots configuration is not required,
it is good practice to acknowledge the website
owner’s wishes. With this in mind, we suggest the
OER repositories to provide a sitemap (a way of
organizing the website, identifying the URLs and
the data under each section) to the OER materi-
als that they wish to be crawled. This allows the
crawlers to both respect the robots configurations
and access the OER material metadata available
in the repository.
2. Using Common Standards to Specify the Loca-
tions of Certain Values. When an OER reposi-
tory does not provide a public API, the most com-
mon way of acquiring OER material metadata is
by scraping their associated web pages. Since
OER repositories tend not to follow the same web-
site layout, the material metadata is found in dif-
ferent locations in different sites - which makes
finding the relevant metadata difficult. To this end,
we suggest OER repositories to employ common
standards in their websites to specify where cer-
tain parts of the material metadata are available.
One such standard is the Dublin Core Standard
11
,
which contains the metadata terms that can be in-
cluded to the website to specify the locations and
types of the material metadata.
6 CONCLUSION AND FUTURE
WORK
The research reported in this paper is designed to
analyse the behaviour of consumers of open educa-
tional resources (OERs) dispersed in a number of
10
A robots.txt file tells search engine crawlers which
pages or files the crawler can or can’t request from
your site. More: https://support.google.com/webmasters/
answer/6062608?hl=en
11
https://dublincore.org/
Users’ Learning Pathways on Cross-site Open Educational Resources
93

websites that integrated the connect service library.
The aim of this research was to investigate clusters
among the users who show similar patterns of engage-
ment with the learning materials across the before-
mentioned websites.
To clearly draw the line of the study, the following
research questions have been asked:
1. RQ1: Are there any recognisable engagement pat-
tern which can be used for clustering the users by
applying learning analytics?
2. RQ2: If so, what are the main differences per clus-
ter?
3. RQ3: Are these patterns distinctive by OER
repositories?
The activities of users were divided into sessions
by checking out whether or not the time passed be-
tween two visits is no more than 2 hours. Two nu-
meric factors indicating the feature of the engage-
ment, number of materials visited in a session and
number of visits made in a session, are used.
In order to answer RQ1, k-means clustering
method has been used. Five clusters have been de-
tected based on number of materials visited in a ses-
sion and number of clicks made in a session (see Fig-
ure 4).
The main distinctive differences between the clus-
ters are i) number of repositories seen in a cluster and
ii) drop in single page views after Cluster 1, and iii)
increasing longer and sequential view of OER mate-
rials from Cluster 1 to Cluster 5.
It is observed that the pattern of engagement varies
by clusters. The users on the online learning platform
of the Universitat Polit
´
ecnica de Val
´
encia (UPV) have
been seen in only Clusters 1 to 3. The users on Vide-
olectures.NET (VL) and eU
ˇ
cbeniki were detected in
every single cluster while the users on VL were
mostly in the first two clusters, users on eU
ˇ
cbeniki
were dominant in Clusters 3 to 5. This results answer
RQ3, even though we believe that there is a room for
a detail investigation on each platform.
In conclusion, the contributions of our paper can
be summarised as follows:
• Users can be grouped, in our case it was into five
clusters, based on the number of materials they
interacted with and the number of transitions they
made within a certain time period.
• Users on the same OER provider usually show
similar patterns of engagement. For example,
users on UPV have only be seen in the first three
clusters so that they never showed a sequential en-
gagement with the materials.
• The design of materials might have an effect on
the pattern of engagement. For example, users on
eU
ˇ
cbeniki are usually clustered in the last three
clusters where there is a sequential paths extracted
from the users’ transitions amongst many mate-
rials. eU
ˇ
cbeniki is also designed as a sequential
lecture models directing users to the next page
after study the current page. Even though same
users on Videolectures.NET showed the same pat-
tern, they are usually seen in the first two clusters
where single page views or shorter paths occurred
as relatively longer videos are available on Vide-
olectures.NET.
The future direction of this research is to com-
plete the analysis by using the semantic relationship
between the OER materials to more meaningfully ad-
dress the users’ learning pathways across the clusters.
A final direction of this research would be to use the
gathered information by learning analytics in improv-
ing our existing recommendation system and encour-
age other OER repositories to integrate the system
into their website for their visitors. We also intend to
share our final model for cross-site engagement pat-
tern detection so that other OER repositories can re-
use it and integrate in their system as we believe open
cross-site systems will be more demanded in the fol-
lowing decades.
ACKNOWLEDGEMENTS
This work was supported by the Slovenian Research
Agency and X5GON European Unions Horizon 2020
project under grant agreement No: 761758.
REFERENCES
de Barba, P. G., Malekian, D., Oliveira, E. A., Bailey, J.,
Ryan, T., and Kennedy, G. (2019). The importance
and meaning of session behaviour in a massive open
online course. Computers & Education, page 103772.
Dernoncourt, F., Taylor, C., O’Reilly, U.-M., Veeramacha-
neni, K., Wu, S., Do, C., and Halawa, S. (2013).
Moocviz: A large scale, open access, collaborative,
data analytics platform for moocs. In NIPS work-
shop on data-driven education, Lake Tahoe, Nevada.
Retrieved from http://groups. csail. mit. edu/EVO-
DesignOpt/groupWebSite/uploads/Site/MoocViz. pdf.
Drachsler, H. and Kalz, M. (2016). The mooc and learning
analytics innovation cycle (molac): a reflective sum-
mary of ongoing research and its challenges. Journal
of Computer Assisted Learning, 32(3):281–290.
Huang, H., Zhao, B., Zhao, H., Zhuang, Z., Wang, Z.,
Yao, X., Wang, X., Jin, H., and Fu, X. (2018). A
cross-platform consumer behavior analysis of large-
scale mobile shopping data. In Proceedings of the
CSEDU 2020 - 12th International Conference on Computer Supported Education
94

2018 World Wide Web Conference, pages 1785–1794.
International World Wide Web Conferences Steering
Committee.
Jain, A. K., Murty, M. N., and Flynn, P. J. (1999). Data
clustering: a review. ACM computing surveys (CSUR),
31(3):264–323.
Khalil, M. and Ebner, M. (2016). What is learning analytics
about? a survey of different methods used in 2013-
2015. In Smart Learning Conference.
Kizilcec, R. F., Piech, C., and Schneider, E. (2013). Decon-
structing disengagement: analyzing learner subpopu-
lations in massive open online courses. In Proceed-
ings of the third international conference on learning
analytics and knowledge, pages 170–179. ACM.
Lane, A. (2012). Collaborative development of open edu-
cational resources for open and distance learning.
Luo, A., Ng’ambi, D., and Hanss, T. (2010). Towards build-
ing a productive, scalable and sustainable collabora-
tion model for open educational resources. In Pro-
ceedings of the 16th ACM international conference on
Supporting group work, pages 273–282. ACM.
Ma, J., Han, X., Yang, J., and Cheng, J. (2015). Examining
the necessary condition for engagement in an online
learning environment based on learning analytics ap-
proach: The role of the instructor. The Internet and
Higher Education, 24:26–34.
Madhulatha, T. S. (2012). An overview on clustering meth-
ods. IOSR Journal of Engineering Apr, 2(4):719–725.
Nortvig, A.-M. and Christiansen, R. (2017). Institutional
collaboration on moocs in education—a literature re-
view. International Review of Research in Open and
Distributed Learning: IRRODL, 18(6):306–316.
Novak, E., Urban
ˇ
ci
ˇ
c, J., and Jenko, M. (2018). Prepar-
ing multi-modal data for natural language processing.
Proceedings of SiKDD.
Shelton, B. E., Duffin, J., Wang, Y., and Ball, J. (2010).
Linking open course wares and open education re-
sources: creating an effective search and recom-
mendation system. Procedia Computer Science,
1(2):2865–2870.
Wise, A., Zhao, Y., and Hausknecht, S. (2014). Learning
analytics for online discussions: Embedded and ex-
tracted approaches. Journal of Learning Analytics,
1(2):48–71.
Yan, M., Sang, J., Mei, T., and Xu, C. (2013). Friend trans-
fer: Cold-start friend recommendation with cross-
platform transfer learning of social knowledge. In
2013 IEEE International Conference on Multimedia
and Expo (ICME), pages 1–6. IEEE.
Users’ Learning Pathways on Cross-site Open Educational Resources
95
