
A Simple Scenario-based Qualitative Model for Assessing Start-up
Risks
Y. Ayse B. Nordal
Undervisningsbygg Oslo, KF 0605, Oslo, Norway
Keywords: Start-up, Risk Model, Scenarios, Likelihood Barometer, ISO 31000:2018.
Abstract: ISO 31000:2018 Risk Management Guidelines and COSO:2017 Enterprise Risk Management framework
have two important and common characteristics. Firstly, they connect risks with business objectives. Secondly,
they define risks as potential events that represent both positive and negative deviations from the expected.
When a start-up company assesses its risks, the readily available source often consists of a blog-post on
enterpreneurship that defines for instance 5, 10 or 15 potential events, which may represent negative
consequences for its growth and development. Only some of these sources offer a classification of the risks
so that the given start-up can see whether these risks are spread on different areas/dimensions or if they are
accumulated in a few areas. To date, there are no easily available models which visualize the focus areas that
the start-up ought to give priority to and treat with actions.This paper aims to contribute to solve the above-
mentioned challenges by introducing a scenario-based model, which takes into account risks as well as
opportunities in accordance with ISO 31000:2018. The model defines 4 complex risk dimensions/focus areas,
each of them consisting of 10 elements and 60 potential scenarios. The scenarios are ranked in accordance
with the degree of contribution to a start-up’s risks and opportunities. The results of the scenario analysis are
summarized through the use of a likelihood barometer. The barometer visualises whether the start-up’s risks
and opportunities are concentrated on one risk dimension, or whether these are spread on several dimensions.
Thereafter, a traditional risk matrix is used to evaluate and rank the risks and opportunities which represent
the highest negative and positive contributions to the start-up’s failure or success.
1 INTRODUCTION
Start-ups tend to experience specific challenges when
they assess their risks and opportunities, especially at
the beginning of their venture:
1. They have limited benefits from the use of a
traditional risk matrix. This is due to a lack of
information, which would enable them to set up a
reliable likelihood scale for potential events. They
have neither statistical data nor experience data to
create a probability distribution of the potential
events, or to attach frequencies or probabilities to a
potential event.
As Leveson states “One problem in assessing
likelihood is that little real information is available
about the future, especially at the beginning of the
development process, when decisions about where to
focus efforts are made.” (Leveson, 2019). “(…)
Methods like market research, decision trees/ what- if
analysis will help to tackle this uncertainty to some
extent” (Nordal, 2015). However, a meaningful
likelihood scale, which could have been used in a risk
matrix, is not easily accessible.
2. Start-ups have limited resources and their
priority is to know where to set proactive controls to
hinder the likelihood of potential negative events and
to promote the positive ones. This necessitates a
creative process, which may build on a scenario
analysis since: “In complex settings, scenarios can be
used to identify a wide range of risks, rather than
existing or obvious risks. Therefore, a problem‐based
scenario may not start with a single issue (...) but aim
to identify all the relevant problems. The act of
scenario building opens up possibilities in a creative
manner, both with what might happen and what can
be done to prevent or promote those outcomes based
on whether they are viewed as harmful or beneficial”
(Jones, 2010).
The most harmful and most beneficial scenarios
will be given priority in action-settings.
3. Start-ups have limited resources to implement
sophisticated risk assessment processes. Organizing
98
Nordal, Y.
A Simple Scenario-based Qualitative Model for Assessing Start-up Risks.
DOI: 10.5220/0009389500980105
In Proceedings of the 2nd International Conference on Finance, Economics, Management and IT Business (FEMIB 2020), pages 98-105
ISBN: 978-989-758-422-0
Copyright
c
2020 by SCITEPRESS – Science and Technology Publications, Lda. All rights reserved

workshops for identifying risks, using computerized
solutions to analyze them, keeping risk registers and
formal reports may not be achievable for start-ups, at
least at the very beginning. On the other hand, start-
ups have a unique quality: “Having articulated their
business intent and emphasized the customer
connection, leaders give their people freedom within
a framework —the liberty to operate within well-
delineated boundaries—as well as opportunities to
influence key decisions, such as which strategies to
pursue or products to develop” (Gulati, 2019).
The risk management process of a start-up should
be customized and scaled to this reality. A likelihood
barometer may be a suitable tool in this regard. This,
as it allows for a creative process of evaluating the
scenarios and developing strategies to handle them.
2 MATERIALS AND METHODS
2.1 Materials
Risk management guidelines by the International
Organization for Standardization (ISO, 2018) has a
novel contribution to the definition of risks. Same as
in the 2009 issue, it defines risk as the effect of
uncertainty on objectives. However, in note 1 to said
definition a new element was introduced, as follows:
“An effect is a deviation from the expected. It can be
positive, negative or both, and can address, create or
result in opportunities and threats” (ISO, 2018).
This paper introduces a likelihood barometer that
employs said risk definition. The barometer includes
4 major start-up risk dimensions. Each of these
consists of 10 elements. Each element can materialize
as 6 different scenarios which affect the uncertainty
in positive or negative direction.
2.2 Methods
2.2.1 The Creation of a Likelihood
Barometer
The paper follows the classical tradition that a risk
may be expressed as:
R= L * C (1)
where L is likelihood and C is consequence (impact).
It is assumed that a start-up is exposed to 4 major risk
dimensions. These are:
(D1): Market access
(D2): Product characteristics
(D3): Line & support functions
(D4): Contracts and commitments
Further, it is assumed that every risk dimension
consists of 10 elements each. Every element may be
described by 6 scenarios which can have:
HN: High negative effect (3)
MN: Moderate negative effect (2)
LN: Low negative effect (1)
LP: Low positive effect (-1)
MP: Moderate positive effect (-2)
HP: High positive effect (-3)
On the risk element in question. A negative effect will
involve risks and a positive effect will involve
opportunities. These dimensions and elements are
presented in Table 1.
As seen in Table 1 “compliance with ethical and
legal standards” is one of the ten elements in the risk
dimension “product characteristics”. This element
can contribute to risks or to opportunities, depending
on the prevailing scenario which represents the start-
up’s reality.
Table 2 describes such possible scenarios and how
they are expected to affect risks and opportunities.
In the first scenario, the start-up delivers a
product/service, which may be in breach of existing
laws and regulations or is questioned based on the
ethical standards of society. An example may be a
computer game, which has discriminatory content or
a toy with toxic materials. This scenario will create
high risk in the product dimension.
The second scenario does not represent a legal or
ethical violation, but lack of knowledge or lack of
assurance of compliance. It is assumed that such lack
of assurance may create moderate risk
In the third scenario, some interest groups are
critical to the product. A product, which uses fur or
leather, may be a relevant example.
In the fourth scenario, the product complies with
laws and regulations and with the general ethical
standards of the society. This may mean a slight
opportunity, but not a competitive advantage. The
product or service delivers in accordance with the
expectations of the society.
In the fifth scenario, several interest groups in the
society support the use of the product from an ethical
point of view. The use of raw materials stemming
from the underdeveloped countries, an environmental
focus or universal design can be possible reasons for
such support.
The sixth scenario describes the greatest
opportunity. Here, the product has the support of
many
interest groups as well as the media and
A Simple Scenario-based Qualitative Model for Assessing Start-up Risks
99

Table 1: Risk Dimensions and Elements.
MARKET ACCESS PRODUCT
CHARACTERISTICS
LINE & SUPPORT
FUNCTIONS
CONTRACTS
&COMMITMENTS
Dependency on a single
product
Compliance with ethical and
legal standards
Organization structure Flexibility and terms of the
office space solution
Access to complementary
product market
Compliance with
environmental targets
Dependence on specialized
work force
Flexibility and terms of the
leasing agreements
Existence of substitutes on
the market
Degree of innovation
embedded in the product
Entrepreneurial experience Financial strength
Access to several customer
income segments
Universal design Knowledge about industry
standards
Liquidity
Possibility to offer
maintenance services to own
product
Product security Understanding the context Environmental commitments
Possibility to sell again
(repeat sales)
Access to raw materials Supplier and sub-contractor
operations
Legal commitments, product
warranties and other
liabilities
Patents and protection rights Price and terms Competition on human
resources
Support and grant schemes
The product is relevant only
for the luxury product
market
Production process features
and complexity
Outsourced activities Quality commitments to
customers
Access to international
markets
Technical requirements and
constraints
Cost structure The control system
Availability of multiple
market channels
Market readiness Payment schemes Commitments re.
certifications
Table 2: Choosing the Representative Scenario in Each Element.
HN
(3)
MN
(2)
LN
(1)
LP
(-1)
MP
(-2)
HP
(-3)
The product's
compliance with
ethical
standards or
laws &
regulations may
be questioned
due to specific
reasons.
The product’s
compliance with
all relevant laws
and regulations
is not evaluated.
Some groups in
the society may
be critical to the
use of the
product for
ethical reasons.
The product
complies with
all laws and
general ethical
standards.
Several interest
groups support the
use of the product
from an ethical point
of view.
Regulators, media
and many interest
groups support
the use of the
product from a
legal and ethical
point of view.
regulators.
The likelihood barometer model requires that the
given start-up identifies its representative scenarios
and the scenarios’ effect on risks and opportunities
for all elements, in each risk dimension.
Table 3 provided below illustrates the
identification of representative scenarios for all
elements.
In the theoretical example provided above the
start-up is given two important and relevant signals:
The market access dimension represents more
risks than opportunities and should be
given priority when the start-up defines its
policies and plans its actions
5 prevailing scenarios create high risks and
deserve attention when proactive controls are
going to be defined
FEMIB 2020 - 2nd International Conference on Finance, Economics, Management and IT Business
100
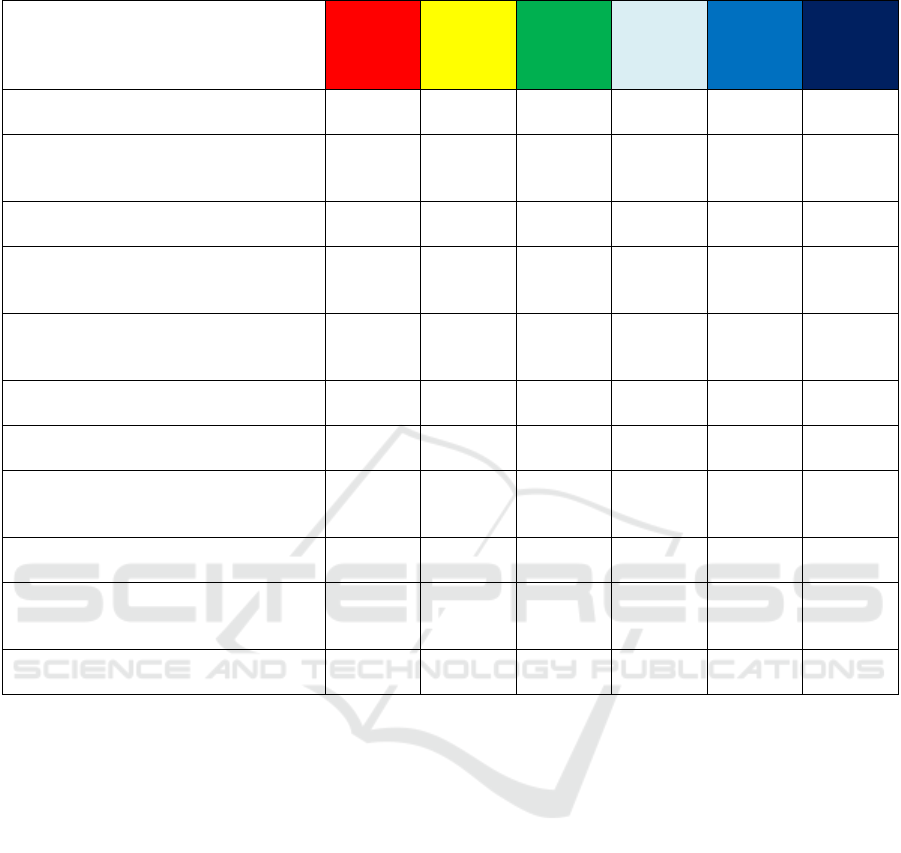
Table 3: Representative Scenarios for All Elements in a Dimension.
HN
(3)
MN
(2)
LN
(1)
LP
(-1)
MP
(-2)
HP
(-3)
1. Dependency on a single product X
2. Access to complementary product
market
X
3. Existence of substitutes on the market
X
4. Access to several customer income
segments
X
5. Possibility to offer maintenance
services to own product
X
6. Possibility to sell again (repeat sells) X
7. Patents and protection of rights X
8. The product is relevant only for the
luxury product market
X
9. Access to international markets X
10. Availability of multiple market
channels
X
Sum 5 2 0 2 1 0
The last step in the creation of the likelihood
barometer is to set up the complete picture for all
dimensions which are defined in Table 1. The total
likelihood picture for the given start-up is defined in
Table 4.
The start-up’s likelihood barometer visualizes the
information, which is found in Figure 1.
The likelihood barometer in the example provided
above indicates the following:
The dimension “Product Characteristics” is
the start-up’s strength. The prevailing scenarios
indicate opportunities, which may be utilized and
optimized. Thus, the start-up should focus on
strengthening existing opportunities in this
dimension
The scenarios attached to “Line and support
functions” represent “Low risk”. If these risks
are treated correctly, they may contribute to the
success of the start-up
The start-up should treat the “Market access”
and “Contracts and commitments” dimensions
proactively, introducing control actions to hinder
that these scenarios are actualized or reduce their
duration
2.2.2 Setting up Impact Criteria
Likelihood is only one aspect of risk. This paper and
its underlying model express risk as a product of
likelihood and consequences (impact). Thus, in the
next step the paper seeks solutions to the following
issues:
a. Setting up criteria for impact (consequences)
b. Extracting information from the multi-
dimensional likelihood barometer for further use
in a risk matrix
This paper’s underlying model employs impact
criteria used by many prior studies (Curtis P & Carey
M, 2012). The easiest approach with 3 impact types
and 3 impact levels are defined. The following impact
types are assumed to be relevant and significant for a
start-up:
A Simple Scenario-based Qualitative Model for Assessing Start-up Risks
101
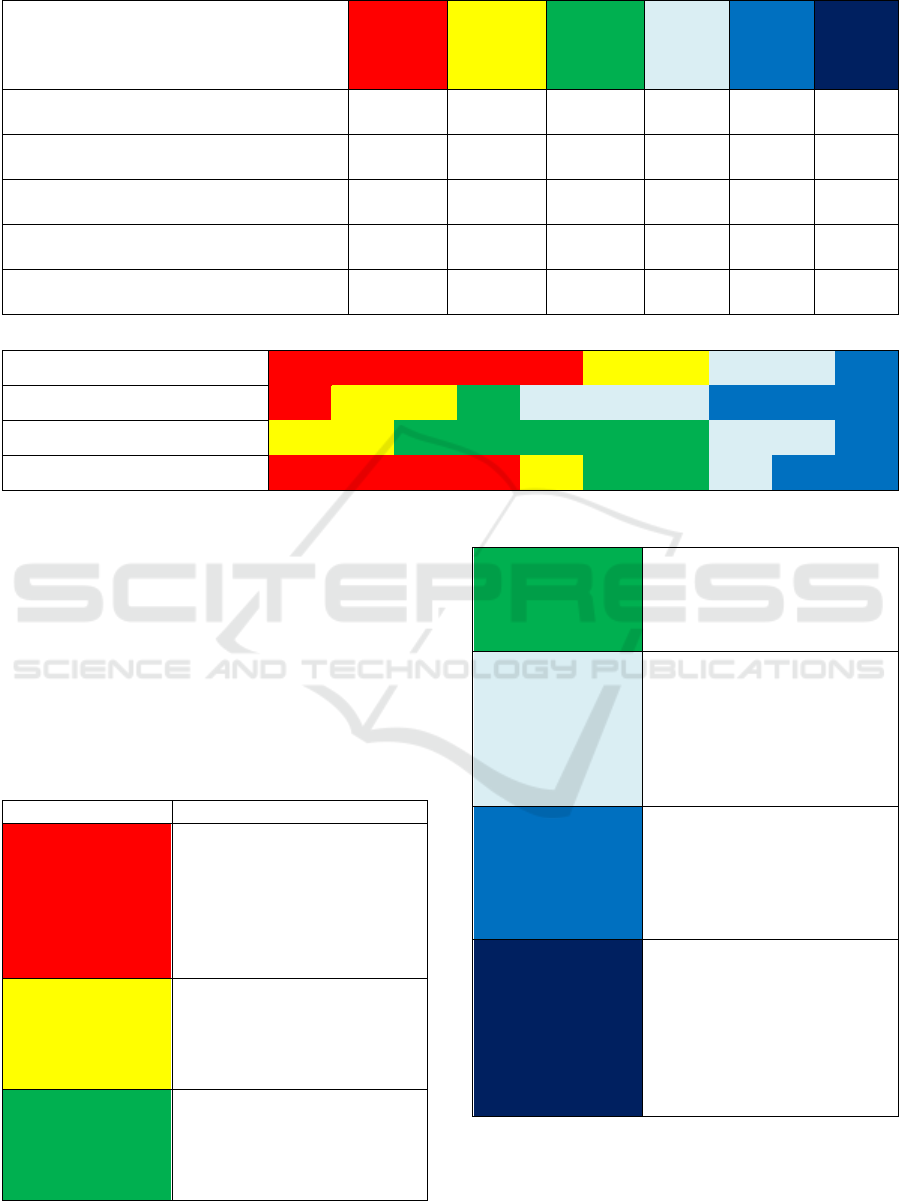
Table 4: The total likelihood profile.
Likelihood profile -Totals
HN
(3)
MN
(2)
LN
(1)
LP
(-1)
MP
(-2)
HP
(-3)
Market Access 5 2 0 2 1 0
Product Characteristics 1 2 1 3 3 0
Line & Support functions 0 2 5 2 1 0
Contracts & Commitments 4 1 2 1 2 0
Totals 10 7 8 8 7 0
Market Access
Product Characteristics
Line & Support functions
Contracts & Commitments
Figure 1: The likelihood barometer.
Financial consequences
Media coverage
Talent attraction
Table 5 shows the impact (consequence) matrix for
the start-up example provided above. The
consequences presented in the figure is related to a
specific time period, for instance a year or a planning
period:
Table 5: The impact (consequence) criteria.
Consequence/Level Criteria
HN
(3)
Extra costs, more than
20 % of the budget
Negative comments in
the media, more than 20 news
articles
Staff turnover, more
than 15 %
MN
(2)
Extra costs, 10-20% of
the budget
Negative comments in
the media, 10-20 news articles
Staff turnover, 5-15 %
LN
(1)
Extra costs, less than 10
% of the budget
Negative comments in
the media, less than 10 news
articles
Staff turnover less than
5 %
LP
(-1)
Extra income, less than
10 % of the budget
Positive comments in
the media, less than 10 news
articles
Less than 20
applications to vacant positions
MP
(-2)
Extra income, 10-20 %
of the budget
Positive comments in
media, 10-20 news articles
20-50 applications to a
vacant position
HP
(-3)
Extra income, more
than 20 % of the budget
Positive comments in
the media, more than 20 news
articles
More than 50
applications to a vacant
position.
FEMIB 2020 - 2nd International Conference on Finance, Economics, Management and IT Business
102
2.2.3 Visualizing the Results through a
Simple Risk Matrix
Three assumptions are made in order to transfer
information from a multi-dimensional likelihood
barometer into a two-dimensional risk matrix.
Table 6 gives an overview of these assumptions.
In the table, the concept “dimension” refers to the
four dimensions, which are described in Table1, i.e.:
“Market access”, “Product characteristics”, “Line
& support functions” and “Contracts &
commitments”. The concept “representative
elements” refers to the highest total number of
elements, which are described in each row of the
likelihood profile. This number reflects the
underlying scenarios, which are assumed to be
relevant in the given dimension.
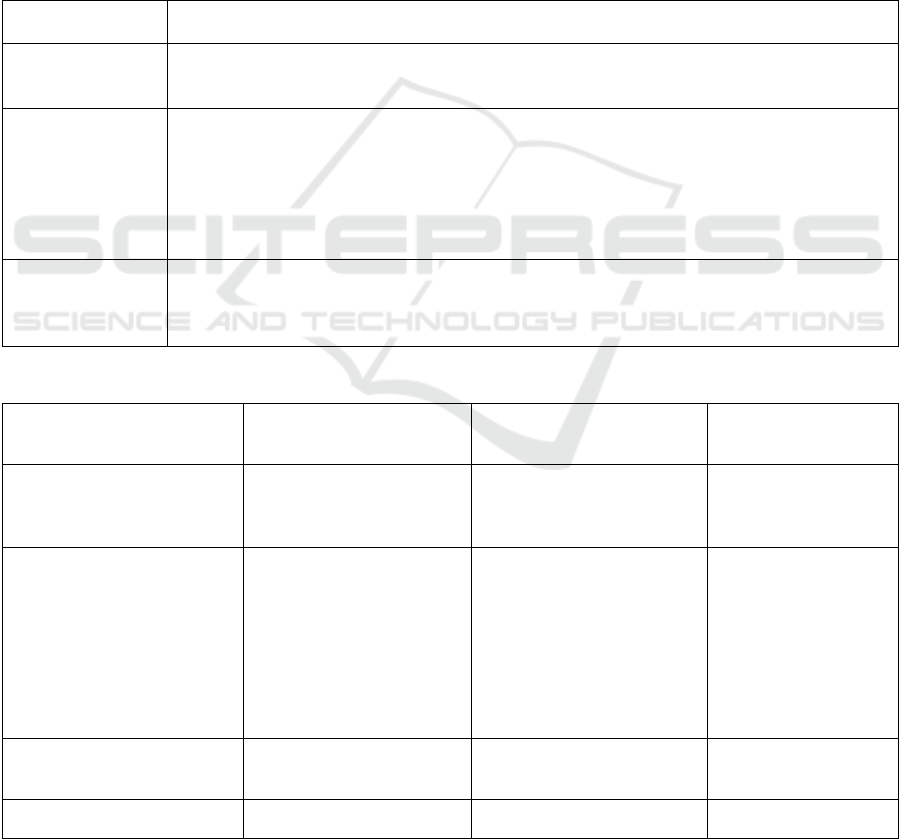
3 RESULTS
Table 7 includes information from the likelihood
barometer in accordance with assumptions shown in
Table 6. We assume that the start- up has evaluated
the impact (consequence) - figures in accordance with
Table 5 and chose the values shown in column 3 of
Table 7. Based on these figures, the start-up’s risk
matrix is derived as follows:
Table 6: Assumptions about likelihood.
Assumptions Criteria
Assumption 1 The highest number in the likelihood profile decides the ranking of likelihood, i.e. whether risks
or opportunities are likely and whether the likelihood is low, medium or high
Assumption 2 If the likelihood profile has two or more equal numbers as either the highest number in the same
dimension, all indicating risks or opportunities, then the consequence figures will decide the final
ranking of the risks/opportunities.
If the consequence figures are also the same, then the results indicate a border case where
attached scenarios in both categories require attention.
Assumption 3 If the likelihood barometer has two or more equal numbers in opposite directions then the results
indicate a case, which is mentioned in ISO 31000, “a deviation from the expected, positive,
negative and both”.
Table 7: Likelihood, consequence (impact) and risk.
Dimension Likelihood value Consequence (Impact) level in
accordance with Table 5
Risk= L*C
Market Risks 3: Highest number is 5. 5
elements refer to category
HN.
2 6
Product
Characteristics
Category LP and category
MP have equal numbers. 3
elements refer to each.
-1: 3 refers to category LP
-2: 3 refers to category MP
-1
-1
-1
-2
Line and Support Functions 1: Highest number 5 refers to
category LN
2 2
Contracts & Commitments 3: Highest number 3 9
A Simple Scenario-based Qualitative Model for Assessing Start-up Risks
103

-9 -6 -3 3 Market risks 6
Contracts &
Commitments
9
High
likelihood (3)
-6 -4
Product
Charact. -2 2 4 6
Medium
likelihood (2)
-3 -2
Product
Charact. -1 1
Line and
support func.
2 3
Low
likelihood (1)
HP impact MP impact LP impact LN impact MN impact HN impact
Figure 2: The Risk Matrix for the start-up.
The risk matrix indicates that the start-up should
introduce measures and controls to handle the
underlying scenarios attached to “Contracts &
commitments” and “Market risks”. Stimuli should be
introduced to motivate and accelerate the scenarios
attached to “Product Characteristics”.
4 DISCUSSION
The model presented in this paper can be viewed as a
first step in creating an elaborate risk assessment
model for start-ups. However, from a scientific point
of view, it suffers from the weaknesses associated
with the qualitative approach, among others:
a. The selected risk dimensions might not
represent the complete picture which is relevant
for the start-up
b. The scenario descriptions are subjective and
might not be realistic for all start-ups
c. The scenarios may be correlated
d. The scenarios may represent cause-and-effect
relations
e. Different risk elements in a certain risk
dimension might not necessarily have equal
weight
f. The arguments for the consequence (impact)
scale might not be realistic
5 CONCLUSION
Despite these weaknesses, the author thinks that the
model can help start-ups to approach their risks and
opportunities in a structured manner, without the
support of a software or a facilitator.
An EXCEL-model which is based on the above-
mentioned assumptions has been discussed with and
tested by a start-up called Bag’ In. The owner has
found the suggested risk elements and dimensions
realistic.
Several Norwegian start-ups are willing to test the
model. The following actions are planned:
Testing of the model by a statistically
significant sample of start-up companies in
Norway, in order to validate the relevance of risk
dimensions and elements.
Discussing the results with authorities which
fund growth companies and clusters
Discussing the results with banks
Developing the model further to differentiate
better between start- up and scale-up risks and
opportunities.
ACKNOWLEDGEMENTS
This paper and its underlying model have highly
benefited from the feedback of Regional Manager
Iselin Nordal with Qualisoft Norway, Head of Retail
at Avinor Elif Runa Nordal and Ole Martin Kjørstad
with the Central Bank of Norway. Kjørstad has
contributed to visualising of the model. The CEO of
Bag’In, a successful Norwegian start-up, Kåre
Sekkesæter has given invaluable feedback to the
suggested scenarios.
I agree with Mr. Sekkesæter on his words “You
can never succeed if you don’t dare to ask others for
help to develop your ideas.”
FEMIB 2020 - 2nd International Conference on Finance, Economics, Management and IT Business
104

REFERENCES
Curtis, P & Carey, M (2012). Risk Assessment in Practice.
Research commissioned by COSO to Deloitte and
Touche LLP. Retrieved 4 August 2019, from
https://www2.deloitte.com/content/dam/Deloitte/globa
l/Documents/Governance-Risk-Compliance/dttl-grc-
riskassessmentinpractice.pdf
Gulati, R. (2019). The Soul of a Start-Up. Retrieved 4
August 2019, from https://hbr.org/2019/07/the-soul-of-
a-start-up
International Organization for Standardization (ISO)
(2018). Risk Management Guidelines. Geneva,
Switzerland
Jones, R. H. (2010). The use of scenarios in adaptation
planning: managing risks in simple to complex settings.
Melbourne: Victorian Centre for Climate Change
Adaptation Research
Leveson, N. (2019). Improving the Standard Risk Matrix:
Part 1. Retrieved 1 October 2019, from
http://sunnyday.mit.edu/Risk-Matrix.pdf
Nordal, Y., A., B. (2015, 29-31 May). Risk Management
Practices, Decision Making and Corporate
Governance. International May Conference on
Strategic Management - IMKSM2015, Bor, Serbia
PricewaterhouseCoopers LLP; Committee of Sponsoring
Organizations of the Treadway Commission (COSO).
(2017) Enterprise Risk Management: Integrating with
Strategy and Performance. New York: COSO
A Simple Scenario-based Qualitative Model for Assessing Start-up Risks
105
