
How to Better Form Software Development Teams?
An Analysis of Different Formation Criteria
Sérgio Cavalcante
1
, Bruno Gadelha
1
, Edson César de Oliveira
2
and Tayana Conte
1
1
Department of Computing, Universidade Federal do Amazonas (UFAM), Amazonas, Brazil
2
Secretaria de Estado da Fazenda (SEFAZ), Amazonas, Brazil
Keywords: Software Development Teams, Team Staffing, Allocation, Team Longevity, Self-Selection Teams, Leader
Selected Teams, Multi-project Organizations.
Abstract: In the competitive world of the on-demand software development market, some practices that increase
companies' chances of delivering better results turn out to be an essential differentiator. Several studies in the
literature discuss numerous criteria used by companies in the formation of teams. This research aims to
analyze the criteria and factors in the formation of software teams and their impacts on the value perceived
by the customer of the deliveries. We collected 31 project results scores of an R&D organization and
performed a quantitative analysis comparing teams formed using two selection criteria: self-selection versus
leader selection. We observed a statistical significance in the comparison between the selection criteria when
tested with the longevity factor. Our results indicated that the self-selection team formation criteria had impact
on value delivered to the customer. We also noticed this impact when, besides being self-selected, the team
was also long-lived.
1 INTRODUCTION
Organizations that develop software on-demand need
customers to pay their operating costs (Helander &
Ulkuniemi, 2012). It is necessary to identify, attract,
and make project proposals for customers. If a
proposal is accepted, the customer receives the agreed
deliveries and makes the expenditure. Therefore, an
essential step for these organizations is the process of
generating this software project proposal that is
tailored to face customer's needs. In order to support
the customer's decision-making on contracting the
service offered, the proposal should include a project
plan at some level of detail. It has to contain
information like budget, schedule, resources, and
scope. Once the proposal is accepted, the organization
must form a development team funded by the project
budget (Project Management Institute, 2008). Then
the software is built, requirement by requirement,
respecting schedule, budget, scope, and quality
constraints (Project Management Institute, 2008).
The software organization responsible for developing
the application must deliver an outstanding result. As
a consequence, their customers could become
satisfied with the work done, encouraging renewals,
and financing more projects with the organization
(Mehta et al., 2008).
A following moment in this project proposal
process is the formation of an appropriate team for the
project execution. This team will build the resulting
product to be delivered for the customer, in order to
keep their satisfaction on a high level, intending to
influence their future relationship with the software
organization positively (Helander & Ulkuniemi,
2012). Providing adequate attention at the moment of
forming the development team is critical. Previous
reports (Standish Group, 2014) show that team
conflicts cause 42% of the cases of software failures
and also cause 52% of the time on correctly
addressing customer demands. Therefore, the
software organization also needs to identify which
team formation criteria should use to form an
appropriate team in order to achieve the software
project success from the client's perspective (Evans,
2002). Also, in companies that develop software on
demand, where the man-month (people effort during
project time) is part of the cost of the project, factors
such as team size and percentage of dedication can
affect the final price of the project proposal and must
be considered (Heričko et al., 2008).
90
Cavalcante, S., Gadelha, B., César de Oliveira, E. and Conte, T.
How to Better Form Software Development Teams? An Analysis of Different Formation Criteria.
DOI: 10.5220/0009388000900100
In Proceedings of the 22nd International Conference on Enterprise Information Systems (ICEIS 2020) - Volume 2, pages 90-100
ISBN: 978-989-758-423-7
Copyright
c
2020 by SCITEPRESS – Science and Technology Publications, Lda. All rights reserved

Thus, our research question is: how to better form
software development teams?
This paper investigates if the chosen criteria and
factors considered on the formation of software
development teams impacts customer satisfaction
assessment. Through a quantitative study, we
investigated the relationship between team formation
and customer evaluation scores. We collected data at
an R&D organization with 127 people working on
several simultaneous projects. We used data from 31
projects, developed over three years, that had a final
score given by the client.
We organized the remainder of the paper as
follows. Section 2 presents the theoretical bases for
conducting this research. Section 3 describes our
research method
employed and the data collection.
Section 4 describes the main results by comparing the
team forming criteria. In Section 5, we discuss the
paper findings. Finally, in Section 6, the conclusions
are addressed, and we present some final remarks.
2 BACKGROUND
In this section, we describe the context of our study.
We describe the resource allocation, forming teams
criteria, and forming teams factors. We also briefly
describe the Customer Value Perception, which is the
way that this study measures Customer Satisfaction
with the organization project deliveries.
2.1 Resource Allocation
Allocation is the activity of assigning an activity to be
done to a human resource, making him/her
responsible for it (Park et al., 2015). This allocation
work is a crucial factor for the success of a project
(Tsai et al., 2003). Barreto et al. (2008) affirm that the
allocation effort in companies is complex. They
mention that the combinations of available people and
tasks to be done on a given example of ten people and
ten tasks reach ten billion possibilities (ten raised to
the tenth power). Besides, they also mention that
several constraints must be considered, such as
organizational needs, maximum monthly team cost,
development time, and developers' knowledge of
project requirements. So, the task allocation usually
has an earlier moment, which is the formation of a
team. It would be an extreme effort to think about
allocation tasks with all the available people in mind.
This way, the alternative is to allocate people in
teams, and after that, the team members can be
assigned to project tasks. Next, we will present
criteria and factors to consider when forming these
teams.
2.2 Forming Teams Criteria
Team forming is an activity to staffing a team to
develop a software initiative (Barreto et al., 2008).
Among the stages of this construction, we highlight
the moment to select the people who will compose
this team. In this step, this article will address the
leader selection and self-selection criteria, which we
will detail in the following sections.
2.2.1 Leader Selected Team (LS)
One of the forming criteria from literature is that a
person, usually a project manager, selects experts
from a resource pool, which are the organization
employees, selected and trained on the technologies
of projects that organizations have to develop (Ngo-
The & Ruhe, 2009). So, this a top-down selection.
With the project plan in place, the project manager
assesses which technologies would be involved in the
context of the project, checks the pool of human
resources with their mapped competencies, and
assemble the team choosing the best case for
resource-task allocation over time (Abdel-Hamid,
1989; Project Management Institute, 2008). After the
project is complete, the team is disbanded to re-
compose the human resources pool, which is again
available for a new project. Thus, the main idea is
forming a temporary team to execute a single
software project, with its technological requirements
as the director of its formation. In this article, we call
this criterion Leader Selected Teams (LS).
The main benefits expected with this approach
are: (i) this team has specialists in the project
technical requirements; (ii) motivation through job
rotation in several projects (Santos et al., 2016).
However, this criterion requires stable environments
and well-defined scopes. If the scope changes, as well
as the technologies involved, a human resource that
could be critical at a project may become completely
expendable. This criterion still has the problem of
specialists synchronizing their work in more than one
project. Therefore, this allocation plan, based on
technology requirements, should be considered as a
type of draft, frequently revised, and its tasks quite
detailed (Hendriks et al., 1999).
There is a belief that allocating a team of people
with the necessary skills reduces the risk of project
delay and failure, achieving a positive outcome
(Eskerod, 1998). However, a problem that arises with
this type of allocation is that a new team is formed
How to Better Form Software Development Teams? An Analysis of Different Formation Criteria
91

every time a new project starts. Due to their new
staffing, this team would not have a synergy, all
team’s production is still primarily based on
individual work (Tuckman & Jensen, 1977).
Moreover, this criterion assumes that a team is the
sum of its “task-performing” parts, focusing on
individual accomplishment and the success of the
resource allocated to the task, not considering the
collaboration, the synergy, and the productivity of a
team (Katzenbach & Smith, 1993).
Choosing the best resources to form a team is also
an optimization challenge. Some authors suggest
tackle the allocation problem using optimization
techniques commonly used in SBSE (Search-Based
Software Engineering) such as fuzzy logic (Britto et
al., 2012) or particle swarm algorithms (Gerasimou et
al., 2012). Another alternative is to use genetic
algorithms and linear programming to try to optimize
the process of selecting a group of people who have
the right skills that can solve the problems that the
activities bring (Ngo-The & Ruhe, 2009; Park et al.,
2015; Shan et al., 2010) Despite these support tools,
it still much depends on the intuition and experience
of the project manager, and ultimately he/she can
make the wrong choices and not allocate the best
resources to the project team (Barreto et al., 2008).
2.2.2 Self-Selected Teams (SS)
A non-predictive criterion for forming a team is
through self-allocation (Potosky & Duck, 2007). In
this case of team formation called Self-Selected
Team (SS), team members choose their components
through a pre-established method. Thus, instead of a
Project Manager choosing the resources to assemble
a team, the members have the autonomy to organize
themselves into teams, choosing by personal or
technical affinity (Scott & Pollock, 2017). This self-
allocation can follow certain constraints established
by the organization that would be some factors to
consider, for example, size, essential roles and
dedication percentage. It can also be temporary,
running this self-selection from time to time (Mamoli
& Mole, 2015), or can be used to form stable teams.
The organizations expected some benefits with
this approach: (i) this team bets on a sense of
teamwork rather than individual work, with the same
support commitment and fast learning; (ii) agility
regarding changes in scope; and, (iii) autonomy when
allocating to tasks. An additional expected benefit of
this type of allocation would be a reduced number of
conflicts in the team (Tuckman & Jensen, 1977). As
the members chose each other, it makes sense to think
that they would strive to seek conflict outputs more
constructively, preserving the foundations of the
team, thereby advancing its maturity stage.
However, this team may not have some technical
skills needed to solve some technical challenges
required by the project they will be carrying out,
different from the Leader Selected Tem of
Specialists. Besides, another problem would be that
this team would also have low synergy and still need
to discover how to work efficiently together
(Tuckman & Jensen, 1977).
In our review of the literature, we found few
papers that cite self-selected teams, most of them
student choices to form teams for schoolwork (Bacon
et al., 2001; Caglayan et al., 2013; Potosky & Duck,
2007). Nevertheless, we find a book (Mamoli &
Mole, 2015) that speaks widely about the subject and
even describes a method to facilitate this formation.
2.3 Forming Teams Factors
Some factors that can impact the performance of
software teams, such as autonomy, team size, turn-
over, communication, among others (Dutra et al.,
2015). In this section, we will consider and detail
some factors that exist in the context of the
organization and assess their impact on the customer
perceived value of team deliverables, which will be
team longevity (resulting in stable or temporary
teams), resource dedication profile and project
dispersion factor.
2.3.1 Stable Teams – ST
The idea of maintaining a Stable Team (ST) is that a
group that has spent the entire life of a project
together would lead the team to a better performance
stage (Tuckman & Jensen, 1977). It would be more
productive because of its longevity (Katz, 2006).
Additionally, a report from CA Technologies
mentions that stable teams' productivity would reach
60% more when compared to temporary teams'
productivity (CA Technologies, 2013). So, even if
there is some technological gap in the team,
teamwork would prevail over individual results,
generating support, quick learning, and,
consequently, the success of the project (Katzenbach
& Smith, 1993). With this repeatedly learning, this
approach generates more generalist teams.
2.3.2 Temporary Teams – TT
We will call Temporary Teams (TT), groups of
people who have not necessarily worked together
before but have been joined to form a team over the
life of a project. Prikladnicki et al. (2017) show how
ICEIS 2020 - 22nd International Conference on Enterprise Information Systems
92

selecting people who have never worked together to
form teams, can be better for a company. Prikladnicki
et al. (2017) cite the work of Uzzi and Spiro (2005)
and argue that forming new teams, based on the
dissolution of other teams, increase the members'
network of connections and their soft-interaction
skills. That would contribute more to the project
success than relationships with people within a long-
lived group that are part. They studied a large
company of projects of different types and duration
and even found that teams of people who have never
worked together are better, depending on the
duration. They conclude that it is generally better to
mix members who have worked and never worked
together because these new members bring
knowledge, norms, and processes from previous
projects, but new ones would bring new ideas.
2.3.3 Other Factors
Hendriks (1999) cites two factors about using one
specialist resource among projects: (i) the project
dispersion factor and (ii) the resource dedication
profile. The dispersion factor is described as the
division of projects into technically defined modules
for the allocation of one or more specialists in these
tasks. The more different technical tasks, the more
different specialists, the bigger the team, the higher
the coordination and synchronization effort. The
author suggests that the dispersion factor, along with
the dedication profile, has a profound impact on
allocation complexity.
The resource dedication profile is how much that
resource is dedicated to a project and its objectives
and not just to the tasks, i.e., how much the resource
is allocated and committed entirely to a single project
(Hendriks et al., 1999). The lower the resource
dedication per project, the more complex the
allocation. Additionally, this dedication profile also
affects productivity. Software teams with dedicated
resources at allocation percentages of 95% or more
can double their productivity than teams with
allocation percentages of less than 50% (CA
Technologies, 2013).
Therefore, it is better to keep the resource entirely
allocated in only one project, and if it is not possible,
lessen the impact of the scatter factor by not
allocating the resource in too many projects.
2.4 CVP – Customer Value Perception
In order to get project feedback and validate the
customer value perceived on project deliveries, the
organization collects the CVP (Customer Value
Perception) score.
Some companies mention about delivering value
but do not provide a method to collect and measure it
(Mehta et al., 2008). Some cite that some companies
make use of surveys to do it (Evans, 2002). The
selected organization sends a survey to the customer
in which the customer gives a score from 1 to 5 to the
project delivery, followed by an optional comment
after delivery is done.
With this information received from the customer,
the team receives feedback about their work and
stores this value in the portfolio management tool to
analyze whether it is improving concerning
effectiveness. This score became the most important
metric for the organization because the company
keeps the focus on fulfilling the customer's desire in
order to enable more projects with him.
3 METHOD
This research is a case study with a holistic view of
the context of an R&D organization where its
software development teams are studied (Wohlin et
al., 2012). The method employed comprises the
following tasks: data collection, data treatment, and
quantitative analysis. Next, we describe the
organization context and explain when the selection
criterion has changed and how it affected the teams
formed. Then, the following sections detail the tasks
mentioned above:
3.1 Organization Context
The selected organization is an R&D (Research and
Development) institute that develops on-demand
projects in a service delivery model. In order to
conduct this research, we needed to collect several
organizational data about the projects developed in
the portfolio management tool.
The candidate projects happened from 2016 to
2018/2019 (started in 2018 but ended in 2019) after
the organization became an independent institute and
had to become more competitive. New knowledge
was necessary, and among them, how to form
software teams in order to retain customers and
employees.
The criterion formerly used was forming
temporary teams specializing in the technological
challenges of the demands that arose, but the
organization glimpsed other ways of improving team
forming activity. The new idea was to assemble more
generalist teams, so they could be able to execute
How to Better Form Software Development Teams? An Analysis of Different Formation Criteria
93

projects with different challenges. Also, betting on
criteria and factors that could increase members'
autonomy, the company aimed to form more
motivated and productive teams. An organizational
change in these proportions could be very disruptive,
so it must take some caution to avoid economic
problems, but the benefits could overwhelm the
problems that could arise (Bider & Söderberg, 2016).
In February 2017, the organization tested an
alternative team formation criterion. In addition to the
criterion, it was also necessary to define some
constraints that teams should follow in this formation:
Selection Criteria: People would choose whom
to work with by affinity. Thus, it is expected that the
team will go through the initial moments of conflict
faster and gain rapport and synergy by learning to
work together soon, as they chose to form the team by
their affinity. The method was based on Mamoli and
Mole’s book (Mamoli & Mole, 2015);
Team Basis: The first role of the new team would
be the Product Owner role. He/she would explain
what types of projects they would like to work on and
that they would bring to the team;
Size: Each team would have a base size of 6
people and would consist of 1 PO (Product Owner),
one designer, three developers, and 1 test developer,
entirely dedicated to a single project. According to
(Rubin, 2012), there are several benefits of keeping
small teams: (i) in small teams there is less social
loafing, people who exert less effort because they
believe others will take over the job, which is called
Ringelmann Effect (Ingham et al., 1974); (ii)
constructive interactions are more likely to occur in a
small team (Project Management Institute, 2008); (iii)
less times in is spent coordinating efforts; (iv) small
teams are more satisfactory to their members; and, (v)
harmful overspecialization is less likely to occur.
Dedication: Each member would have full
dedication without dividing between other projects.
The rationale behind this chosen factor: (i) the
dedicated Product Owner would have only one
product in mind and focus on its success; (ii) a
dedicated designer can do more than only generate UI
specs. He/She can help in conducting product
specification sessions, helping to define and improve
project products, as well as performing usability tests;
(iii) three developers help to implement software best
practices, such as code review (this number considers
absence that could occur among the 3, such as
vacation or illness); and, (iv) a dedicated tester can do
manual testing as well as design automated tests and
even help to develop features.
Longevity: These teams would continue together
after the project end and may become a stable team
(at least 60% of the team members).
This action of changing the way teams was
formerly formed in the organization generated three
teams with these characteristics that ran nine projects
between February 2017 until August 2018; Along
with the other projects from 2016 to 2019, they
compose the database analyzed in this research.
3.2 Data Collect
Data related to executed projects were extracted and
tabulated through the organizational portfolio
management tool. Table 1 presents the consolidated
list of project data that could potentially be relevant
for analysis. We selected the following data from the
Portfolio Management tool:
• Team Forming Criterion: Choice Criterion
(Self-Selected team by affinity (SS) or Leader
Selected team of specialists (LS) and Longevity:
Stable Team (ST) or Temporary Team (TT).
• Results: CVP final delivery scores, collected
from the customer, as explained in Section 2.4;
• Project Data: Project ID, start, and end dates.
Additionally, we validated the legitimacy of this
data individually with at least one member of each of
these projects
3.3 Data Treatment
It was necessary to treat the data used only to consider
the relevant info to this research. The criteria
employed to select the data were:
• Exclusion of 2015 data - We considered only
projects executed from 2016 until 2018/2019. We
used this filter by the fact that, even though we had
data available from 2015, in this year the previous
“maintainer” (an associated company that financially
guaranteed the operations of the Institute) left,
leaving the company with many people dislocated,
requiring dismissals to avoid expenses with people
without projects to pay them;
• Exclusion of basic research projects, primarily
hardware projects, process engineering and validation
projects (only tests) because they have no software
development as their main context;
• We excluded external projects because the
organization only made people available to these
initiatives from partner organizations;
• Projects that did not need a full team, and only
one expert who is out of the objective of this research
scope;
ICEIS 2020 - 22nd International Conference on Enterprise Information Systems
94
• Self-funded projects, where the client is the
organization itself, were maintained because they
were software projects.
• Third parties were disregarded as part of the
team as they do not even work within the company
and perform particular and timely tasks such as
software integration with legacy systems;
• Managers and Agile Coaches were disregarded
as part of the development team. Managers are
usually not part of the team's daily life, taking care of
more bureaucratic things like the financial and legal
aspects.
3.4 Quantitative Analysis
After data collection and processing, leaving 31
projects, following our method, we performed a
quantitative analysis of project data to assess whether
there is a significant difference between team forming
criteria. For this, the dependent variable observed was
the CVP score.
We made three comparisons, combining the
selection criteria and longevity factor, to verify if
there would be statistical relevance:
• Stable Teams (ST) and Temporary Teams
(TT) - Comparing only the “Longevity” factor; There
were already actions in the organization of not
forming new teams and merely taking advantage of
keeping teams stable and bringing projects to the
team as we can see in Table1. As we mentioned in
section 2, stable teams seem to be more productive,
so it might be relevant to show the comparison of the
result of those projects where the factor was
longevity.
• Self Selected Teams (SS) and Leader Selected
Teams (LS) - Comparing the selection criterion in the
context of the organization. We aimed to verify if the
autonomy given to the teams form themselves by
affinity would impact the customer perception of the
project deliverables;
• Self Selected Stable Teams (STT) and
Temporary Specialist Teams (TET) - Combining
the selection criteria and longevity factor to verify if
this combination had an impact on customer
perception of project deliverables.
A fourth possible combination, which would be
Self-Selected Temporary Team versus Leader
Selected Stable Team, was not made because the
sample of the Self-Selected Temporary Team is too
small, with only one project.
We performed a normality test for each
comparison to support the choice of the method of
statistical analysis. We performed all statistical tests,
1
https://www.ibm.com/products/spss-statistics
both normality and auxiliary graph plotting using the
statistical tool SPSS (Statistical Package for the
Social Sciences)
1
. We also used Boxplot analysis to
visualize possible differences between groups and
variables better.
4 RESULTS
Table 1 shows the final CVP scores of the 31 projects
analyzed in the descending order of CVP score, the
forming team selection criteria, and the longevity
factor for each project. We can see that CVP scores
range from 3 to 5.
Table 1: Project List.
Project Selection Longevity CVP
Prj1 LS ST 5
Prj2 SS ST 5
Prj3 SS ST 5
Prj4 SS TT 5
Prj5 LS TT 5
Prj6 SS ST 5
Prj7 SS ST 5
Prj8 SS ST 5
Prj9 LS TT 5
Prj10 LS ST 5
Prj11 LS TT 4.5
Prj12 LS ST 4.4
Prj13 LS ST 4.05
Prj14 LS ST 4
Prj15 SS ST 4
Prj16 LS TT 4
Prj17 LS ST 3.85
Prj18 LS TT 3.55
Prj19 LS ST 3.5
Prj20 SS ST 3.5
Prj21 SS ST 3.5
Prj22 LS TT 3
Prj23 LS TT 3
Prj24 LS TT 3
Prj25 LS ST 3
Prj26 LS ST 3
Prj27 LS TT 3
Prj28 LS TT 3
Prj29 LS TT 3
Prj30 LS TT 3
Prj31 LS TT 3
How to Better Form Software Development Teams? An Analysis of Different Formation Criteria
95
4.1 Stable Teams (ST) versus
Temporary Teams (TT)
Hypotheses of the first comparison:
• H0 - There is no statistically significant
difference between the Stable Teams versus
Temporary Teams scores.
• H1 - There is a statistically significant difference
between the Stable Teams versus Temporary
Teams scores.
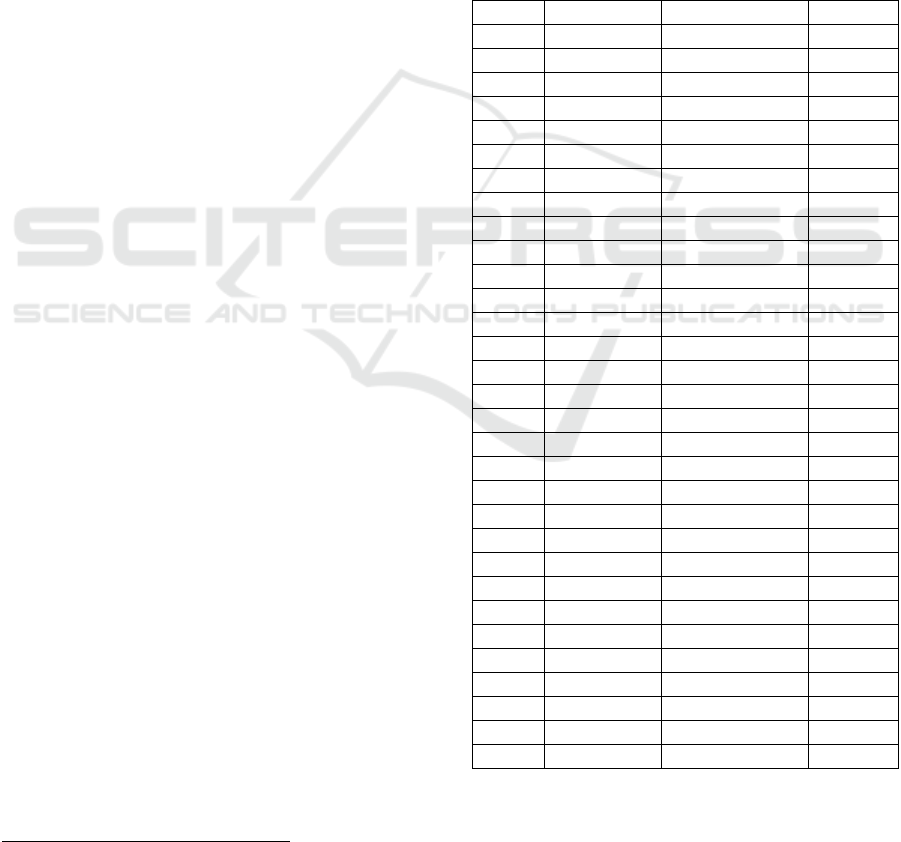
In addition to the statistical tests, we used Boxplot
analysis to visualize better data distribution and
possible differences between groups and variables, as
we can see in Figure 1. We can see that most Stable
Teams scores are in the range of 3.5 to 5, with 4 being
the median — otherwise, most Temporary Teams
scores between 3 and 4.5, with 3 being the median.
The variations of the two groups are of similar sizes.
Figure 1: ST versus TT.
First, we performed the normality test. Using
Shapiro-Wilk, one can observe that the p-value of
both sample groups is less than 0.05, suggesting that
there is evidence that the data tested are not normally
distributed, as Table 2 shows.
Table 2: Normality Test ST versus TT.
Shapiro-Wilk
Longevity
df Sig.
Temporary Team
14 0.001
Stable Team
17 0.013
Therefore, according to the sample size (31
projects), we should use the non-parametric Mann
Whitney statistical test, where the desired confidence
interval is 0.05.
When comparing the two sets to the CVP obtained
by the experimental study using the "Mann-Whitney"
statistical test, no statistical we found difference
between the groups (p-value = 0.095) as Table 3
shows
.
Nevertheless, the p-value had a result of less
than 0.10, so, with the p-value result close to the alpha
chosen alpha = 0.05, further studies are needed to
investigate this issue further.
Table 3: Mann U Whitney ST x TE.
CVP
Mann-Whitney U 78.500
Wilcoxon W 183.500
Z -1.668
Asymp. Sig. (2-Tailed) .095
Exact Sig. [2*(1-tailed
Sig.)]
.109b
4.2 Self-Selected Teams (SS) versus
Leader Selected Teams (LS)
Hypotheses of the second comparison:
• H0 - There is no statistically significant
difference between the scores of Self-Selected
Teams versus Leader Selected Teams.
• H1 - There is a statistically significant difference
between the Self-Selected Teams versus Leader
Selected Teams scores.
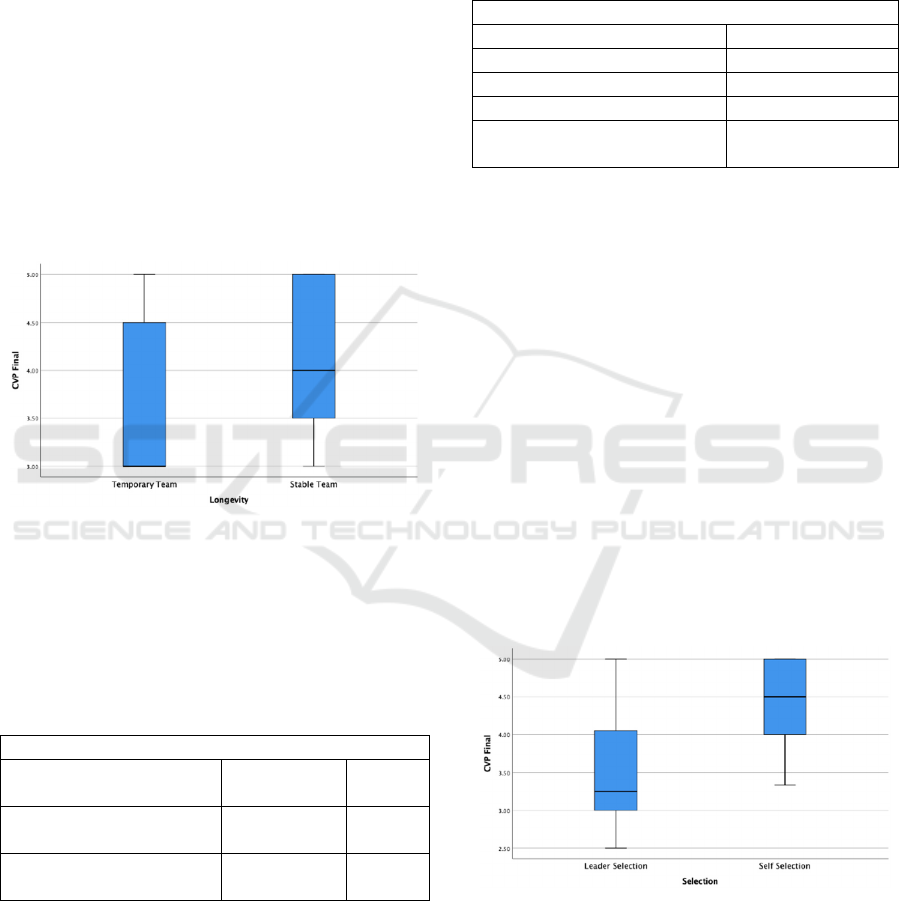
Again, in addition to the statistical tests, we used
Boxplot analysis to visualize better data distribution
and possible differences between groups and
variables, as we can see in Figure 2. We can see that
most Self-Selected Teams scores are in the range of 4
to 5, with 4.5 being the median — otherwise, most
Leader Selected Teams scores between 3 and 4, with
3.25 being the median. The variations of the two
groups also are of similar sizes.
Figure 2: LS versus SS.
We applied the normality test, and by performing
the Shapiro-Wilk test, we also observed in Table 4
that the p-value of one of the sample groups is less
than 0.05, suggesting that there is evidence that this
group data tested is not normally distributed even
though p-value from the other group is higher than
ICEIS 2020 - 22nd International Conference on Enterprise Information Systems
96
0.05. The null hypothesis that the data came from a
normally distributed population cannot be rejected.
Therefore, according to the sample size (31 projects),
we applied the non-parametric Mann Whitney
statistical test, where the desired confidence interval
is 0.05.
Table 4: Normality Test SS versus LS.
Shapiro-Wilk
Selection
df Sig.
Leader Selected
22 0.003
Self-Selected
9 0.057
The test results suggest statistical significance that
the Self-Selection criterion results in better scores on
customer value perception of deliverables than a team
of specialists selected by a leader criterion, as shown
in Table 5.
Table 5: Mann U Whitney SS x LS.
CVP
Mann-Whitney U 43.500
Wilcoxon W 296.500
Z -2.474
Asymp. Sig. (2-Tailed) .013
Exact Sig. [2*(1-tailed
Sig.)]
.014b
4.3 Self-Selected Stable Teams (STT)
versus Leader Selected Temporary
Teams (TET)
Hypotheses of the third comparison:
• H0 - There is no statistically significant
difference between the scores of Self-Selected
Stable Teams versus the Leader Selected
Temporary Teams.
• H1 - There is a statistically significant difference
between the Self-Selected Stable Teams (STT)
scores versus the Leader Selected Temporary
Teams (TET).
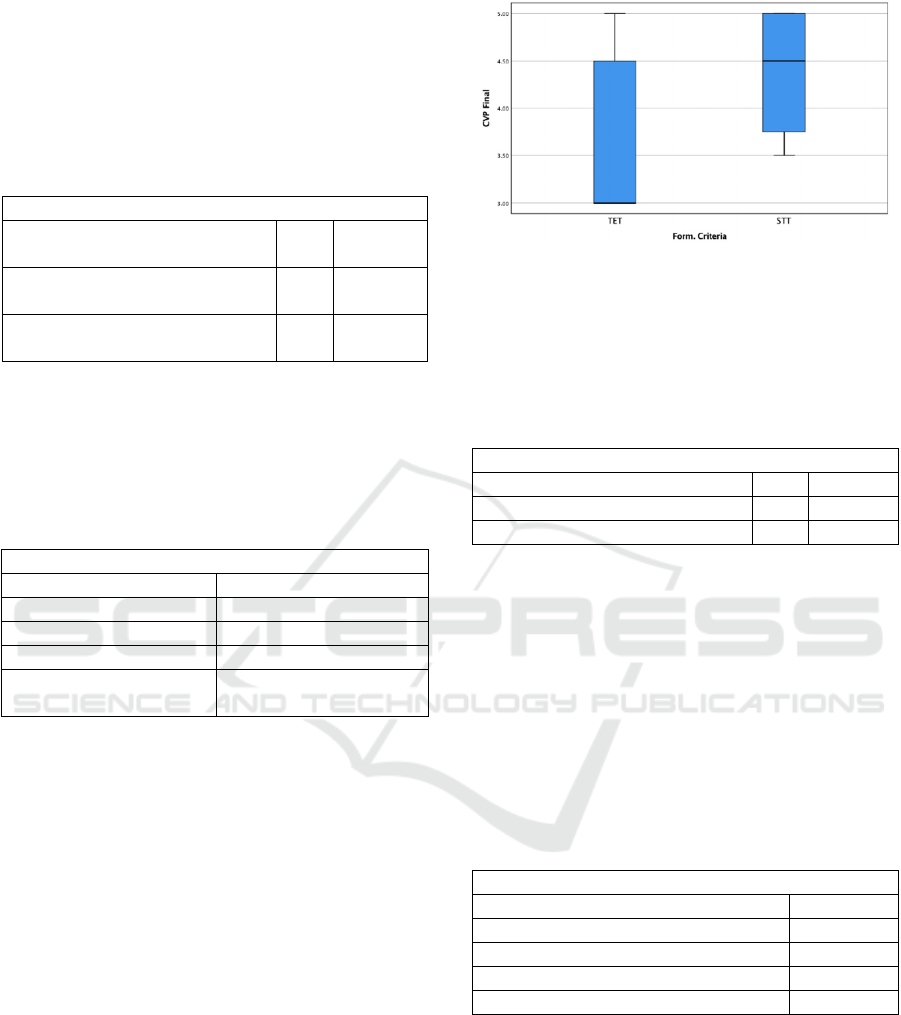
We used Boxplot analysis to visualize better data
distribution and possible differences between groups
and variables, as we can see in Figure 3. We can see
that most Self-Selected Stable Teams scores are in the
range of 3.75 to 5, with 4.5 being the median —
otherwise, most Leader Selected Temporary Teams
scores between 3 and 4.5, with 3 being the median.
The variations of the two groups also are of similar
sizes.
Figure 3: STT versus TET.
Using Shapiro-Wilk, one can observe in Table 6 that
the p-value of both sample groups is less than 0.05,
suggesting that the data tested are not normally
distributed.
Table 6: Normality Test: STT versus TET.
Shapiro-Wilk
Selection/Longevity df Sig.
Leader Sel. Temporary 14 0.001
Self-Sel. Stable 8 0.014
Therefore, according to the sample size (31 projects),
we employed the non-parametric Mann Whitney
statistical test, where the desired confidence interval
is 0.05.
The test result showed statistical significance
between the two groups, as shown in Table 7. Thus,
this result indicates that modifying the selection
criteria for Self-Selection along with the longevity
factor (Stable Team) suggests better scores in
customer value perception of deliverables than a
temporary team selected by a leader.
Table 7: Mann U Whitney STT x TET.
CVP
Mann-Whitney U 27.000
Wilcoxon W 132.000
Z -2.066
Asymp. Sig. (2-Tailed) .039
Exact Sig. [2*(1-tailed Sig.)] .050b
5 DISCUSSION
This study compared team formation in an
organization using selection criterion and longevity
factor, employing the CVP score for project
deliveries. We found quantitative results which
suggest that Self-Selected Teams tend to score better
than the Leader-Selected Teams, especially if
How to Better Form Software Development Teams? An Analysis of Different Formation Criteria
97

combined with the longevity factor. Nevertheless,
regarding the longevity factor by itself, no matter how
much the Stable Teams scored better on average than
the Temporary Teams, the result did not reach
statistical significance, although p-level was below
0.10, suggesting that other studies may lead to
significant results
.
These results may indicate that for a team perform
better, the criterion of selection presented in this study
could impact more than just the longevity factor since
whenever it was tested, it proved to be statistically
significant. About longevity factor, a possible
explanation is that a leader may form a team where
people may not empathize with others, so a Stable
Team would not necessarily help the team to have a
better performance; on the other hand, keeping a Self-
Selected Team by affinity stable seems to be a good
idea, maybe because the autonomy of those who
selected themselves as a team and could choose to
keep working together is respected. Separating these
teams can even harm member motivation. One of the
most relevant characteristics found in high-
performance teams is precisely having autonomy at
work (Dutra et al., 2015), suggesting that it is a likely
factor that could generate a superior performance. So,
providing autonomy at the moment of forming teams,
giving to the members a choice based on affinity,
could contribute to a higher performance of these new
teams later.
Other factors also could impact the obtained
results. Therefore, we would suggest as future work
to investigate other possible factors that also may
impact these results.
Regarding the other works found, much has been
written and researched on how to form teams using
various methods, algorithmic tools, always trying to
meet the criteria of leader choice of specialists
(Karduck & Sienou, 2004; Kaiafa & Chassiakos,
2015; Kang et al., 2011; Ngo-The & Ruhe, 2009; Park
et al., 2015; Shan et al., 2010; Yoshimura et al.,
2006). However, fewer studies explored the self-
selection idea and those who did, conducted on
universities, and few in the industry (Bacon et al.,
2001; Scott & Pollock, 2017).
The main threat to the validity of this study is the
generalization of our results for all organizations. We
collected these data from a single R&D organization
in a single city that develops software on demand. So,
the results may apply only to similar organizations.
Another threat is the measure used for the score,
the CVP. At times it may mean a real score or merely
a grade that is eventually given by the client's degree
of relationship with the team, not expressing the truth
by not being anonymous (Evans, 2002; Helander &
Ulkuniemi, 2012). However, by sampling 31 scores,
it is possible to understand that it is a sampling that
can demonstrate some relevance. Besides, to reduce
this threat, this score is requested by the QA (Quality
Assurance) department of the organization.
6 CONCLUSIONS
In this study, we examined the scores given by the
customers of the projects regarding their perceptions
of the value of project deliverables, built by software
teams formed using different criteria and factors to
evaluate better ways to form them. After examining
31 projects results in an R&D organization, the results
of our statistical analysis indicate that using the self-
selection criteria resulted in better project scores,
mainly combining this criterion with the longevity
factor. Although other studies focused more on
showing better ways for a leader to form teams of
specialists (Karduck & Sienou, 2004; Kaiafa &
Chassiakos, 2015; Kang et al., 2011; Ngo-The &
Ruhe, 2009; Park et al., 2015; Shan et al., 2010;
Yoshimura et al., 2006)), our study aimed at showing
an alternative selection criterion based on autonomy
results, using a case from the industry.
It is possible that these results found in this
context could be reflected in similar organizations, so
future researchers should consider trying this in other
types of organizations. It is worth mentioning that the
results found reflect only a quantitative analysis in
only one organization. A qualitative study would
better enrich both the results and the discussion.
Conducting the same experience in other
organizations in other contexts would also help to
support more understanding.
We did not test other forming criteria, such as
personality, random, among others, because the
organization did not make use of it. However, they
would be interesting to explore on future work in
other contexts. Regardless, our results point out to the
opportunity of exploring more the self-selection team
forming criterion in the industry, combining with
other factors.
ACKNOWLEDGMENTS
We would like to thank SIDIA for the financial
support. We also would like to thank the financial
support granted by CNPq through the process
numbers 423149/2016-4, 311494/2017-0,
204081/20181/PDE. Furthermore, we would like to
ICEIS 2020 - 22nd International Conference on Enterprise Information Systems
98

thank the studied Organization, which kindly
permitted the usage of the collected data, and also
thank all the participants who voluntarily made
available some time to participate in the empirical
study presented in this paper.
REFERENCES
Abdel-Hamid, T. K. T. K. (1989). The dynamics of
software project staffing: a system dynamics based
simulation approach. IEEE Transactions on Software
Engineering, 15(2), 109–119. https://doi.org/10.1109/
32.21738
Bacon, D. R., Stewart, K. A., & Anderson, E. S. (2001).
Methods of assigning players to teams: A review and
novel approach. Simulation and Gaming, 32(1), 6–17.
https://doi.org/10.1177/104687810103200102
Barreto, A., Barros, M. de O., & Werner, C. M. L. (2008).
Staffing a software project: A constraint satisfaction
and optimization-based approach. Computers and
Operations Research, 35(10), 3073–3089. https://doi.
org/10.1016/j.cor.2007.01.010
Bider, I., & Söderberg, O. (2016). Becoming Agile in a
Non-disruptive Way - Is It Possible? Proceedings of the
18th International Conference on Enterprise
Information Systems, 1, 294–305. https://doi.org/
10.5220/0005785302940305
Britto, R., Neto, P. S., Rabelo, R., Ayala, W., & Soares, T.
(2012). A hybrid approach to solve the agile team
allocation problem. 2012 IEEE Congress on
Evolutionary Computation, CEC 2012. https://doi.org/
10.1109/CEC.2012.6252999
C. S. Dutra, A., Prikladnicki, R., & Conte, T. (2015). What
Are the Main Characteristics of High Performance
Teams for Software Development? Proceedings of the
17th International Conference on Enterprise
Information Systems, 145–152. https://doi.org/10.5220/
0005375601450152
CA Technologies. (2013). The Impact of Agile. Quantified.
Retrieved from https://www.ca.com/content/dam/ca/
us/files/white-paper/the-impact-of-agile-quantified.pdf
Caglayan, B., Bener, A. B., & Miranskyy, A. (2013).
Emergence of developer teams in the collaboration
network. 2013 6th International Workshop on
Cooperative and Human Aspects of Software
Engineering, CHASE 2013 - Proceedings, 33–40.
https://doi.org/10.1109/CHASE.2013.6614729
Dutra, A. C. S., Prikladnicki, R., & Franca, C. (2015). What
Do We Know about High Performance Teams in
Software Engineering? Results from a Systematic
Literature Review. 2015 41st Euromicro Conference on
Software Engineering and Advanced Applications,
183–190. https://doi.org/10.1109/SEAA.2015.24
Eskerod, P. (1998). The Human Resource Allocation
Process when Organising by Projects. In Projects as
Arenas for Renewal and Learning Processes (pp. 125–
131). https://doi.org/10.1007/978-1-4615-5691-6_12
Evans, G. (2002). Measuring and managing customer
value. Work Study, 51(3), 134–139. https://doi.org/
10.1108/00438020210424262
Gerasimou, S., Stylianou, C., & Andreou, A. S. (2012). An
investigation of optimal project scheduling and team
staffing in software development using particle swarm
optimization. ICEIS 2012 - Proceedings of the 14th
International Conference on Enterprise Information
Systems, 2 ISAS(SAIC/-), 168–171. https://doi.org/
10.5220/0004001001680171
Helander, N., & Ulkuniemi, P. (2012). Customer perceived
value in the software business. Journal of High
Technology Management Research, 23(1), 26–35.
https://doi.org/10.1016/j.hitech.2012.03.003
Hendriks, M. H. A., Voeten, B., & Kroep, L. (1999).
Human resource allocation in a multi-project R&D
environment: Resource capacity allocation and project
portfolio planning in practice. International Journal of
Project Management, 17(3), 181–188. https://doi.org/
10.1016/S0263-7863(98)00026-X
Heričko, M., Živkovič, A., & Rozman, I. (2008). An
approach to optimizing software development team
size. Information Processing Letters, 108(3), 101–106.
https://doi.org/10.1016/j.ipl.2008.04.014
Ingham, A. G., Levinger, G., Graves, J., & Peckham, V.
(1974). The Ringelmann effect: Studies of group size
and group performance. Journal of Experimental Social
Psychology, 10(4), 371–384. https://doi.org/10.1016/
0022-1031(74)90033-X
Kaiafa, S., & Chassiakos, A. P. (2015). A Genetic
Algorithm for Optimal Resource-driven Project
Scheduling. Procedia Engineering, 123, 260–267.
https://doi.org/10.1016/j.proeng.2015.10.087
Kang, D., Jung, J., & Bae, D.-H. (2011). Constraint-based
human resource allocation in software projects.
Software: Practice and Experience, 41(5), 551–577.
https://doi.org/10.1002/spe.1030
Karduck, A. P., & Sienou, A. (2004). Forming the optimal
team of experts for collaborative work. IFIP Advances
in Information and Communication Technology, 154,
267–278. https://doi.org/10.1007/1-4020-8151-0_24
Katz, R. (2006). The Effects of Group Longevity on Project
Communication and Performance. Administrative
Science Quarterly, 27(1), 81. https://doi.org/ 10.2307/
2392547
Katzenbach, J. R., & Smith, D. K. (1993). The Wisdom of
Teams: Creating the High-Performance Organization.
In Small Business Reports. Cambride, MA: Harvard
Business School Press.
Mamoli, S., & Mole, D. (2015). Creating Great Teams (1st
ed.). Dallas, TX? Pragmatic Bookshelf.
Mehta, M., Anderson, D., & Raffo, D. (2008). Providing
value to customers in software development through
lean principles. Software Process: Improvement and
Practice, 13(1), 101–109. https://doi.org/10.1002/
spip.367
Ngo-The, A., & Ruhe, G. (2009). Optimized resource
allocation for software release planning. IEEE
Transactions on Software Engineering, 35(1), 109–
123. https://doi.org/10.1109/TSE.2008.80
How to Better Form Software Development Teams? An Analysis of Different Formation Criteria
99

Park, J., Seo, D., Hong, G., Shin, D., Hwa, J., & Bae, D.-H.
(2015). Human Resource Allocation in Software
Project with Practical Considerations. International
Journal of Software Engineering and Knowledge
Engineering, 25(01), 5–26. https://doi.org/10.1142/
S021819401540001X
Potosky, D., & Duck, J. (2007). Forming Teams for
Classroom Projects. Developments in Business
Simulation and Experiential Learning, 34, 144–148.
Prikladnicki, R., Perin, M. G., Marczak, S., & Dutra, A. C.
S. (2017). The Best Software Development Teams
Might be Temporary. IEEE Software, 34(2), 22–25.
https://doi.org/10.1109/MS.2017.50
Project Management Institute, (2008). A Guide to the
Project Management Body of Knowledge (PMBOK
Guide), 4th Edition.PMI.
Rubin, K. S. (2012). Essential Scrum: A Practical Guide to
the Most Popular Agile Process (1st ed.). MIchigan:
Addison-Wesley Professional.
Santos, R. E. S., da Silva, F. Q. B., de Magalhães, C. V. C.,
& Monteiro, C. V. F. (2016). Building a theory of job
rotation in software engineering from an instrumental
case study. Proceedings of the 38th International
Conference on Software Engineering - ICSE ’16, 971–
981. https://doi.org/10.1145/2884781.2884837
Scott, E., & Pollock, M. (2017). Effectiveness of Self-
selected Teams: A Systems Development Project
Experience. Issues in Informing Science and
Information Technology, 3, 601–617. https://doi.org/
10.28945/918
Shan, X., Jiang, G., & Huang, T. (2010). The optimization
research on the human resource allocation planning in
software projects. 2010 International Conference on
Management and Service Science, MASS 2010, 0–3.
https://doi.org/10.1109/ICMSS.2010.5577166
Standish Group. (2014). Big Bang Boom. Web, 12.
Retrieved from http://blog.standishgroup.com/BigBang
Boom.pdf
Tsai, H. T., Moskowitz, H., & Lee, L. H. (2003). Human
resource selection for software development projects
using Taguchi’s parameter design. European Journal of
Operational Research, 151(1), 167–180.
https://doi.org/10.1016/S0377-2217(02)00600-8
Tuckman, B. W., & Jensen, M. A. C. (1977). Stages of
Small-Group Development Revisited. Group &
Organization Studies, 2(4), 419–427. https://doi.org/
10.1177/105960117700200404
Uzzi, B., & Spiro, J. (2005). Collaboration and Creativity:
The Small World Problem. American Journal of
Sociology. https://doi.org/10.1086/432782
Wohlin, C., Runeson, P., Höst, M., Ohlsson, M. C.,
Regnell, B., & Wesslén, A. (2012). Experimentation in
Software Engineering. In Experimentation in Software
Engineering. https://doi.org/10.1007/978-3-642-
29044-2
Yoshimura, M., Fujimi, Y., Izui, K., & Nishiwaki, S.
(2006). Decision-making support system for human
resource allocation in product development projects.
International Journal of Production Research, 44(5),
831–848. https://doi.org/10.1080/00207540500272519
ICEIS 2020 - 22nd International Conference on Enterprise Information Systems
100
