
Automatic Nurse Allocation based on a Population Algorithm for Home
Health Care
Filipe Alves
1,2 a
, Ana Maria A. C. Rocha
2 b
, Ana I. Pereira
1,2 c
and Paulo Leit
˜
ao
1 d
1
Research Centre in Digitalization and Intelligent Robotics (CeDRI), Instituto Polit
´
ecnico de Braganc¸a, Braganc¸a, Portugal
2
ALGORITMI Center, University of Minho, Braga, Portugal
Keywords:
Home Health Care, Nurse Allocation, Optimization, Particle Swarm Optimization.
Abstract:
The provision of home health care services is becoming an important research area, mainly because in Portugal
the population is ageing and it is necessary to perform home care services. Home care visits are organized
taking into account the medical treatments and general support that elder/sick people need at home. This health
service can be provided by nurses teams from Health Units, requiring some logistics for this purpose. Usually,
the visits are manually planned and without computational support. The main goal of this work is to carry out
the automatic nurse’s allocation of home care visits, of one Braganc¸a Health Unit, in order to minimize the
nurse’s workload balancing, spent time in all home care visits and, consequently, reduce the costs involved.
The developed methodology was coded in MatLab Software and the problems were efficiently solved by the
particle swarm optimization method. The nurse’s allocation solution of home care visits for the presented case
study shows a significant improvement and reduction in the maximum time, in the nurse workload balancing,
as well as the patients waiting time.
1 INTRODUCTION
According to the World Health Organization the age-
ing people and dependency rate care of older people
in Europe, namely in Portugal, is increasing. The
number of people who need home care services, con-
sequently, is growing over the years. The National
Health System has to deal with more and more de-
manding scenarios in what concerns home care.
This scenario — to provide home care services —
is not only advantageous to elder/sick people but also
to the National Health System since it is economically
advantageous to keep people at home instead of pro-
viding them with a hospital bed (Nickel et al., 2012;
Rest and Hirsch, 2015).
The home-based care provided by public or pri-
vate entities has been the subject of recent research
mainly in the operations research area with particu-
lar attention on route’s optimization and on the staff
teams composition that provide this kind of services
(Nickel et al., 2012; Benzarti et al., 2013; Bertels
a
https://orcid.org/0000-0002-8387-391X
b
https://orcid.org/0000-0001-8679-2886
c
https://orcid.org/0000-0003-3803-2043
d
https://orcid.org/0000-0002-2151-7944
and Fahle, 2006; Rasmussen et al., 2012). According
to previous studies, the use of optimization strategies
contributes to improve the Home Health Care services
(Liu et al., 2013a; Sahin and Matta, 2015).
The Portuguese public health system consists in
two types of units: Hospitals and Health Units. Health
units are closer to the population, as they continuously
monitor their patients and home care services are pro-
vided by the teams of health professionals (usually
nurses) of these units. In this context, Health Units
have to perform the schedule and the best allocation
of the nursing teams inside and outside of the Health
Units.
The schedule of the home care visits provided by
the Health Unit teams depends on the patients, nurse
profiles and resources to perform the home care. This
represents a complex problem whose main goal is to
minimize the time required to perform all the home
care visits (considering the travel and treatment pa-
tient time) and to return to the Health Unit. In addi-
tion, the best allocation of the nurse teams should be
provided, taking into account the workload balancing
between them.
The rest of the paper is organized as follows: Sec-
tion 2 gives a brief description of the literature re-
view involved in Home Health Care and its applica-
Alves, F., Rocha, A., Pereira, A. and Leitão, P.
Automatic Nurse Allocation based on a Population Algorithm for Home Health Care.
DOI: 10.5220/0009386103950402
In Proceedings of the 9th International Conference on Operations Research and Enterprise Systems (ICORES 2020), pages 395-402
ISBN: 978-989-758-396-4; ISSN: 2184-4372
Copyright
c
2022 by SCITEPRESS – Science and Technology Publications, Lda. All rights reserved
395

tions. Section 3 overviews the problem definition and
formulation for nurses allocation, and Section 3 de-
scribes the general real data collection implemented
in the case study. Section 4 presents the population-
based algorithm applied and coded to solve the opti-
mization problem. Section 5 will present and discuss
the obtained results and compared with is currently
being performed. Finally, Section 5 rounds up the pa-
per with the conclusions and future work.
2 LITERATURE REVIEW
Many countries, such as Portugal, face a growing
elderly population, which increases the pressure on
institutions and professionals to provide social and
medical care in the most cost-effective way.
In this sense, a small literature review was car-
ried out to determine the state of the art involved
in keywords such as ”Home Health Care”, ”Alloca-
tion”, ”Optimization” and ”Scheduling”. The same
search was performed on the Scopus database which
enabled the results of 94 documents from different
sources such as journals, books and conference pro-
ceedings. With the bibliographic database collected,
it was organized to enable the use of the Bibliometrix
R-package (Aria and Cuccurullo, 2017). It is impor-
tant to refer that today Bibliometrix is more than just
a statistical tool, which includes all the main biblio-
metric methods of analysis, but we use it especially
for science mapping and networks and not for mea-
suring science, scientists, or scientific productivity. In
this purpose, it was used the shiny interface for Bib-
liometrix, called Biblioshiny. It supports in a easy
way of use the main features of Bibliometrix, like for
example, data importing and conversion to data frame
collection, data filtering, analytics and plots for three
different level metrics (sources, authors, documents)
and analysis of three structures of knowledge (con-
ceptual structure, intellectual structure, social struc-
ture). In this sense, after analyzing the obtaining in-
formation, it is possible to observe that the annual
scientific production in the field of applications and
Home Health Care study has grown exponentially in
the last 5 years. Figure 1 illustrates the extreme im-
portance of studies and works that enhance the opti-
mization of health logistics, such as primary care ser-
vices and their decision support in this scientific envi-
ronment.
Another analysis, more related to the scientific
mapping and its conceptual structure, it was pos-
sible to collect the networks of conceptual words,
which makes it possible to discover links and con-
cepts through co-occurrences of terms. The concep-
Figure 1: Annual Scientific Production related to Home
Health Care and its applications.
tual framework is often used to understand the top-
ics covered by scholars (called the research front) and
identify which are the most important and most recent
questions. Thus, the co-word analysis through cor-
respondence analysis was collected, according to the
dendrogram topic, which enables the iconic represen-
tation that organizes the particular links. This analysis
employs a quantitative method that leads to groupings
and their ascending hierarchical order (similar to the
branches of a tree).
The analysis and representation obtained can be
visualized in Figure 2. In this figure, it is possible
to highlight, from the top, the two large clusters that
group the co-word analysis of the literature review
performed. The weights vary depending on a spe-
cific co-word or its grouping, however it was possi-
ble to create connections already existing in the lit-
erature, with the work developed here. With a blue
rectangle, you can focus on the terms nursing, home
care services, workload balancing and decision mak-
ing. In a smaller rectangle, scheduling algorithms and
swarm optimization using particle swarm optimiza-
tion (PSO) are referred to. Thus, it is easy to identify
the importance of the literature involved, its health
context and how the solution will be obtained in terms
of an automatic nurse allocation system in a Health
Unit. Moreover, it is expected to enhance the growth
of this co-words in the future.
With this literature review, we sought to under-
stand the domains that influence Home health care,
such as its continuity of care and consistency, the staff
involved, their competence and of course, the quality
of this increasingly common practice, especially in re-
gions of the interior of Portugal. The use of a biblio-
metric analysis made possible the optimized identifi-
cation of relevant documents, according to, for exam-
ple, the citation analysis as a quantitative evaluation
of the main works in the area. From the obtained re-
sults and after its analysis, there is a steady growth of
applications and studies on the home health care prob-
lem, and it is possible to highlight some works such
ND2A 2020 - Special Session on Nonlinear Data Analysis and Applications
396
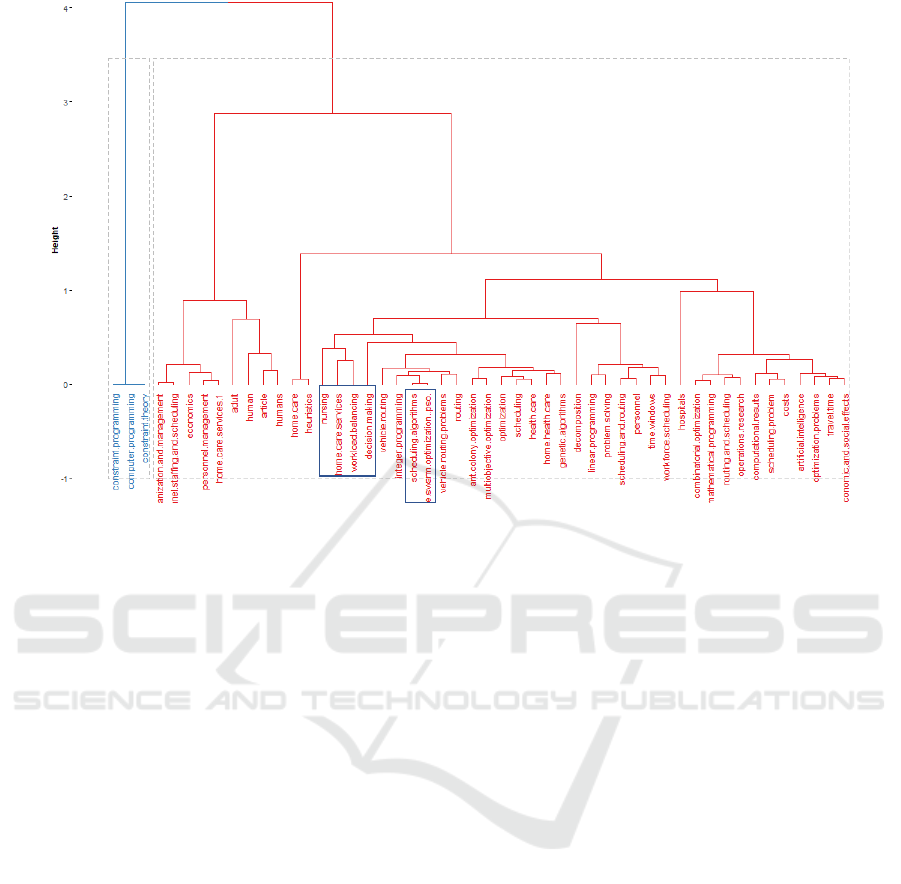
Figure 2: Dendrogram on the Conceptual Structure about the literature involved.
as routing reviews and scheduling of home health
care (Fikar and Hirsch, 2017), multi-objective opti-
mization in Home care (Braekers et al., 2016), assign-
ment and allocation (Cappanera and Scutell
`
a, 2014),
heuristics and meta-heuristics (Liu et al., 2013b; Hi-
ermann et al., 2015), among others applied to this do-
main, revealing its extensive applicability.
3 PROBLEM DEFINITION
Health Centers have nurses devoted partially to the
task of providing health care at patient’s home, who
live at any location in the area under supervision of
the Health Center. For a given day, a Health Care
Center needs to deal with two problems: the nurse
schedule needs to perform all tasks inside and out-
side of the Health Care Center; and the cars’ sched-
ules availability.
In this work, it is studied the problem to schedule
the tasks outside the Health Care Center, particularly,
to find the home care visits schedule for a given day,
in order to minimize the travel time to perform all vi-
sits.Then, the main objective of this study is to per-
form an automatic planning of home care visits by
the nurses team schedule of the Health Care Center,
in order to minimize all the time spent by the nurses
to perform all home care visits. This optimization
problem, is formulated and solved on some general
assumptions. In this sense, it was considered the fol-
lowing assumptions:
• Patients who live in the area of Health Care Center
can have different profiles.
• A patient profile is assumed to be known a priori
and does not change during the home care visit.
• The number and average duration of the treat-
ments that characterize a patient profile are known
and are the same among the patients who have the
same profile (defined and given by Health Care
Center).
• The number of patients who need home care ser-
vices and assigned to a working day is known in
advance and does not change during that day.
• Human resources that perform home care visits
are known in advance.
• All the patients assigned to a working day are cov-
ered, which means that all the patients admitted
to the home care visits should be assigned to the
nurses set.
• The locations of all patients are known in advance.
• The time matrix of travel between all the localities
is also known in advance.
• All the travels begin and end up in the Health Care
Center.
• It was considered 15 minutes for the trip, in the
same city, to visit different patients.
Automatic Nurse Allocation based on a Population Algorithm for Home Health Care
397

Taking into account all the above assumptions for
a working day, consider the following general param-
eters for the formulation of nurses’ schedule:
• N is the total number of nurses assigned for home
care visits.
• P is the total number of patients that need some
treatments at their homes.
• L is the total number of different patients’ loca-
tions.
• The list of the treatments that each nurse can per-
form.
Consider the variable X = (p
1
, ..., p
P
;n
1
, ..., n
P
),
where the patient p
i
will be visited by the nurse n
i
,
for i = 1, ..., P, and X ∈
{
1, · ·· , P
}
P
×
{
1, · ·· , N
}
P
.
Then, for a given X it is possible to define the
nurse schedule and also the total time needed by each
nurse to finish her work. So, consider the objective
function T
n
(X) defined as
f (X) = max
n=1,...,N
T
n
(X) (1)
which represents the time spent by the nurses to per-
form all treatments, including the returning journey to
the Health Care Center.
Then the constrained integer optimization prob-
lem will be defined as
min f (X)
s.t. 1 ≤ p
i
≤ P, i ∈
{
1, ..., P
}
, p
i
integer
1 ≤ n
j
≤ N, j ∈
{
1, ..., P
}
, n
j
integer
∪
P
i=1
p
i
=
{
1, ..., P
}
.
(2)
4 GENERAL REAL DATA
It is intended to apply the developed problem formu-
lations to a real problem of the Health Care Center.
The data provided by the Health Care Center concern
the day April 18, 2016. The data used were available
by the Healthcare Center of Braganc¸a (chosen by the
institution and simulated a normal working day in the
center), that is, simulated for nurses allocation.
The home care services provided by the assigned
nurses to this job can be classified into five different
treatments (or home care visits). The treatments are
thus divided according to their diversity. Thus, Treat-
ment 1 (T.1) refers to curative care with an average
time of 30 minutes, while Treatment 2 (T.2) refers to
Surveillance and Rehabilitation, with an average du-
ration of 60 minutes. Treatment 3 (T.3) is Curative
and Surveillance care averaging 75 minutes, while
Treatment 4 (T.4) is only Surveillance care and has
an average care of around 60 minutes. Finally, Treat-
ment 5 (T.5) concerns more general health care such
as support and monitoring and has an average of 60
minutes as well.
On April 18, there were thirty one patients who
needed home care visits by Health Care Center. The
thirty one patients are from twelve different locations
of the Braganc¸a region, that belong to the action area
of the Health Care Center. In Table 1, the locations are
represented by the corresponding abbreviation. From
hereafter it will be used only these abbreviations. In
third column it is shown the related number of pa-
tients who need health care. The major part of the
patients (18) are from Braganc¸a city while 13 patients
are from rural localities around Braganc¸a.
Table 1: Locations and total number of patients in each one.
Localities Abbreviations Number of Patients
Braganc¸a Bg 18
Parada Pa 2
Rebordainhos Re 1
Carrazedo Car 1
Espinhosela Esp 1
Rebord
˜
aos R 1
Salsas Sal 1
Serapicos Se 1
Outeiro Ou 1
Meixedo M 1
Bragada Bda 1
Milh
˜
ao Mil 2
Each patient, required specific medical assistance,
one or more different treatments from the 5 treatments
that the nurses can performed.
On the other hand, the time required to travel be-
tween two locations is shown in Table 2. It was as-
signed 15 min to travel between two different places,
in the same location.
Based on all the general data presented, the ob-
jective is to minimize the total time required for each
nurse to provide all the treatments to all patients and
return to the Health Unit in order to obtain the nurses
allocation in a specific schedule. In addition to all
the data previously presented, more specific informa-
tion is needed to produce nurses’ schedule. Thus, it is
necessary to know, how many nurses are available for
the study day and what treatments each one performs
(nurses are allocated in different types of treatments,
information obtained by the Health Care Unit).
The Health Care Center has twelve nurses desig-
nated to perform home care visits during the day in
study. Table 3 shows the type of treatment that each
nurse can perform, as well as the average time of each
treatment.
ND2A 2020 - Special Session on Nonlinear Data Analysis and Applications
398

Table 2: Data about travel times between different locations (in minutes).
Bg Pa Re Car Esp R Sal Se Ou M Bda Mil
Bg 15 28 25 26 20 14 23 31 23 20 22 24
Pa 28 15 27 39 37 25 25 23 27 40 26 36
Re 25 27 15 33 34 22 12 20 32 37 14 33
Car 26 39 33 15 24 23 34 42 38 39 33 39
Esp 20 37 34 24 15 24 32 40 33 18 31 34
R 14 25 22 23 24 15 20 28 26 27 19 27
Sal 23 25 12 34 32 20 15 8 30 34 9 31
Se 31 23 20 42 40 28 8 15 38 42 17 39
Ou 23 27 32 38 33 26 30 38 15 29 30 14
M 20 40 37 39 18 27 34 42 29 15 34 31
Bda 22 26 14 33 31 19 9 17 30 34 15 31
Mil 24 36 33 39 34 27 31 39 14 31 31 15
Table 3: Treatments performed by the nurses.
T.1 T.2 T.3 T.4 T.5
(30 min) (60 min) (75 min) (60 min) (60 min)
Nurse 1 X X
Nurse 2 X X X
Nurse 3 X X
Nurse 4 X X X
Nurse 5 X X
Nurse 6 X X X
Nurse 7 X X X
Nurse 8 X X
Nurse 9 X X
Nurse 10 X X
Nurse 11 X X
Nurse 12 X X
5 PARTICLE SWARM
OPTIMIZATION
The global optimization method used to solve the
constrained integer optimization problem defined in
(2) was the Particle Swarm Optimization (PSO). This
method is a population-based stochastic optimization
technique that is briefly described in the following.
The Particle Swarm Optimization was developed by
Kennedy and Eberhart (Kennedy, 2010) and it is in-
spired on natural social intelligent behaviors of bird
flocking.
PSO is a computational method that optimizes a
given problem by iteratively measuring the quality of
the various solutions. This method consists in the
optimization of an objective function through the ex-
change of information between individuals (particles)
of a population (swarm).
The PSO idea is to perform a set of operations and
move each particle to promising regions in the search
space (Poli et al., 2007; Imran et al., 2013).
The steps of the PSO are presented in Algorithm 1.
Algorithm 1: Particle Swarm Optimization.
1: Generates a randomly population of individuals, P
0
, with dimension
N
pop
.
2: Set the values of w, c
1
, r
1
. Define c
2
, r
2
random numbers in [0, 1].
Set v
i
= 1, for i = 1, ..., N
pop
, and k = 0.
3: while stopping criterion is not met do
4: Set k = k + 1.
5: Update the value of xbest
i
for the individual with index i,
for i = 1, ..., N
pop
.
6: Update the value of gbest for all population P
j
, for j = 1, ..., k.
7: Update the individual velocity according to:
v
k+1
i
= wv
k
i
+ c
1
r
1
(xbest
i
− x
k
i
) +
b
c
2
r
2
e
(gbest − x
k
i
).
8: Update the individual position according to: x
k+1
i
= x
k
i
+ v
k+1
i
.
9: If necessary, adapt x
k+1
i
to a feasible schedule.
10: end
11: The solution is given by gbest
At each iteration the velocity of each individual i,
v
i
, is adjusted. The velocity calculation is based on
the best position found by the neighborhood of the in-
dividual, the best position found by the particle itself
- xbest and the best position found by the whole pop-
ulation, taking into account all individual - gbest or
the best position overall (Bratton and Kennedy, 2007).
During the iterative process if any coordinate of x
k+1
i
falls outside the search space it is projected to the fea-
sible region.
The iterative procedure ends after a maximum
number of iterations and/or after a maximum number
of function evaluations.
6 RESULTS AND DISCUSSION
The main objective is to produce the best allocation
for the existing problem in Health Units: nurses’
schedule for home care visits.
Automatic Nurse Allocation based on a Population Algorithm for Home Health Care
399

The present study was carried out at the Health
Care Center of Braganc¸a, on a date provided by the
Health Center, April 18, 2016. The planning daily
route carried out on April 18 was made manually,
that is, without any mathematical model or subject
to computational mechanisms. The nurses’ schedule
was built and made available by the Health Care Cen-
ter on April 18 for the twelve nurses that performed
the home care visits in that day.
Analyzing the scheduling carried out manually by
the Health Care Center, it is possible to conclude that
all nurses have different work schedules ranging from
86 to 369 minutes. The number of patients that each
nurse visits change from 1 (Nurse 8) to 7 (Nurse 3)
and the Nurse 3 has the highest time to provide the
home care visits. The time needed for each nurse to
perform the health treatment is shown in the Table 4.
Table 4: Time needed to perform home care visits by each
nurse.
Time (minutes)
Nurses
1 221
2 260
3 369
4 212
5 86
6 90
7 241
8 70
9 194
10 90
11 240
12 183
On this working day, the highest time needed for
home visits ended after 369 minutes. Therefore, and
as mentioned above, the HUB presents an inconsistent
schedule, with nurses performing many home care
visits and others performing only one, ending with
quite different travel times. Once again, and as men-
tioned above, the Health Unit of Braganc¸a presents an
inconsistent schedule, with an unbalanced workload.
The idea is to optimize this process of home care
visit, and produce for the day in question (April 18,
2018), the nurses’ best allocation.
In an attempt to plan the schedules automatically,
one computational algorithm was used — the Particle
Swarm Optimization method.The numerical results
were obtained using an Intel(R) Core(TM) i7 CPU
2.2GHz with 6.0 GB of RAM and using the MatLab
software. The fixed variable values for both methods
were N
pop
= 30, w = 1 and c
1
= r
1
= 2.
Since the PSO is a stochastic method, each imple-
mentation was tested with 100 runs in order to evalu-
ate the results obtained and compare them with those
originally elaborated by the Health Care Center. The
stopping criteria were based on the maximum number
of function evaluation and maximum number of itera-
tions that were limited to 5000 and 1000, respectively.
PSO had 100% of successful rate since they found
a feasible solution in all runs. The Figure 3 depicts
the obtained solution using PSO.
Regarding the identification of patients and treat-
ments, P(1) - T.1 represents Patient 1 who needs
Treatment 1. For example, the schedule of the Nurse
1, which has an effort per day of 4 hours, will be:
moving from the HUB to the village of Parada (Bg -
Pa) to carry out the home care visit of Patient 2, who
requires the Treatment 1 (P(2) - T.1). After this, the
nurse returns to the point of origin, the Health Care
Center (Pa - Bg). For this nurse, the time spent in this
home care visit was 86 minutes.
From Figure 3 it is possible to see that the maxi-
mum time needed for the last nurse to perform all the
visits and return to the Health Care Center was 260
minutes. The solution obtained has a significant time
reduction (109 minutes) when compared to the HUB
manual allocation/planning, which was 369 minutes.
Table 5 presents the summary of PSO results, such
as: the best optimal solution found among all runs
( f
∗
min
), the average optimal solution ( f
∗
avg
), and, fi-
nally, the average time needed to solve the optimiza-
tion problem (Time
avg
) in seconds.
Table 5: Results obtained by PSO method.
f
∗
min
f
∗
avg
Time
avg
(s)
PSO 260 307 98
Analyzing the numerical results presented in the
previous table, it is possible to verify the minimum
total time found by PSO is 260 minutes and the av-
erage optimal solution among all runs was 307 min-
utes. Finally, it appears that the average time to solve
the problem was 98 seconds, which means that PSO
found the optimal solution very quickly.
In PSO, it was obtained an optimal solution, find-
ing the best nurse allocation, searching for the best
workload balancing as well as minimizing the maxi-
mum time in home care visit. This allows conclude
that the Health Care Center can now opt for an opti-
mized allocation that proposes the end of visits after
260 minutes.
In order to compare (in an easy and fast way) the
time spent by each nurse, using the PSO allocation
and the time obtained manually by the HUB, Table 6
lists for each nurse (first row), the time needed to fin-
ND2A 2020 - Special Session on Nonlinear Data Analysis and Applications
400
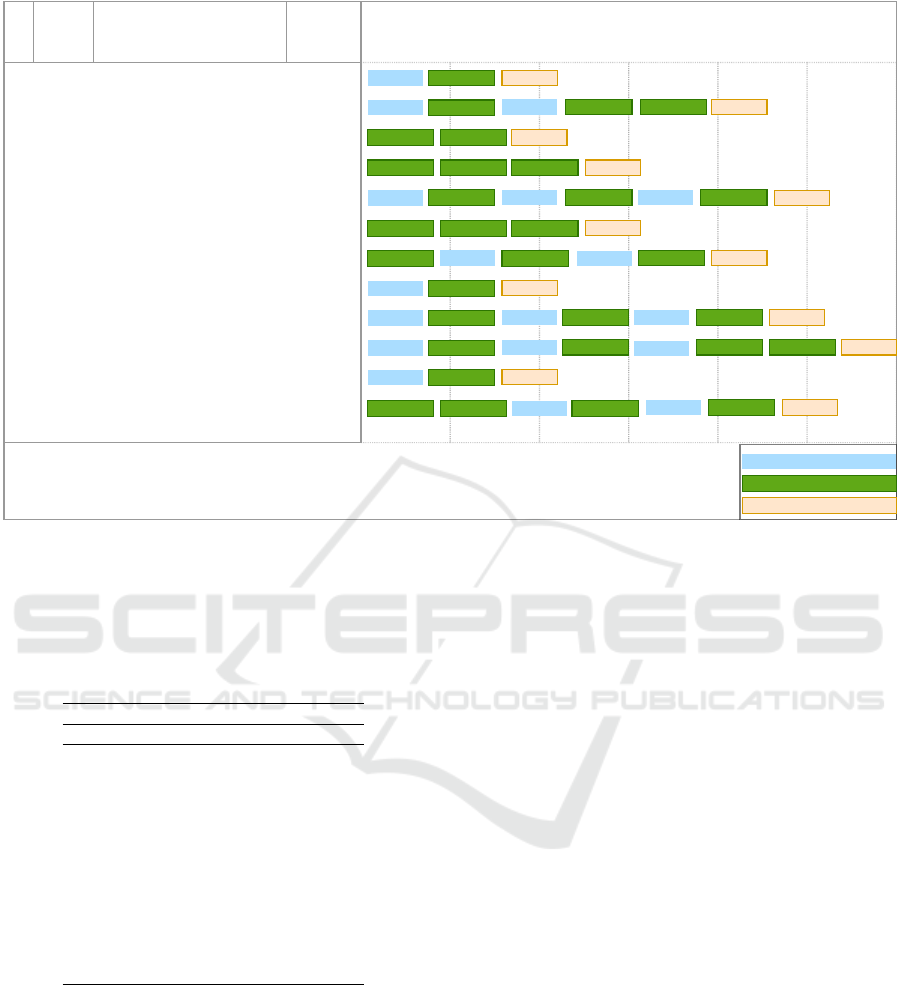
# Nurse Start Effort
1 Nurse 1 18//04//2018 9:00 AM 4h
2 Nurse 2 18//04//2018 9:00 AM 4h
3 Nurse 3 18//04//2018 9:00 AM 4h
4 Nurse 4 18//04//2018 9:00 AM 4h
Bg - Pa
Bg - Re
5
6
7
8
9
10
11
12
Nurse 5
Nurse 6
Nurse 7
Nurse 8
Nurse 9
Nurse 10
Nurse 11
Nurse 12
Allocation using PSO
P(3) - T.1
Bg - Sal
Bg - Pa
Bg - Mil
Bg - M
Bg - Esp
P(2) - T.1 Pa - Bg
P(6) - T.2 P(5) - T.2 P(7) - T.2
P(14) - T.1 Sal - Bg
Re - Bg
P(29) - T.4 Bg - Car P(8) - T.1 Car - Bg
Bg - Bg
P(1) - T.1 Bg - Bg
P(26) - T.4 P(10) - T.1 P(15) - T.3 Bg - Bg
18//04//2018 9:00 AM
18//04//2018 9:00 AM
18//04//2018 9:00 AM
18//04//2018 9:00 AM
18//04//2018 9:00 AM
18//04//2018 9:00 AM
18//04//2018 9:00 AM
18//04//2018 9:00 AM
4h
4h
4h
4h
4h
4h
4h
4h
P(21) - T.4 P(18) - T.5 P(28) - T.4
Bg - Bg
P(20) - T.3 Bg - Se P(16) - T.4 Se - R P(11) - T.1 R - Bg
P(17) - T.1 Pa - Bg
P(30) - T.4 Mil - Bg P(23) - T.1 Bg - Bda P(25) - T.4 Bda - Bg
P(22) - T.1 M - Mil P(31) - T.4
Mil - Bg
P(12) - T.1 P(4) - T.1 Bg - Bg
P(9) - T.1 Esp - Bg
P(24) - T.1 P(27) - T.4 Bg - Ou P(19) - T.1
Ou - Bg P(13) - T.1 Bg - Bg
Time Travelling
Treatment time
Return to Health Unit
Figure 3: Automatic Nurse Allocation for HUB Scheduling.
ish the home care visits done manually (second row)
and the obtained time spent with PSO (third row).
Table 6: Total time spent by each nurse in home care visits.
Time required in each nurse allocation
Nurses Manual PSO
1 221 86
2 260 260
3 369 105
4 212 225
5 86 218
6 90 240
7 241 253
8 70 86
9 194 242
10 90 255
11 240 70
12 183 241
From the above table it is possible to state that
with PSO algorithm, the maximum time spent by the
nurses is 260 minutes. In turn, the maximum time
spent by the nurses in HUB scheduling is 369 min-
utes (greater than the PSO computational solution).
On the other hand, an automatic allocation is achieved
that allows a faster solution and its quick replacement,
if necessary, a better workload balance, favoring not
only the work of nurses but also limiting the patients’
waiting time.
7 CONCLUSIONS AND FUTURE
WORK
Since, at the HUB, home care visits are planned man-
ually and without computational support, this implies
that the nurse’s allocation of home care visits may not
be the most appropriate in terms of the logistics of
nurses and patients.
In this way, and in an attempt to optimize the lo-
gistic process, specially in the nurses allocation, it
is necessary to use strategies to minimize the maxi-
mum time spent by each nurse on home care sched-
ule, without, however, worsening the quality of the
provided services and, always, looking for the best
schedules organization. Optimization can be used
very advantageously in the context of Health Care
Centers allocation for home care aged people visits.
The allocation problem of nurses in the HUB was
efficiently solved using the PSO method. When com-
pared to the manual solution and in use by the health
unit, the maximum value of home visits was opti-
mized, from 369 to 260 minutes, improving the work
effort required by nurses. Moreover, the optimal solu-
tion was found quite fast and provides a better nurses
workload balancing. This approach represents a gain
for all the involved people, health professionals and
patients.
For future work, it is possible to reformulate the
Automatic Nurse Allocation based on a Population Algorithm for Home Health Care
401

problem taking into account a multi-objective ap-
proach providing strategic, tactical and operational
decision-making support. This approach may con-
sider minimizing not only the maximum time for each
nurse, but also minimizing the total kilometers per-
formed and necessary for each car, and also minimiz-
ing the total cost involved. In addition, as a future
approach, more real health problems (with different
parameter sizes) will be considered and compared not
only to the manual case, but also with other stochastic
algorithms in the literature, such as the Genetic Algo-
rithm.
ACKNOWLEDGEMENTS
This work has been supported by COMPETE:
POCI-01-0145-FEDER-007043 and FCT - Fundac¸
˜
ao
para a Ci
ˆ
encia e Tecnologia within the projects
UID/CEC/00319/2019 and UIDB/5757/2020.
REFERENCES
Aria, M. and Cuccurullo, C. (2017). bibliometrix: An r-tool
for comprehensive science mapping analysis. Journal
of Informetrics, 11(4):959 – 975.
Benzarti, E., Sahin, E., and Dallery, Y. (2013). Operations
management applied to home care services: Analysis
of the districting problem. Decision Support Systems,
55(2):587–598.
Bertels, S. and Fahle, T. (2006). A hybrid setup for a hybrid
scenario: combining heuristics for the home health
care problem. Computers & Operations Research,
33(10):2866–2890.
Braekers, K., Hartl, R. F., Parragh, S. N., and Tricoire, F.
(2016). A bi-objective home care scheduling prob-
lem: Analyzing the trade-off between costs and client
inconvenience. European Journal of Operational Re-
search, 248(2):428 – 443.
Bratton, D. and Kennedy, J. (2007). Defining a standard for
particle swarm optimization. In 2007 IEEE Swarm
Intelligence Symposium, pages 120–127.
Cappanera, P. and Scutell
`
a, M. G. (2014). Joint assign-
ment, scheduling, and routing models to home care
optimization: A pattern-based approach. Transporta-
tion Science, 49(4):830–852.
Fikar, C. and Hirsch, P. (2017). Home health care routing
and scheduling: A review. Computers & Operations
Research, 77:86 – 95.
Hiermann, G., Prandtstetter, M., Rendl, A., Puchinger, J.,
and Raidl, G. R. (2015). Metaheuristics for solv-
ing a multimodal home-healthcare scheduling prob-
lem. Central European Journal of Operations Re-
search, 23(1):89–113.
Imran, M., Hashim, R., and Khalid, N. E. A. (2013).
An overview of particle swarm optimization variants.
Procedia Engineering, 53:491 – 496.
Kennedy, J. (2010). Particle swarm optimization. Encyclo-
pedia of machine learning, pages 760–766.
Liu, R., Xie, X., Augusto, V., and Rodriguez, C. (2013a).
Heuristic algorithms for a vehicle routing problem
with simultaneous delivery and pickup and time win-
dows in home health care. European Journal of Oper-
ational Research, 230(3):475–486.
Liu, R., Xie, X., Augusto, V., and Rodriguez, C. (2013b).
Heuristic algorithms for a vehicle routing problem
with simultaneous delivery and pickup and time win-
dows in home health care. European Journal of Oper-
ational Research, 230(3):475–486.
Nickel, S., Schr
¨
oder, M., and Steeg, J. (2012). Mid-term
and short-term planning support for home health care
services. European Journal of Operational Research,
219(3):574 – 587. Feature Clusters.
Poli, R., Kennedy, J., and Blackwell, T. (2007). Particle
swarm optimization. Swarm Intelligence, 1(1):33–57.
Rasmussen, M. S., Justesen, T., Dohn, A., and Larsen, J.
(2012). The home care crew scheduling problem:
Preference-based visit clustering and temporal depen-
dencies. European Journal of Operational Research,
219(3):598–610.
Rest, K.-D. and Hirsch, P. (2015). Supporting urban home
health care in daily business and times of disasters.
IFAC-PapersOnLine, 48(3):686–691.
Sahin, E. and Matta, A. (2015). A contribution to opera-
tions management-related issues and models for home
care structures. International Journal of Logistics Re-
search and Applications, 18(4):355–385.
ND2A 2020 - Special Session on Nonlinear Data Analysis and Applications
402
