
Predicting 30-days All-cause Hospital Readmissions Considering
Discharge-to-alternate-care-facilities
Tahir Hameed
1a
and Syed Ahmad Chan Bukhari
2b
1
Department of Organization and Analytics, Merrimack College, North Andover, U.S.A.
2
The Lesley H. and William L. Collins College of Professional Studies, St. John’s University, New York, U.S.A.
Keywords: 30-days Hospital Readmissions, Alternate-Care-Facilities, Predictive Modelling, Discharge Decisions,
Electronic Health Records, EHR, MIMIC-III.
Abstract: Hospital discharge is a decision based on several data points including diagnostic, physiological, demographic
and caretaker information. Readmissions days after discharge are costly in addition to negative impact on
capacity and service quality of hospitals. 30-days readmission (30DRA) literature remains focused on above
variables and medical conditions paying little attention to the role of alternate-care-facilities (such as skilled
nursing facilities and hospices) on reduction of 30DRA rates. To the best of our knowledge, there is negligible
research considering alternate care variables for predicting readmissions even when physicians have actively
started considering discharge-to-alternate-care during discharge planning. This paper develops a classification
model for predicting patients who are likely to be readmitted within 30 days of discharge-to-alternate-care.
Several machine-learning approaches, such as multi-logistic regression, Naïve Bayes, random forest, and
neural networks were tested on the model to find the one with highest predictive power. The model was trained
and tested on MIMIC-III, a large anonymized electronic health records (EHRs) database from US hospitals.
Results suggest discharge-to-alternate-care reduces 30DRA. Moreover, neural networks and logistic
regression techniques show better precision and accuracy in identifying the patients likely to be readmitted in
30 days.
1 INTRODUCTION
An increase in hospital readmission rates has been
burdening the US healthcare system in the form of
unnecessary medical expenses. Jencks et al. (2009)
noted around 20 percent of Medicare patients were
readmitted within 30 days. It is not surprising hospital
readmissions are increasingly being considered an
indicator of care quality, resource utilization and
health outcomes (MedPAC, 2013, Halfon et al.,
2006). Medicare started reporting hospital
readmission rates in 2009 and launched the Hospital
Readmission Reduction Program (HRRP) in 2012
lowering payments to hospitals with excess
readmissions (CMS, n.d.-a). Main goals of these
programs include lowering treatment costs for
patients while preventing inefficient use of scarce
healthcare resources and improving patient health
outcomes.
a
https://orcid.org/0000-0002-6824-6803
b
https://orcid.org/0000-0002-6517-5261
Discharge planning is a key process preceding
readmission. Alternate care, which is additional
primary or secondary care prescribed for patients
when discharged from acute care, as a complement
ensures healthcare continuity ultimately avoiding
poor health outcomes and 30-days readmissions
(30DRA) (Naylor et al., 2011, MedPAC, 2013).
Many researchers and policy organizations consider
alternate or transitional care as the next frontier to
deal with disease progression (Mechanic, 2014). To
that end, clinical decision support systems (CDSS)
have become an important part of discharge planning.
Modern CDSS present EHR, diagnostic, labs and
comorbidity data to healthcare providers for making
effective discharge planning decisions. Based on
above data, these CDSS provide valuable support in
the form of risk scores and indices predicting
mortality, diseases based on co-morbidities, and re-
admissions. However, to the best of our knowledge,
864
Hameed, T. and Bukhari, S.
Predicting 30-days All-cause Hospital Readmissions Considering Discharge-to-alternate-care-facilities.
DOI: 10.5220/0009385608640873
In Proceedings of the 13th International Joint Conference on Biomedical Engineering Systems and Technologies (BIOSTEC 2020) - Volume 5: HEALTHINF, pages 864-873
ISBN: 978-989-758-398-8; ISSN: 2184-4305
Copyright
c
2022 by SCITEPRESS – Science and Technology Publications, Lda. All rights reserved

research is negligent on predictive models that
consider alternate care as predictor variables for 30-
days readmissions.
This paper builds and tests a predictive model for
all-cause 30DRAs incorporating history of discharge
locations prior to current readmission. We used a
subset of MIMIC-III EHR database containing
anonymized acute in-patient records (Johnson et al.,
2016). The model was trained and tested on several
machine-learning (ML) approaches including multi-
logistic regression, Naïve Bayes, random forest and
neural networks. The results show precision and
accuracy of the predictions improves when
considering previous discharge locations along with
demographics, current admissions and care levels,
and disease severity and comorbidity levels during
discharge planning. Neural networks turn out to be
the best predictive approach here followed by random
forest with high evaluations on their ROC, Precision,
Recall and F1 scores. The model will be refined
further on each of the category of variables.
Rest of the paper is organized as follows. Next
section covers relevant literature on hospital
readmissions, alternate care and predicting 30DRAs.
Section 3 introduces the predictive model and
variables at some length before discussing research
methods and data mining from MIMIC-III database.
It is followed by training and testing results. Final
section 4 presents conclusions and plans for future
research.
2 LITERAURE ON HOSPITAL
READMISSIONS AND
ALTERNATE-CARE-
FACILITIES
2.1 Hospital Readmissions and
Healthcare Costs
Two major economic issues related to hospital
readmissions are volumes and costs (Zohrabian et al.,
2018). Around 20% patients in US hospitals are re-
admitted within 30 days of discharge costing
Medicare around 17 billion dollars (Jencks et al.,
2009) of which $12 billion are go to potentially
avoidable readmissions (Shulan et al., 2013). As per
2017 reports, US healthcare systems is already
spending around 17% of its GDP on healthcare, way
higher than any other developed OECD nation; most
of them spending around 10% of their GDPs (OECD,
n.d.). That explains the rationale behind Affordable
Care Act (ACA) of 2010 introducing 30-days
readmissions reduction as a key policy target.
Ensuing to that, Hospital Readmissions Reduction
Program (HRRP) was operationalized in 2012 when
CMS started financially penalizing Medicare-funded
hospitals with high readmission rates (CMS, n.d.-a).
While discussing ACA, Orszag and Emanuel
(2010) note, “hospital discharges has been identified
as a particular problem in the health care system
overall. More than half of these readmitted patients
have not seen their physician between discharge and
readmission, and a recent study suggests that better
coordination of care can reduce readmission rates for
major chronic illness. The policy provides $500
million over 5 years to manage care for 30 days after
hospital discharge and also imposes payment
penalties on hospitals with high risk-adjusted
readmission rates for certain conditions.”
These penalties and incentives focused on
reducing hospital readmissions have deeply
motivated practitioners and researchers to investigate
possible ways for reductions in hospital readmissions;
see following systematic literature reviews
(Kansagara et al., 2011, Leppin et al., 2014, Ross et
al., 2008). The research findings have emphasized,
inter alia, better discharge planning and transitionary
(alternate) care interventions.
2.2 Role of Discharge Planning and
Alternate Care in Reducing
Hospital Readmissions
A hospital discharge decision is complicated and it
needs to be well-informed (Pearson et al., 2004).
Besides medical history, current medical conditions,
and comorbidities data, it is also based on
demographic and external variables such as patient’s
physical abilities to independently carryout daily life
functions, cognitive abilities, the living quarters and
availability of family or caregivers to help the patient,
etc. (Allaudeen et al., 2011, Kassin et al., 2012, Maali
et al., 2018). Physicians and care providers have to
consider these variables during discharge planning
since they may lead to premature discharges, poor
transitions between different care settings, or poor
information exchanges during hand-offs, that are all
major reasons behind readmissions (CMS, 2013,
Hameed, 2019), which have big implications for well-
being of patients, their family members, and
professional caregivers.
CMS’s (Centers for Medicare and Medicaid
Services) guidelines §482.43 define ‘hospital
discharge planning’ as “a process that involves
determining the appropriate post-hospital discharge
destination for a patient; identifying what the patient
Predicting 30-days All-cause Hospital Readmissions Considering Discharge-to-alternate-care-facilities
865

requires for a smooth and safe transition from the
hospital to his/her discharge destination; and
beginning the process of meeting the patient’s
identified post-discharge needs” (CMS, 2013).
Alternative terms are also used by other agencies and
hospitals, such as “transition planning” or
“community care transitions” especially if there exist
post-acute-care healthcare needs of their patients.
Discharge planning is guided by professional
bodies in several countries. CMS under Department
of Health & Human Services (HHS), USA guides
care providers on proper discharge planning and
effective transition through post-acute-care needs or
continued care needs (CMS, 2013). Similarly, The
National Health Service and Community Care Act of
1990 established requirements for UK hospitals to
duly consider community care as part of discharge
decisions to improve patients’ health and lower
national healthcare system costs.
An inverse relationship has been proven between
quality of post-acute-care and early hospital
readmissions. Koehler et al., (2009) showed targeted
care bundle delivered to high-risk elderly inpatients
decreased unplanned 30-days acute admissions
following discharge. Similarly, Naylor et al., (2011)
found from several researches on transitionary care
that of all the interventions, discharge management
plus follow-up have the most significant effects on
reducing readmissions. Garåsen et al., (2007)
reported positive relationships between use of
alternate-care-facilities and reduction of
readmissions. Jones et al., (1999) stated that alternate
care is comparatively cheaper than acute care in
hospitals which constitutes for about 2.4 million
hospital days per year (Sutherland and Crump, 2013).
Despite affordable prices, alternate-care-facilities
provide services that are not too lower in quality than
acute care provided in hospitals (Wilson et al., 1997,
Richards et al., 1998).
Rich et al., (1995) observed the readmission rate
in elderly people with heart failure with ranges from
29 percent to 49 percent. He found improving transfer
care after the discharge reduces the readmission rates
in the elderly. Jack et al., (2009) also reported similar
results for general population based on self-reported
data in which the intervention group showed
comparatively lower readmission rate than the control
group not receiving any additional care. Naylor et al.,
(1999) went further in estimating reduction in
readmission might decrease up to US$3000 per
patient.
2.3 Alternate-care-facilities
Several forms of alternate care (also referred as tran-
sitionary or post-acute-care) can be provided after
discharge. In this paper we define ‘alternate care’ as
a prescribed medical intervention or benefit beyond
self-administration of prescription or off-the-counter
(OTC) medicines. Our definition of alternate care
includes any type of primary or secondary care
provided to anyone discharged from acute care or a
hospital. Post-discharge interventions typically
involve experienced professionals and therapists
ensuring patients have all necessary assistance,
equipment and help. Such post-discharge care is more
common in elderly with relatively higher risk of
readmission. Most common types of post-discharge
alternate care in the US healthcare system include
returning home with early supported discharge
(ESD), returning home with social care reablement,
transfer to a community hospital, or transfer to a
residential (nursing) home (Waring et al., 2014).
Based on the location, the alternate care can be
divided mainly into two subgroups; 1) primary or
secondary care delivered at home, and; 2) primary or
secondary care delivered at an alternate-care-facility
outside home.
First subgroup includes ‘home care with home
intravenous (IV) provider’ and general ‘home
healthcare’. Former means treatment at home with an
intravenous (IV) medicine or fluid that is supervised
by trained nurses or certified specialists. It provides
all necessary support at home of the patient and
partially covered by Medicare or government. Home
healthcare is home based treatment that is relatively
affordable with a designated agent who regularly
visits the patients’ home on appointment. Social care
reablement covers patients needing personal care on
a daily basis and lasts for about 6 weeks. It includes
bathing and other essential activities for those who
cannot help themselves and do not have family or
relatives to take care (CMS, n.d.-b)
Second subgroup, care at an alternate-care-
facility, includes Distinct Part Hospitals, Skilled
Nursing Facility (SNF), Intermediate Care Facility
(ICF), Hospice Medical Facility, Short-term Hospital,
and Long-term Care Hospital. Rehabilitation Distinct
Part Hospitals provide separated beds in specific
locations with SNF services. SNF involves full
medical services, nursing care as well as additional
services such as meals, medications and social
services provided by registered nurses, professional
therapists and physicians (CMS, n.d.-b). Commonly,
SNF is suggested for short-term rehabilitation after
serious injuries and partially covered by hospital
insurance and accounts for 15 percent of Medicare
funding (Buntin et al., 2010). Short-term hospitals are
specialized in providing active and short treatments
after injuries or after surgery care. Long Term Care
Cognitive Health IT 2020 - Special Session on Machine Learning and Deep Learning Improve Preventive and Personalized Healthcare
866

Hospital (LTCH) focus on extended treatment (more
than 25 days) and, commonly, functions as
sanatoriums for patients with chronic diseases (CMS,
n.d.). Compared to above noted alternate-care-
facilities, ICF offers lower degree of care since it is a
nursing home for those who do not require care given
at hospitals or any other special nursing facilities.
However, the degree of treatment that ICF patients
need are greater than given at home and, thus, needs
equipped nursing facilities. Hospice Medical facility
is a specially equipped home that provides necessary
care for those who have terminal illnesses with the
life expectancy of less than 6 months. It is covered by
Medicare, Medicaid, and most private insurance
companies.
Based on the literature review above, it is quite
sensible on healthcare providers’ part to consider
discharging high risk patients to alternate-care-
facilities wherever needed instead of only discharging
them to home. Alternate care interventions after
discharge ensure patients are highly aware of and
capable of taking care of their health or seeking and
receiving essential care outside the settings of
expensive hospitalization. The improved health
behaviour and cheaper methods of receiving care on
a regular basis reduces the number of readmissions.
2.4 Predicting Hospital Readmissions
within 30 Days and Beyond
From the patient dataset standpoint, Demir (2014)
identified three categories of readmission prediction
tools; models using retrospective administrative data,
models using real-time administrative data, and
models incorporating primary data collection. He
noted almost all the models he studied from numerous
researchers have very poor predictive power.
From the modelling techniques point of view,
there are two major approaches in 30DRAs
predictions literature. Even though both these
approaches involve supervised machine learning, in
which independent and dependent variables are
defined by the modeller, the first set of approaches
mainly calculate probability of re-admissions as a
continuous variable. They typically incorporate uni-
or multi-variate regression analysis, decisions trees
and Bayesian networks techniques for calculating the
probability of readmissions using several
independent variables. Subsequently, the variables
depicting significant relationships with readmissions
are weighted to build readmission risk scores and
indices. See for example HOSPITAL score by Donzé
et al., (2013) and LACE index by van Walraven et al.,
(2010). Kansagara et al., (2011) did a comprehensive
systematic review of such studies.
Second set of prediction techniques are based on
classification algorithms such as logistic regression,
naïve Bayes networks, decision trees and random
forests, etc. Rather than directly reporting
probabilities of readmission, these classifiers
categorize each record (admitted patient) into either
‘likely-to-be-readmitted’ or ‘not-likely-to-be-
readmitted’ classes. Neural network techniques are
also gaining much popularity in classification tasks.
From disease and conditions point of view,
readmissions prediction literature can be broadly be
seen focused either on all-cause-readmissions or very
narrowly focused on specific diseases or conditions
for instance heart patients, patients undergone
surgery, or elderly patients, etc.
Maali et al., (2018) looked at all-cause
readmission within 7 days, 30 days and 60 days at a
Sydney hospital. They found stronger associations
between more readmissions between 7-days and 30 or
60 days with old age and previously longer hospital
stays. Similarly, Choudhry et al., (2013) calculated
all-cause 30-days readmissions predictions in
Chicago area at two points of time, i.e. admission and
discharge. They tested a variety of variables like
demographics, visits, history and physical exam,
medications, conditions, past and present procedures,
lab tests and exploratory. The ROC (Receiver
Operating Characteristic) curves for all-cause
admissions and all-cause-discharge models depict
high AUC (area under the curves) above 0.75
depicting good sensitivity and precision. Billings et
al., (2012) used NHS data to come with a generic all-
cause 30-days readmission predictive model called
PARR-30. The AUC of their model at 0.7 is also
fairly good as it accounts for age, previous emergency
discharges, deprivation band of residence area and
history in prior 3 years and Charlson’s comorbidity
index. Building further on HOSPITAL score from his
2010 paper, Donzé et al., (2013) used a multi-logistic
regression classifier to calculate potentially avoidable
all-cause 30-days readmissions. His model depicts
good discriminatory power with AUC value of 0.71.
Numerous other studies and predictive models for
3o-day readmission risk have been developed based
on typical clinical data, see for example (Bottle et al.,
2006, Kassin et al., 2012, Van Walraven et al., 2011,
Allaudeen et al., 2011). They all demonstrated the
significance of independent variables such as
biomarkers, specific symptoms and conditions,
administrative data, demographics (such as race,
gender and age etc.) in predicting risk score of general
populations.
It is important to note even though all-causea re-
Predicting 30-days All-cause Hospital Readmissions Considering Discharge-to-alternate-care-facilities
867

admissions models, owing to their complexity and co-
variances, are generally poor in predictive power
when compared with specific disease models.
However, they use simplistic and commonly
available variables to make their models usable and
practical for care providers in clinical settings
especially on patient bed side. Shulan et al. (2013)
added diagnoses related groups (DRG) codes and
hierarchical condition categories (HCC) to
demonstrate that increasing predictive power of all –
purpose predictive models would require working
with more sophisticatedly managed data and
variables. Not surprisingly, one of their developed
model’s AUC reaches 0.8.
On the contrary, there are models focusing
specific medical conditions or patient cohorts. For
example, using NHS data of 930 patients with COPD
and asthma, Demir (2014) comprehensively
compared the predictive power of several different
techniques from both regression and classifier groups
using variables like prior outpatient accidents,
emergency visits, and length of stays. He achieved the
best predictive power for his models with AUCs in
tune of 0.9s though regression and multiple
regression classifiers performed better than
generalized additive models (GAMs) and
multivariate regression splines (MARS).
Desai and Stevenson (2012) showed significantly
high rate of readmission in patients with heart failures
- approximately 24 percent within only 30 days for
patients with pulmonary artery diastolic pressure,
chronic filling pressure elevation, ejection fraction,
natriuretic peptides and cardiac troponins. (Sharif et
al., 2014) suggested yet another model for elderly
with chronic obstructive pulmonary disease (COPD).
It can be argued whether or not 30-day
readmissions can be prevented entirely but several
studies have established that nearly one-third of
overall readmission rates might be predictable (Van
Walraven et al., 2011, Ross et al., 2009). There is still
much room for research on prevention of 30-days re-
admissions through better predictions and
interventions. Regardless, both the above noted
predictive modelling research strands have not duly
treated interventions involving transitionary care in
alternate-care-facilities.
3 30-DAYS READMISSIONS
PREDICTIVE MODEL WITH
DISCHARGE-TO-ALTERNATE-
CARE VARIABLES
3.1 Defining Target (Dependent) and
Predictor (Independent) Variables
We have designed a simple classification problem
with ‘30-Day Readmission’ as a binary target
dependent variable. A value of ‘1’ means likely
readmission within 30 days of discharge whereas ‘0’
represents a patient not likely to be readmitted within
30 days. In addition to that, we have incorporated
several categories of independent variables (features)
i.e. demographics, current admission and care levels
including DRG severity, prior discharge locations
from previous readmission (i.e. discharges-to-
alternate-care) and finally comorbidity levels. See
Table 1 on next page for all the variables and their
possible values.
3.2 Mining Data from MIMIC-III
Our dataset comprises of the MIMIC-III database
which is freely accessible de-identified database of
about 40,000 critical care patients at Beth Israel
Deaconess Medical Center between 2001 and 2012
(Pollard, 2016, Johnson et al., 2016). It contains
125557 unique admission records which includes
several readmissions, many under 30 days. The
clinical database contains variables on patient
demographics, diagnosis (ICD-9 codes), labs,
procedures, medications, admissions and discharge
history and more. Both available and extracted
variables included in this study are depicted in Table
1 along with the values they assume.
The database was loaded on an open source
PostgresSQL database server. SQL queries were
written to mine variables/features for patients who
were readmitted ever in the hospital. 12379 extracted
records were then subjected to further processing in
Microsoft Excel to identify patient records with under
30 days readmissions and matching their discharge
location data from their previous admission records.
Comorbidity levels for each of the records were then
also extracted from DRG_CODE DESCRIPTIONS
as ‘none’, ‘with comorbid conditions’, and ‘with
major comorbid conditions’. 3191 readmissions
records were available for analysis. In order to ensure
class balance, a block of around 3600 records for non-
admitted patients was appended. That brought the test
and training dataset sample size to 6773 records.
Cognitive Health IT 2020 - Special Session on Machine Learning and Deep Learning Improve Preventive and Personalized Healthcare
868
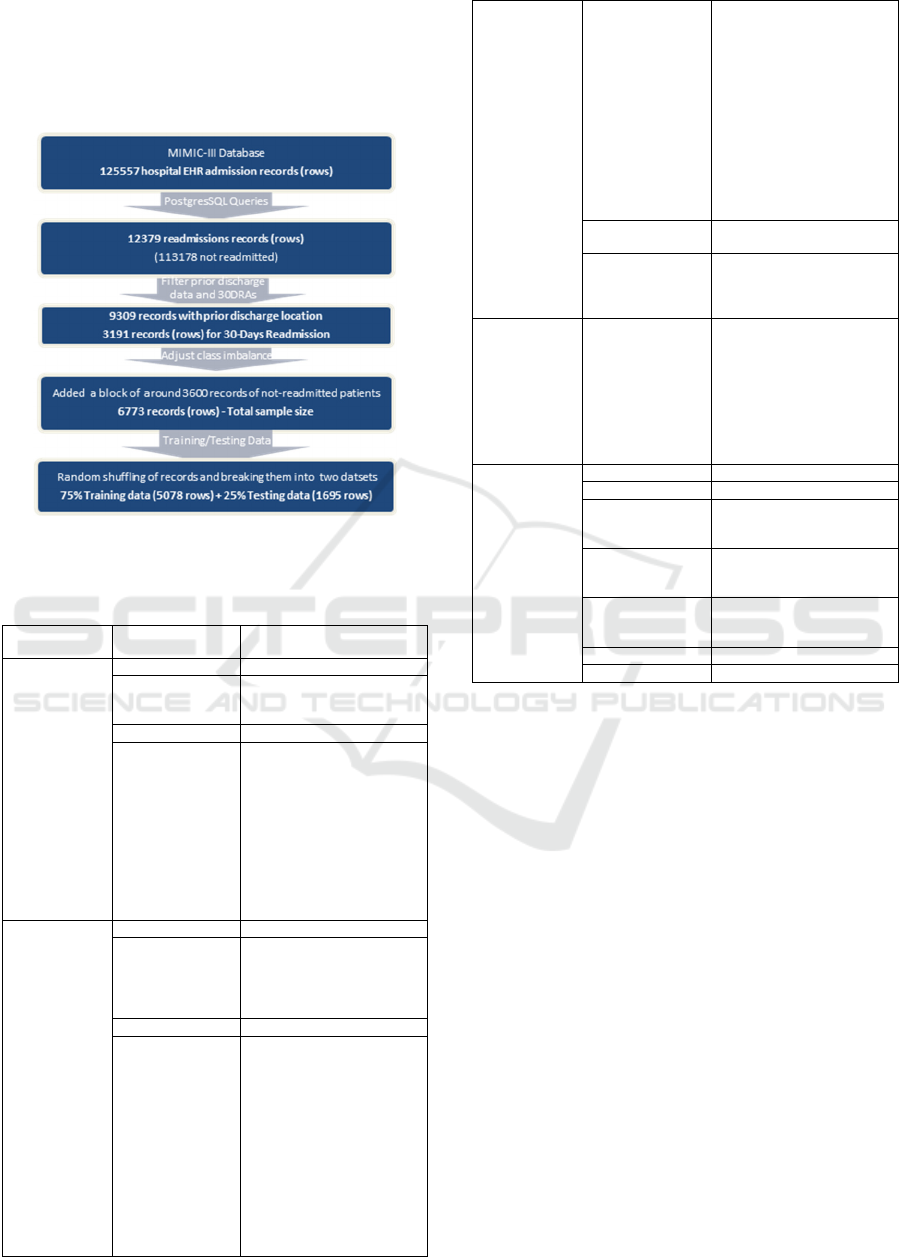
After random sorting the records, it was further
broken down into two datasets comprising 5078
records (75%) for model training and 1695 records
(25%) as hold-out dataset for testing. Figure 1
elaborates the whole data preparation process.
Figure 1: Step-wise data mining and processing.
Table 1: Variables (Features) included in the predictive
model with their values (available or extracted).
Category
Predictor
Variables
Values
Demographics
Gende
r
Male, Female
Marital Status
Single, Divorced, Widowed,
Married, Life Partner
Se
p
arated, Null, Unknown
Age < 89 years
Ethnicity
7 types Asian (e.g. Chinese,
Cambodian, etc.), 4 types
Black (e.g. Black African,
Black Haitian, 10 types
Hispanics, 4 types White,
American Indian/Alaskan
Native, Native Hawaiian,
Portuguese, Multi-Racial,
Middle Eastern, Unable to
obtain, Declined to Answer,
Other
Current
Admission and
Care Level
Admission T
yp
e Elective, Emer
g
enc
y
, Ur
g
ent
Admission
Location for
Current Admission
Clinical Referral/Premature,
Emergency Admit, Phys
Referral/Normal Deli, Tranf
from Hosp/Extram, Transf
from Other Healt, Trans
Length of Stay Number of Days
Discharge
Location for
Current Admission
SNF, Hosp, Home, Home
Healthcare, Home with Home
IV Providr, Hospice – Home,
Hospice – Medical Facility,
ICF, Long Term Care
Hospital, Short Term
Hospital, Rehab/Distinct Part
Hospital 1, Rehab/Distinct
Part Hospital 2
Not Included:
Dead/Expired, Disc-Tran to
Psyc Hosp, Disc-Tran to
Children/Cancer, Left
Against Medical Advi, Other
Facility,
Diagnosis_DRG_
CODE
ICD-9 Codes
Diagnosis_DESC
RIPTION
Detailed textual description
of Diagnosis including
comorbidity notes - Not
included here
Discharge
Location for
Previous
Admission
Previous
Discharge
Location
SNF, Hosp, Home, Home
Healthcare, Home with Home
IV Providr, Hospice – Home,
Hospice – Medical Facility,
ICF, Long Term Care
Hospital, Short Term
Hospital, Rehab/Distinct Part
Hospital 1, Rehab/Distinct
Part Hos
p
ital 2
Comorbidity
Conditions
Dru
g
Severit
y
4 levels: 1,2,3,4
Drug Mortality 4 levels: 1,2,3,4
None
0,1 (extracted from text of
Diagnosis_DESCRIPTION
)
With Comorbid
Conditions
0,1 (extracted from text of
Diagnosis_DESCRIPTION
)
With Major
Comorbid
Conditions
0,1 (extracted from text of
Diagnosis_DESCRIPTION
)
SAPS II Score Not included
SOFA Score Not included
The final dataset comprising 6773 patient-
admission records is fairly dispersed on gender,
ethnicity, and marital status making it a good sample
patient wise. Class balance of readmissions is near to
perfect after adjustments. The sample is slightly
skewed for ‘previous discharge location’ variable
towards discharge-to-alternate-care but since that
alternate care is also well dispersed over several
different alternate-care-facilities, it appears to work
fine, especially in the wake of around 1500 discharge-
to-home records. Figure 2 highlights all the
descriptive of the final dataset for testing and
analysis.
3.3 Model Training and Testing
Results and Analysis
Considering the size of the dataset and the variety of
predictor variables in the above model, it was trained
and tested on four different classification techniques
i.e. multi-logistic regression, Naïve Bayes, random
forest and a neural network. Ridge 2 regularization
was used for multi-logistic regression with a strength
C value set at 65. For random forest 2 number of trees
Predicting 30-days All-cause Hospital Readmissions Considering Discharge-to-alternate-care-facilities
869
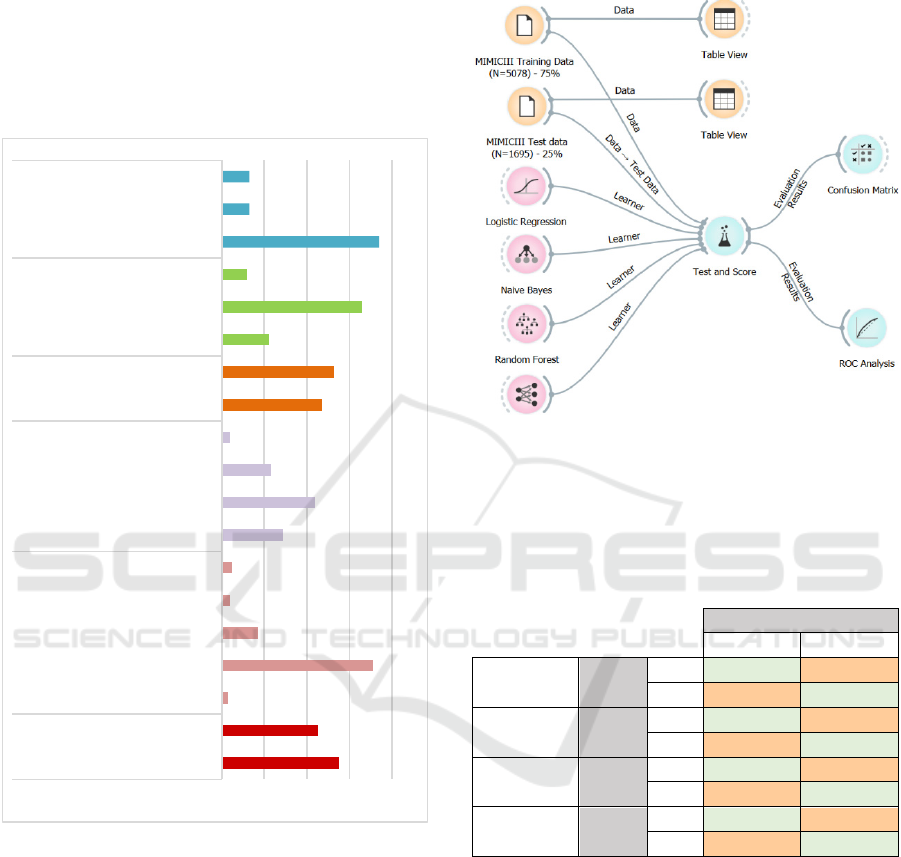
were specified with 5 attributes at each split. Limit
depth of individual trees was left at default 3 while as
the algorithm was configured not to split individual
subsets smaller than 5. The neural network with 100
neurons was activated using most common ReLu
function. Adam solver was used while regularization
alpha was set at 0.005. One hundred iterations were
requested of the neural network.
Figure 2: Description of Finalized Dataset.
Figure 3 depicts a process flow developed and
executed in open source Orange software for testing
and training the model. 75% of the 6773 records were
set for training dataset while the testing was
performed on the rest 25% records in the same
dataset. A higher number of 20 folds were set for
better cross-validation. Classification results were
calculated mainly as average over both classes but
also for target classes 0 and 1 respectively.
After obtaining the predictions several
performance evaluation metrics have been used to
analyse and interpret the model performance
including confusion matrices, AUC - ROC curves,
sensitivity, Recall and F1 scores of each machine
learning model.
Figure 3: Process flow for training and testing the predictive
model (developed in open source ‘Orange’ ML and
visualization software’: https://orange.biolab.si/).
Table 2: Confusion Matrices for all ML models including
both discharge-to-home and discharge-to-alternate-care
variables; 0 represents no-30-days readmission while 1
represents readmission within 30 days.
Predicted
0 1
Logistic
Regression
Actual
0
86.60% 13.40%
1 51.00% 49.00%
Naïve
Bayes
Actual
0
72.00% 28.00%
1 45.80% 54.20%
Random
Forest
Actual
0
75.10% 24.90%
1 48.10% 51.90%
Neural
Network
Actual
0
82.80% 17.20%
1 45.80% 54.20%
Confusion matrices in Table 2 highlight the fact,
overall Random Forest and Naïve Bayes classifiers
did not perform as good as Logistic Regression and
Neural Networks. The true positive (TP) predictions
of Random Forest and Naïve Bayes are at 51.9% and
54.2% percent respectively while their true negatives
(TN) predictions are at 75.1% and 72% respectively.
Consequently, their accuracy and precision both are
not the best for consideration even though it could be
called fair. The same is apparent in the ROC and AUC
curves (see figure 4) where both Random Forest and
Naïve Bayes are not the best performers.
55%
45%
2,70%
71%
17%
4%
5%
29%
44%
23%
4%
47%
53%
22%
66%
12%
74%
13%
13%
0% 20% 40% 60% 80%
Male
Female
Asian
White
Black
Hispanic
Others/NotKnown
Single
Married/LifePartner
Divorced/Widowed/Separated
NotknownorNotreported
Readmittedwithin30Days
Notreadmittedwithin30Days
Discharged‐to‐Home
Discharged‐to‐AlternateCare
OthersorNotKnown
None
Withcomorbidities
Withcriticalcomorbidities
Gender Ethnicity MaritalStatus Readmission
PreviousDischarge
Location
Comorbid
Conditions
Cognitive Health IT 2020 - Special Session on Machine Learning and Deep Learning Improve Preventive and Personalized Healthcare
870
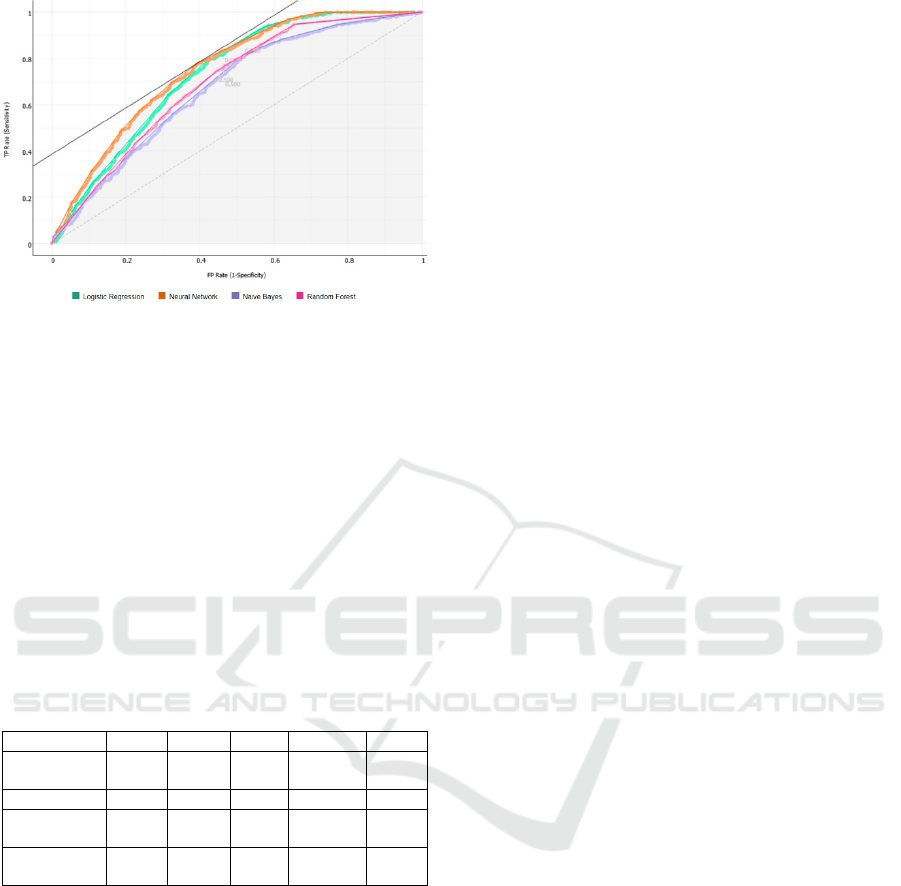
Figure 4: AUC-ROC curves (Target class: 0, Costs: FP =
500, FN = 500 Target probability: 50.0 %).
However, confusion matrices, and performance
metrics scores (see Table 3) of neural networks and
logistic regression algorithms appear to have
predictive power in terms of accuracy as well as
precision. With an AUC of 0.75 for the neural
network and 0.73 for random forest, it is clear that
alternate care has a role in correctly predicting 30-
days readmissions. With high Recall scores nearing
0.7 both of these models can be used to help
healthcare providers correctly predict the potential
30-days readmissions during discharge planning.
Table 3: Performance of different machine learning models
including discharge-to-home as well as discharge-to-
alternate-care variables.
Model AUC CA F1 Precision Recall
Logistic
Regression
0.729 0.683 0.670 0.707 0.683
Naive Bayes 0.669 0.633 0.630 0.635 0.633
Random
Fores
t
0.691 0.651 0.648 0.654 0.651
Neural
Network
0.750 0.688 0.682 0.701 0.688
In order to differentiate the contribution of
discharge-to-alternate-care-facilities from the
original model, the variables related to alternate care
were temporarily excluded from the model. These
excluded variables comprised Home Healthcare,
Home with Home IV Providr, Hospice – Home,
Hospice – Medical Facility, Long Term Care
Hospital, Short Term Hospital, ICF, Rehab/Distinct
Part Hospital 1, Rehab/Distinct Part Hospital 2 and
SNF. The resulting models were trained and tested
again. Around 10 point/percent increase in the
prediction power of neural networks and logistic
regression models was noted owing to alternate care
variables. Overall, Neural Networks outperformed all
other models.
4 CONCLUSIONS AND FUTURE
RESEARCH
This research developed and tested a supervised
predictive model for 30-days readmissions. Based on
the considered discharge location of the patient
during discharge planning process, health care
providers can find this decision support quite
valuable. It is especially valuable in the wake of
financial penalties imposed by CMS on Medicare-
funded hospitals. Previous all-cause 30-days hospital
readmissions prediction research had been poor in
terms of predictive power with few exceptions
(Demir, 2014, Shulan et al., 2013). However, there
are no models using alternate care or transitionary
care variables for such predictions. This paper
contributes by developing a simple yet good
predictive power neural network model for all-cause
30-days readmissions.
Such predictive models considering pathways and
transitions between alternate-care-facilities should be
very interesting for insurance providers due to their
coverage and cost implications. The intentions and
benefits of insurance companies may be studied
further in this context.
Another area of work is stratification and
predicting alternate-care-pathways for patients with
most common but critical diseases and conditions.
Their numbers and desired care levels might differ
from general all-cause readmission patients.
Future work is being carried out to improve it into
a formal 30-days readmissions risk model duly
considering alternate care variables by also
systematically incorporating comorbidity scores,
such as SAPS II and SOFA, as well as current lab
results, procedures, previous admissions and medical
history. It is expected that the final predictive model
can achieve an accuracy of above 90%. Once
completed, it will go into creation of a clinical
decision support app/tool that can be linked with most
typical hospital EHR systems for use on patient
bedside and clinical settings during discharge and
transitionary care planning.
ACKNOWLEDGEMENTS
Partial research support from Faculty Development
Grants 2019-2020 at Merrimack College is gratefully
acknowledged.
Authors would also like to thank Ms. Shyryn
Sakahanova for her valuable research assistance.
Predicting 30-days All-cause Hospital Readmissions Considering Discharge-to-alternate-care-facilities
871

REFERENCES
Allaudeen, N., Vidyarthi, A., Maselli, J. & Auerbach, A.
2011. Redefining readmission risk factors for general
medicine patients. Journal of Hospital Medicine, 6, 54-
60.
Billings, J., Blunt, I., Steventon, A., Georghiou, T., Lewis,
G. & Bardsley, M. 2012. Development of a predictive
model to identify inpatients at risk of re-admission
within 30 days of discharge (PARR-30). BMJ open, 2,
e001667.
Bottle, A., Aylin, P. & Majeed, A. 2006. Identifying
patients at high risk of emergency hospital admissions:
a logistic regression analysis. Journal of the Royal
Society of Medicine, 99, 406-414.
Buntin, M. B., Colla, C. H., Deb, P., Sood, N. & Escarce, J.
J. 2010. Medicare spending and outcomes after post-
acute care for stroke and hip fracture. Medical care, 48,
776.
Choudhry, S. A., Li, J., Davis, D., Erdmann, C., Sikka, R.
& Sutariya, B. 2013. A public-private partnership
develops and externally validates a 30-day hospital
readmission risk prediction model. Online journal of
public health informatics, 5, 219.
CMS 2013. Revision to State Operations Manual (SOM),
Hospital Appendix A - Interpretive Guidelines for 42
CFR 482.43, Discharge Planning. Baltimore:
Department of Health and Human Services - Center for
Clinical Standards and Quality/Survey & Certification
Group
CMS. n.d.-a. Hospital Readmissions Reduction Program
(HRRP) [Online]. Centers for Medicare and Medicaid
Services Available: https://www.cms.gov/Medicare/
Medicare-Fee-for-Service-
Payment/AcuteInpatientPPS/Readmissions-Reduction-
Program [Accessed Oct 10 2019 ].
CMS. n.d.-b. What Medicare Covers [Online]. Centers for
Medicare and Medicaid Services - Medicare. Available:
https://www.medicare.gov/what-medicare-covers
2019].
CMS. n.d. . Long-Term Care Hospital PPS [Online].
Centers for Medicare and Medicaid Services.
Available: https://www.cms.gov/Medicare/Medicare-
Fee-for-Service-
Payment/LongTermCareHospitalPPS/index [Accessed
Oct 10 2019].
Demir, E. 2014. A decision support tool for predicting
patients at risk of readmission: A comparison of
classification trees, logistic regression, generalized
additive models, and multivariate adaptive regression
splines. Decision Sciences, 45, 849-880.
Desai, A. S. & Stevenson, L. W. 2012. Rehospitalization
for heart failure: predict or prevent? Circulation, 126,
501-506.
Donzé, J., Aujesky, D., Williams, D. & Schnipper, J. L.
2013. Potentially avoidable 30-day hospital
readmissions in medical patients: derivation and
validation of a prediction model. JAMA internal
medicine, 173, 632-638.
Garåsen, H., Windspoll, R. & Johnsen, R. 2007.
Intermediate care at a community hospital as an
alternative to prolonged general hospital care for
elderly patients: a randomised controlled trial. BMC
public health, 7, 68.
Halfon, P., Eggli, Y., Prêtre-Rohrbach, I., Meylan, D.,
Marazzi, A. & Burnand, B. 2006. Validation of the
potentially avoidable hospital readmission rate as a
routine indicator of the quality of hospital care. Medical
care, 44, 972-981.
Hameed, T. 2019. Clinical Decision Support Systems
Leverage Machine Learning for Predictive Analytics.
IEEE Future Directions July 2019 ed.: Institue of
Electrical and Electronics Engineers.
Jencks, S. F., Williams, M. V. & Coleman, E. A. 2009.
Rehospitalizations among patients in the Medicare fee-
for-service program. New England Journal of
Medicine, 360, 1418-1428.
Johnson, A. E., Pollard, T. J., Shen, L., Li-wei, H. L., Feng,
M., Ghassemi, M., Moody, B., Szolovits, P., Celi, L. A.
& Mark, R. G. 2016. MIMIC-III, a freely accessible
critical care database. Scientific data, 3, 160035.
Kansagara, D., Englander, H., Salanitro, A., Kagen, D.,
Theobald, C., Freeman, M. & Kripalani, S. 2011. Risk
prediction models for hospital readmission: a
systematic review. Jama, 306, 1688-1698.
Kassin, M. T., Owen, R. M., Perez, S. D., Leeds, I., Cox, J.
C., Schnier, K., Sadiraj, V. & Sweeney, J. F. 2012. Risk
factors for 30-day hospital readmission among general
surgery patients. Journal of the American College of
Surgeons, 215, 322-330.
Koehler, B. E., Richter, K. M., Youngblood, L., Cohen, B.
A., Prengler, I. D., Cheng, D. & Masica, A. L. 2009.
Reduction of 30‐day postdischarge hospital
readmission or emergency department (ED) visit rates
in high‐risk elderly medical patients through delivery of
a targeted care bundle. Journal of hospital medicine: an
official publication of the Society of Hospital Medicine,
4, 211-218.
Leppin, A. L., Gionfriddo, M. R., Kessler, M., Brito, J. P.,
Mair, F. S., Gallacher, K., Wang, Z., Erwin, P. J.,
Sylvester, T. & Boehmer, K. 2014. Preventing 30-day
hospital readmissions: a systematic review and meta-
analysis of randomized trials. JAMA internal medicine,
174
, 1095-1107.
Maali, Y., Perez-Concha, O., Coiera, E., Roffe, D., Day, R.
O. & Gallego, B. 2018. Predicting 7-day, 30-day and
60-day all-cause unplanned readmission: a case study
of a Sydney hospital. BMC medical informatics and
decision making, 18, 1.
Mechanic, R. 2014. Post-acute care—the next frontier for
controlling Medicare spending. New England Journal
of Medicine, 370, 692-694.
MedPAC 2013. Report to the Congress, Medicare Payment
Policy, Medicare Payment Advisory Commission.
Naylor, M. D., Aiken, L. H., Kurtzman, E. T., Olds, D. M.
& Hirschman, K. B. 2011. The importance of
transitional care in achieving health reform. Health
affairs, 30, 746-754.
Cognitive Health IT 2020 - Special Session on Machine Learning and Deep Learning Improve Preventive and Personalized Healthcare
872

Naylor, M. D., Brooten, D., Campbell, R., Jacobsen, B. S.,
Mezey, M. D., Pauly, M. V. & Schwartz, J. S. 1999.
Comprehensive discharge planning and home follow-
up of hospitalized elders: a randomized clinical trial.
Jama, 281, 613-620.
OECD. n.d. . Health Status Key Indicators [Online]. The
Organisation for Economic Co-operation and
Development. Available: https://stats.oecd.org/
Index.aspx?DatasetCode=HEALTH_STAT [Accessed
Oct 10 2019 ].
Orszag, P. R. & Emanuel, E. J. 2010. Health care reform
and cost control. New England Journal of Medicine,
363, 601-603.
Pearson, P., Procter, S., Wilcockson, J. & Allgar, V. 2004.
The process of hospital discharge for medical patients:
a model. Journal of advanced nursing, 46, 496-505.
Pollard, T. J. J., A. E. W. 2016. The MIMIC-III Clinical
Database http://dx.doi.org/10.13026/C2XW26
Richards, S. H., Coast, J., Gunnell, D. J., Peters, T. J.,
Pounsford, J. & Darlow, M.-A. 1998. Randomised
controlled trial comparing effectiveness and
acceptability of an early discharge, hospital at home
scheme with acute hospital care. Bmj, 316, 1796-1801.
Ross, J. S., Chen, J., Lin, Z. Q., Bueno, H., Curtis, J. P.,
Keenan, P. S., Normand, S.-L. T., Schreiner, G.,
Spertus, J. A. & Vidán, M. T. 2009. Recent national
trends in readmission rates after heart failure
hospitalization. Circulation: Heart Failure,
CIRCHEARTFAILURE. 109.885210.
Ross, J. S., Mulvey, G. K., Stauffer, B., Patlolla, V.,
Bernheim, S. M., Keenan, P. S. & Krumholz, H. M.
2008. Statistical models and patient predictors of
readmission for heart failure: a systematic review.
Archives of internal medicine, 168, 1371-1386.
Sharif, R., Parekh, T. M., Pierson, K. S., Kuo, Y.-F. &
Sharma, G. 2014. Predictors of early readmission
among patients 40 to 64 years of age hospitalized for
chronic obstructive pulmonary disease. Annals of the
American Thoracic Society, 11, 685-694.
Shulan, M., Gao, K. & Moore, C. D. 2013. Predicting 30-
day all-cause hospital readmissions. Health care
management science, 16, 167-175.
Sutherland, J. M. & Crump, R. T. 2013. Alternative level of
care: Canada's hospital beds, the evidence and options.
Healthcare Policy, 9, 26.
Van Walraven, C., Bennett, C., Jennings, A., Austin, P. C.
& Forster, A. J. 2011. Proportion of hospital
readmissions deemed avoidable: a systematic review.
Canadian Medical Association Journal, 183, E391-
E402.
van Walraven, C., Dhalla, I. A., Bell, C., Etchells, E., Stiell,
I. G., Zarnke, K., Austin, P. C. & Forster, A. J. 2010.
Derivation and validation of an index to predict early
death or unplanned readmission after discharge from
hospital to the community. Canadian Medical
Association Journal, 182, 551-557.
Waring, J., Marshall, F., Bishop, S., Sahota, O., Walker, M.
F., Currie, G., Fisher, R. J. & Avery, T. J. 2014. An
ethnographic study of knowledge sharing across the
boundaries between care processes, services and
organisations: the contributions to ‘safe’hospital
discharge. Health Services and Delivery Research, 2, 1-
160.
Wilson, A., Parker, H., Wynn, A., Jones, J., Spiers, N. &
Jagger, C. 1997. Hospital at home is as safe as hospital,
cheaper, and patients like it more: early results from a
randomised controlled trial. Society for Social
Medicine abstracts. J Epidemiol Community Health, 51,
593.
Zohrabian, A., Kapp, J. M. & Simoes, E. J. 2018. The
economic case for US hospitals to revise their approach
to heart failure readmission reduction. Annals of
translational medicine, 6.
Predicting 30-days All-cause Hospital Readmissions Considering Discharge-to-alternate-care-facilities
873
