
Development of Agents that Create Melodies based on Estimating
Gaussian Functions in the Pitch Space of Consonance
Hidefumi Ohmura
1 a
, Takuro Shibayama
2
, Keiji Hirata
3
and Satoshi Tojo
4
1
Department of Information Sciences, Tokyo University of Science, 2641 Yamazaki, Noda-shi, Chiba, Japan
2
Department of Information Systems and Design, Tokyo Denki University,
Ishizaka, Hatoyama-cho, Hikigun, Saitama, Japan
3
Department of Complex and Intelligent Systems, Future University Hakodate,
116-2, Kamedanakano-cho, Hakodate-shi, Hokkaido, Japan
4
Graduate School of Information Science, Japan Advanced Institute of Science and Technology,
1-1 Asahidai, Nomi-shi, Ishikawa, Japan
Keywords:
Music, Melody, Lattice Space, GMM, EM Algorithm.
Abstract:
Music is organized by simple physical structures, such as the relationship between the frequencies of tones.
We have focused on the frequency ratio between notes and have proposed lattice spaces, which express the
ratios of pitches and pulses. Agents produce melodies using distributions in the lattice spaces. In this study,
we upgrade the system to analyze existing music. Therefore, the system can obtain the distribution of the pitch
in the pitch lattice space and create melodies. We confirm that the system fits the musical features, such as
modes and scales of the existing music as GMM. The probability density function in the pitch lattice space is
suggested to be suitable for expressing the primitive musical structure of the pitch. However, there are a few
challenges of not adapting a 12-equal temperament and dynamic variation of the mode; in this study, we focus
on these challenges.
1 INTRODUCTION
Music is essential in various cultures, and people have
used music for various purposes (DeNora, 2000). It is
often thought that only professional musicians create
music; however, this is not true because almost ev-
eryone creates music, for example, when they hum
and whistle a melody by intuition in the bathroom
(Jordania, 2010). Why do people with limited mu-
sical education enjoy listening to music and creating
melodies? We believe that the reason comes from
the gestalt perception of humans. Music is organized
by simple physical structures, such as the relation-
ship between the frequencies of tones. Humans can
understand musical structures because they can often
discern the relationship between frequencies. Ledahl
and Jackendoff proposed the theory to analyze mu-
sic based on musical gestalt perception (Meyer, 1956;
Lerdahl and Jackendoff, 1983).
We focused on the frequency ratios of the funda-
mental relations between tones, and the development
a
https://orcid.org/0000-0003-4373-0890
of agents that create melodies as a system (Ohmura
et al., 2018; Ohmura et al., 2019). The frequency ratio
refers to the interval between two basic frequencies
of tones and note values between pulse frequencies of
the sound timing. The agents in the system produce
notes based on the probability density function. There
are two types of spaces, one for pitch and another for
musical values. The agents have a probability density
function consisting of one or two normal distributions
in every two spaces. This system provides simple
melodies like humming and whistling. Moreover, the
system creates a structure of the musical theory, such
as musical modes and complex rhythms. Therefore,
it was suggested that the spaces based on frequency
ratios could express musical structures quantitatively.
However, the system was only capable of creating
melodies and was unable to analyze existing music.
In this study, we make improvements to the system
to analyze existing music and express the probability
density functions of the spaces based on frequency
ratios. First, we provide a system analyzing pitches
of existing music. This system can read a Standard
MIDI file (SMF) as existing music. The system anal-
Ohmura, H., Shibayama, T., Hirata, K. and Tojo, S.
Development of Agents that Create Melodies based on Estimating Gaussian Functions in the Pitch Space of Consonance.
DOI: 10.5220/0009382203630369
In Proceedings of the 12th International Conference on Agents and Artificial Intelligence (ICAART 2020) - Volume 1, pages 363-369
ISBN: 978-989-758-395-7; ISSN: 2184-433X
Copyright
c
2022 by SCITEPRESS – Science and Technology Publications, Lda. All rights reserved
363
880Hz
(A5)!
990Hz
(B5)!
660Hz
(E5)
!
440Hz
(A4)!
495Hz
(B4)!
2:3!
5th!
4th
3:4
Octave1:2
1320Hz
(E6)
!
330Hz
(E4)
!
Octave1:2
Octave1:2
Octave1:2
4th
3:4
2:3!
5th!
4th
3:4
4th
3:4
2:3!
5th!
2:3!
5th!
Figure 1: Relationships between pitch (interval).
yses the file and creates a density function for each
melody. The system can then output melodies based
on each density function. Moreover, users can per-
form readjustment of parameters of the distributions
to control the musical structures of the outputs.
2 LATTICE SPACES BASED ON
FREQUENCY RATIOS
2.1 Interval and Musical Temperament
The pitch of a note is defined by the frequency of air
vibration. Real sounds consist of various frequencies,
and humans recognize the lowest frequency, which is
called the fundamental frequency, as the pitch of the
note. The relationship between two notes, which is
called the interval, is defined as the frequency ratio.
There are four intervals called the perfect consonance,
a unison, a perfect fourth, a perfect fifth, and an oc-
tave. Humans feel they are the best-matched interval
group.
These groups are based on primitive ratios. A fre-
quency ratio of 1:1 between two pitches creates a uni-
son. A frequency ratio of 1:2 between two pitches
creates an octave. A frequency ratio of 2:3 between
two pitches creates a perfect fifth. A frequency ratio
of 3:4 between two pitches creates a perfect fourth.
Figure 1 shows pitches of notes created by perfect
consonance based on 660Hz (E5);
The frequency values are created from 660Hz us-
ing Pythagorean temperament, which is one of the
musical temperaments. The Pythagorean temper-
ament is only based on ratios, 1:2, 2:3, and 3:4,
and its temperament provides accurate values of per-
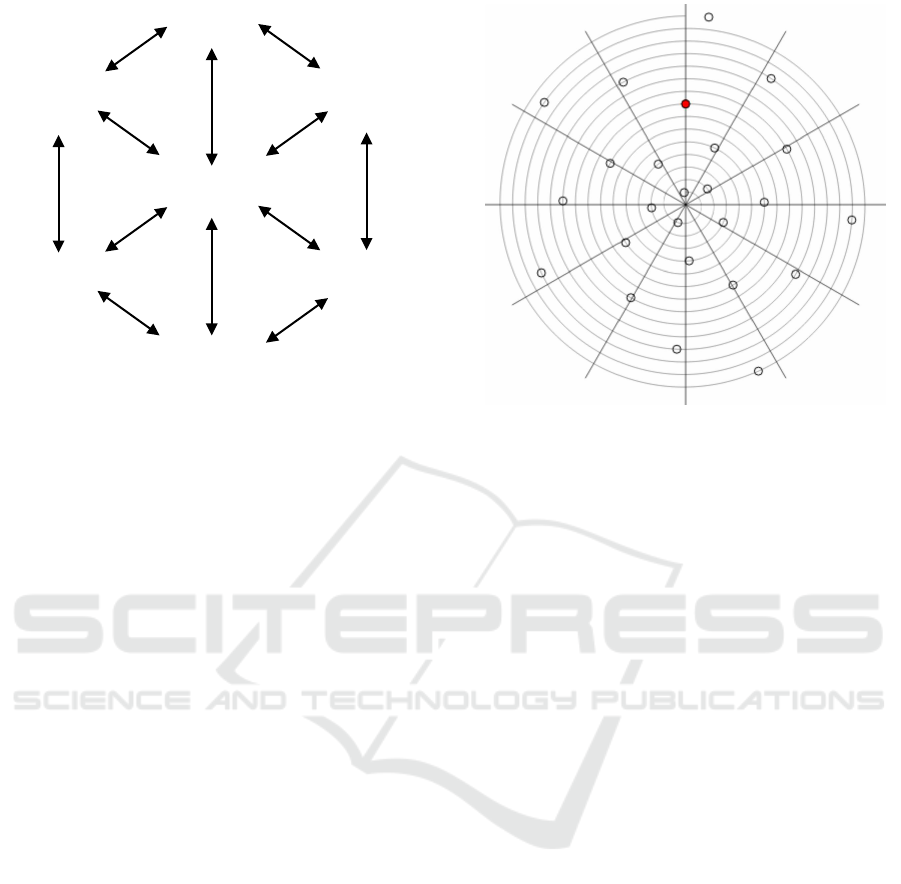
Figure 2: Comparing Pythagorean tuning with 12-equal
temperament.
fect consonance. However, Pythagorean temperament
does not define 12 notes because of the Pythagorean
comma based on 2
7
, (3/2)
12
. The most popular tem-
perament is 12-equal temperament, which divides an
octave into twelfths. The 12-equal temperament treats
12 notes equally but does not provide accurate val-
ues of the consonance. Figure2 shows differences
between Pythagorean temperament and the 12-equal
temperament. The whorl shows the mean values of
the pitch, and the outer position is larger than the inner
position. The same angle signifies octaves (1:2:4:8...).
Twelve lines show the pitch notation of the 12-equal
temperament. Circles show positions depending on
the perfect fifths ((3/2)
n
,n = 1,2,3) from the red cir-
cle. In this study, because of SMF, we adopt the 12-
equal temperament to the system.
2.2 Lattice Spaces
There are two spaces in the system. The first space
expresses pitch frequencies, called the pitch lattice
space, and the other space expresses frequencies of
the sound timing of pulses, called the rhythm lattice
space. Figure 3 is the expanded space from Figure 1.
Next, we explain the rhythm lattice space. In
rhythm, the frequencies of pulses are vital features.
When a listener hears two pulses whose relationship
is 1:2, they may feel a duple meter. Figure 5 shows the
relationship. When the relationship is 1:3, the listener
may feel a triple meter. Moreover, when a relation-
ship is 1:5, the listener may feel a quintuple meter.
However, one generally feels a quintuple meter as a
2 + 3 meter, for the quintuple meter is relatively chal-
lenging to perceive by the human ear. Actual music
HAMT 2020 - Special Session on Human-centric Applications of Multi-agent Technologies
364
×9/8!
× 2!
880Hz!
A5
3520Hz!
A7
1760Hz!
A6
440Hz!
A4
220Hz!
A3
110Hz!
A2
55Hz!
A1
22.5Hz!
A0
2640Hz!
E7
5280Hz!
E8
1320Hz!
E6
660Hz!
E5
330Hz!
E4
165Hz!
E3
82.5Hz!
E2
41.3Hz!
E1
7920Hz!
B8
3960Hz!
B7
1980Hz!
B6
990Hz!
B5
495Hz!
B4
247.5Hz!
B3
123.8Hz!
B2
5940Hz!
G"8
2970Hz!
G"7
1485Hz!
G"6
742.5Hz!
G"5
371.3Hz!
G"4
32.6Hz!
C1
521.1Hz!
C5
130.4Hz!
C3
65.2Hz!
C2
16.3Hz!
C0
260.7Hz!
C4
97.8Hz!
G2
1564.4Hz!
G6
391.1Hz!
G4
195.6Hz!
G3
48.9Hz!
G1
24.4Hz!
G0
782.2Hz!
G5
7040Hz!
A8
293.3Hz!
D4
4693.3Hz!
D8
1173.3Hz!
D6
586.7Hz!
D5
146.7Hz!
D3
73.3Hz!
D2
36.7Hz!
D1
2346.7Hz!
D7
18.3Hz!
D0
1043.0Hz!
C6
2085.9Hz!
C7
4171.9Hz!
C8
3128.9Hz!
G7
6257.8Hz!
G8
260.7Hz!
B1
20.6Hz!
E1
260.7Hz!
B0
185.6Hz!
G"3
92.8Hz!
G"2
46.4Hz!
G"1
23.2Hz!
G"0
× 4/3
! × 3/2!
Figure 3: The pitch lattice space based on f 2:3 and 3:4.
× 1/2
× 2
× 1/2
× 2
× 1/3
× 3
× 1/3
× 3
Figure 4: Relations between pulses.
consists of many pulses. A listener feels the strongest
or most frequent pulse as the meter of the music, and
the less frequent pulses as weak beats and up beats.
Monophony, however, lacks beats, such that a listener
at times may not feel any meter. For example, some
pieces of the Gregorian chant provide some rhythmic
interpretations, which is also true in the melodies of
humming.
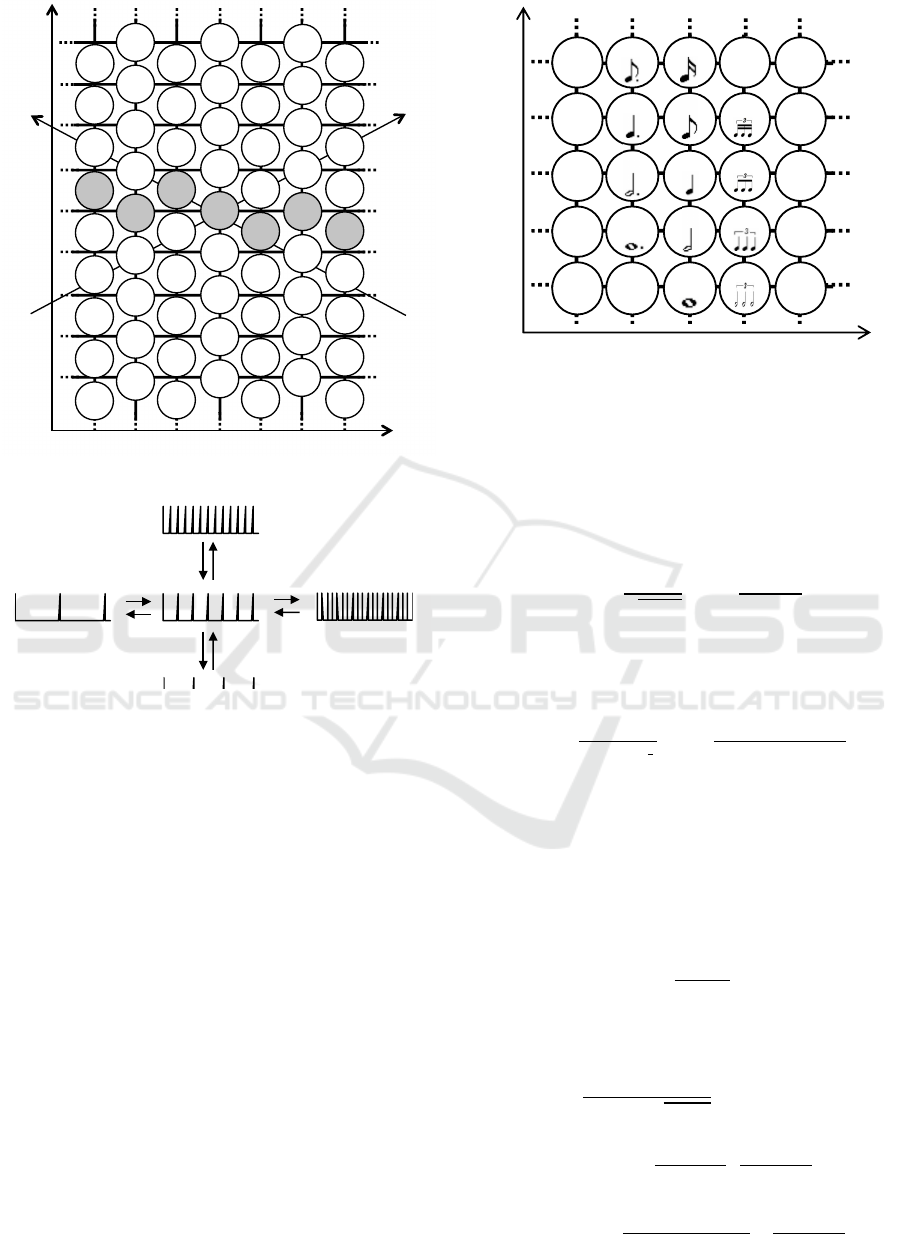
We provide the rhythm lattice space, which also
consists of the ratios of 1:2 and 1:3 (see Figure 5). The
unit in this lattice space is bpm (beats per minute).
In this figure, 72 bpm is the basic frequency of the
pulse. The x-axis indicates triple relationships, and
the y-axis shows the duple relationships. Each point
of intersection is the frequency of a pulse. In this fig-
ure, there are symbols of musical notes; a quarter note
is 72 bpm.
2.3 Outputting Note with GMM
In the system, there are probability density functions
in each space. The sound timing and pitches of an
! 3
! 2
96bpm 288bpm32bpm 864bpm 2592bpm
48bpm16bpm 432bpm 1296bpm144bpm
24bpm8bpm 216bpm 648bpm72bpm
12bpm 36bpm4bpm 108bpm 324bpm
6bpm 18bpm2bpm 54bpm 162pm
Figure 5: The lattice space for musical values with duple
and triple relationships.
output note depend on each function. The probability
density functions consist of one or two normal distri-
butions.
A normal distribution is expressed by the follow-
ing formula.
N(x) =
1
√
2πσ
2
exp
−
(x −µ)
2
2σ
2
µ is the mean and σ
2
is the variance.
The function is extended to two dimensions as fol-
lows.
N(x) =
1
(2π)
2
|Σ |
1
2
exp
−
(x −µ)
T
Σ(x − µ)
2
The details of each value are as follows.
x =
x
y
, µ =
µ
x
µ
y
,Σ =
σ
x
Cov
Cov σ
y
Cov means a covariance. ρ means a coefficient of
correlation between values on the x- and y-axis and is
calculated from Co v as follows.
ρ =
Cov
σ
x
·σ
y
Using σ
x
,σ
y
, µ
x
, µ
y
, ρ, the function of the 2-
dimension normal distribution is expressed as follows
N(x,y) =
1
2πσ
x
σ
y
p
1 −ρ
2
×exp
−
1
2(1 −ρ
2
)
(x −µ
x
)
2
σ
2
x
−2ρ
(x −µ
x
)(y − µ
y
)
σ
x
σ
y
+
(y − µ
y
)
2
σ
2
y
!
Development of Agents that Create Melodies based on Estimating Gaussian Functions in the Pitch Space of Consonance
365

B4
G!4
A4
E4
D!4G4
F4
C4
D4
E!4
B!4
G!6
G!5
D!5
E6
E5
B5
D5
Dg
C6
C5
G5
A5
B!6
B!5
F5
E!5
Figure 6: Miyako-bushi scale in the lattice space of pitches
(Gray notations are concerned pitches).
If the agent has a normal distribution in the pitch lat-
tice space, it can create musical modes. An agent
with a normal distribution can only create a simple
musical mode. If the agent needs to create a melody
with a complicated mode, it must have a more com-
plex distribution. For example, if agents create a
melody of the Miyoko-bushi scale, which is a tradi-
tional Japanese mode (see Figure 6), it must have two
normal distributions. For these reasons, the agent in
the system has two normal distributions in each space.
When more than one normal distribution is used,
there is a Gaussian mixture model (GMM), which is
expressed as follows.
N(x|µ,Σ,w) =
K
Õ
k=1
w
k
·N(x|µ
k
,Σ
k
) (1)
At this moment, there are two normal distribution
functions (K = 2). w
k
shows the weight of each func-
tion, and w
1
+ w
2
= 1. Each agent has these param-
eters for creating melodies. Users can adjust the pa-
rameters with sliders of the interface of the system.
Here, we explain the flow execution of the pro-
gram. When users push the play button, iterative pro-
cessing occurs as follows
1. Select a pitch from the rhythm lattice space ac-
cording to the probability density function.
2. Is the timing of the pulse hitting a note?
yes: Select a pitch from the pitch lattice space ac-
cording to the probability density function and
output it.
no: Do nothing
3. Go to 1 as the next step.
3 PROPOSED SYSTEM
In this study, we improve the existing system by
adding new features. The improved system analyzes
existing music and creates GMM in the pitch lattice
space, and it also accepts Standard MIDI Files (SMF)
as existing music. First, we explain SMF, and then we
elaborate on how to fit GMM.
3.1 Standard MIDI File
MIDI (Musical Instrument Digital Interface) is the
standard of how to connect and share the information
of the musical performance between electronic instru-
ments. Standard MIDI File (SMF) is a file format
of MIDI for saving musical data. This system ana-
lyzes the pitch data of SMF as data of existing music.
There are three formats of SMF; however, the system
accepts only format 1 depending on the implementa-
tion.
3.2 Fitting GMM
The system considers a Gaussian Mixture model
(GMM) consisting of two normal distributions. We
adopt the EM algorithm as an approximation function
of existing music. The Probability density function
consisting of two normal distribution is expressed by
formula 1. Therefore, the log-likelihood function is
as follows;
ln p(X|µ,Σ,w) = ln
N
Ö
n=1
K
Õ
k=1
w
k
·N
x
n
|µ
k
,Σ
k
!
=
N
Õ
n=1
ln
K
Õ
k=1
w
k
·N
x
n
|µ
k
,Σ
k
!
Let us define z
nk
as hidden values, which means
that data x
n
belongs to class k. The posterior prob-
ability γ(z
nk
) is calculated as follows using Bayes’
theorem.
γ(z
nk
) =
w
k
N(
x
n
|µ
k
,Σ
k
Í
K
i=1
w
i
N(
x
n
|µ
i
,Σ
i
(2)
The partial differentiation of each parameter pro-
vides us with the updated formulas as follows:
N
k
=
N
Õ
n=1
γ(z
nk
)
µ
new
k
=
1
N
k
N
Õ
n=1
γ(z
nk
)x
n
Σ
new
k
=
1
N
k
N
Õ
n=1
γ(z
nk
)(x
n
−µ
new
k
)(x
n
−µ
new
k
)
T
w
new
k
=
N k
N
(3)
Using two computation processes alternately, For-
mula 2 called the E-step and Formula 3 called the M-
step, the system can find optimum values of parame-
ters.
HAMT 2020 - Special Session on Human-centric Applications of Multi-agent Technologies
366

Figure 7: Sound Control Panel.
3.3 Implementation
We implemented the proposed agents as a system us-
ing HTML and JavaScript for creating music system
1
.
We used a web audio API as sounding notes. More-
over, we used tone.js
2
for analyzing SMF and tem-
pura.js
3
for executing the EM algorithm. We con-
firmed the operation of the system in Google Chrome.
An agent creates a melody line. The system out-
puts up to three melody lines because the system has
three agents. Users control parameters of the proba-
bility density functions for pitch and rhythm.
We prepared some preset data for examples which
provide musical modes, such as the Miyako-bushi
scale (Figure 6).
The system reads SMF by analyzing the existing
music and determines the pitch of each track. The sys-
tem calculates the optimal parameters of GMM from
the pitch data using the EM algorithm.
3.4 System Operating Instructions
The operational screen consists of three panels, the
sound control panel, the pitch control panel, and the
note-value control panel. Herein, we provide a step-
by-step explanation of their usage.
3.4.1 Sound Control Panel
At [Sound Control] (Figure 7), users can control
play/stop, volume, tempo, duration, waveform, and
melody lines of the output. The header of the oper-
ation screen also includes a play/stop button. Slid-
ers control the values of the volume, tempo, and du-
ration. The value of the tempo indicates the pro-
gram cycle time in bpm. The value of the duration
is the length of time of each note. By controlling
1
http://ohmura.sakura.ne.jp/program/pitchMaker/
pitchMaker010/
2
https://github.com/Tonejs/Midi
3
http://mil-tokyo.github.io/tempura/
Figure 8: Pitch control panel.
this value, melodies show articulations as staccato and
tenuto. With the waveform selector, users can select
from “Sin,” “Square,” “SawTooth,” and “Triangle.”
Users can select “Bongo” and “Piano” as actual sound
source samples. The [sound control] includes a pre-
set selector that provides each setting for the musical
mode. Using ‘choose file button’, the system can be
read arbitrary SMF. Moreover, the [sound control] in-
cludes a selector of preset SMF.
3.4.2 Pitch Control Panel
At [pitch control] (Figure 8), users can control the pa-
rameters of each probability density function for the
pitch of the melody lines using sliders. Each value of
the probability density function is shown in the upper
right [pitch cells]. The values of the melody lines are
shown in different colors. The first line is cyan, the
second line is magenta, and the third line is yellow.
A darker color indicates a higher value. Using but-
tons at the bottom of the [pitch cells], each probability
density function is set as visible or invisible. The op-
erations of the melody lines are independent. Using
the upper left buttons, the users select an operating
melody line. Sliders control the parameters of the pri-
mary function in the [Main-function Settings]. The
sliders control the parameters of the subfunction in
the [subfunction settings]. During system execution,
the selected pitches are shown at the bottom right [cir-
cle of fifth]. Therefore, users can confirm the output
pitch in real-time.
3.4.3 Note Value Control Panel
At [note value control] (Figure 9), users can control
the parameters of each probability density function
Development of Agents that Create Melodies based on Estimating Gaussian Functions in the Pitch Space of Consonance
367
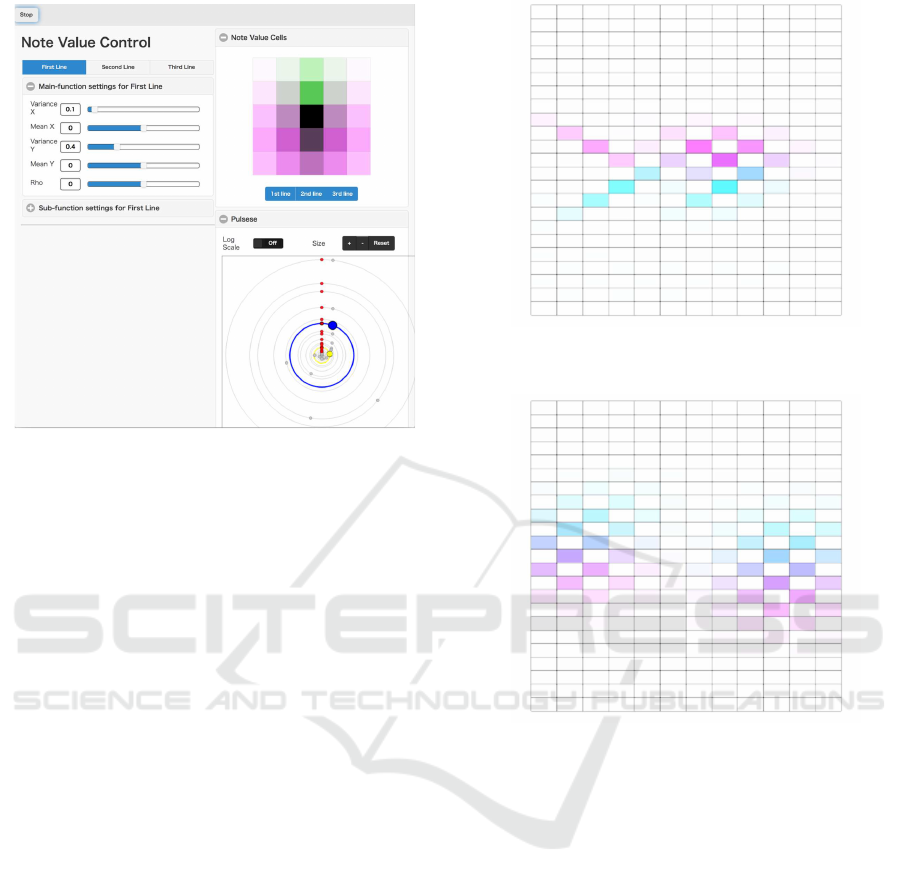
Figure 9: Note value control panel.
for the note values of the melody lines using slid-
ers. Each value of the probability density function
is shown in the upper right [note value cells]. As is
the case with [pitch control], the values of the melody
lines are shown in different colors. The first line is
cyan, the second line is magenta, and the third line is
yellow. A darker color indicates a higher value. Using
the buttons at the bottom in the [note value cells], each
probability density function is set as visible or invisi-
ble. The operations of the melody lines are indepen-
dent, as in the case of [pitch control]. During system
execution, the selected note values are shown at the
bottom right [pulses]. Therefore, users can confirm
the output pulses of the note values in real-time. The
pulses can be zoomed using buttons and displayed on
a log scale using a toggle button.
4 DISCUSSION
When the system reads some SMF, it creates a mu-
sical scale and mode of the existing SMF. For exam-
ple, using the SMF preset, Usagi (Japanese nursery
song), the system shows Figure 10 in ‘Pitch Cells’.
As seen from the figure, the system fits the Miyako-
bushi scale using two normal distribution functions.
However, there are some challenges with this system,
as discussed below.
For example, using the SMF preset, Debussy Pre-
lude, the system shows Figure 11 in ‘Pitch Cells’. As
seen from the figure, the areas of distribution are far
from each other. The reason is that this SMF is writ-
ten in G-flat major, which includes G[, A[, B[, B,
Figure 10: Distribution of Usagi (Japanese nursery song) in
the lattice space for pitch.
Figure 11: Distribution of Debussy 1-8 in the lattice space
for pitch.
D[, E[ and F, in contrast, the center of the pitch lat-
tice space is D. As a solution, the system analyzes the
modes and scales of the existing music, then the key
of the mode can be set in the center of the pitch lattice
space.
Another challenge is that the spread of the pitch
lattice space continues infinitely in Pythagorean tun-
ing, and yet the spread of the pitch lattice space loop
is over twelve notes. If the system targets a 12-equal
temperament, we may need to adopt the von Mises
distribution, which considers the direction, rather than
the normal distribution. We should consider and up-
date the system so that it treats various temperaments.
Furthermore, this system cannot express the dy-
namic variation of music because it reads music as
a whole and creates one probability density function.
For example, the probability density function of the
result of Beethoven’s Moonlight sonata 1 includes
various notes on the x-axis because the music trans-
poses various keys. As a solution, the system needs to
HAMT 2020 - Special Session on Human-centric Applications of Multi-agent Technologies
368

consider dynamic variations.
Additionally, the upgrade function is limited to the
pitch of the music. In the future, we will add a func-
tion for the music values and rhymes to the system.
When the system has this function, it will be able to
consider dynamic variations.
The lattice spaces based on frequency ratios we
have proposed are inspired by human musical cog-
nition, which differs from musical scores based on
creating music; therefore, the system cannot consider
macro structures but can create primitive structures.
The system might be able to treat not only rhythm and
musical value but also musical forms such as reprises
and developments.
5 CONCLUSIONS
We have focused on the frequency ratio between notes
based on pitch and sound timings and have developed
an agent that creates music using a web system. We
have proposed lattice spaces that express the ratios of
pitches and pulses. Agents create melodies based on
the GMM of the lattice spaces. In this study, we up-
graded the system to analyze existing music. There-
fore, the system can get the distribution of pitch in
the pitch lattice space and create melodies. We con-
firm that the system fits musical features, such as
modes and scales of the existing music like GMM.
It is suggested that the pitch lattice space and GMM
are suitable for expressing primitive musical struc-
tures of pitch. However, there are some challenges of
not adapting a 12-equal temperament and of dynamic
variation of the mode. We are going to approach these
problems in our future work.
ACKNOWLEDGEMENTS
This work was supported by JSPS KAKENHI Grant
Numbers JP17K12808, JP17K02347, JP16H01744
and JP19K00227.
REFERENCES
DeNora, T. (2000). Music in everyday life. Cambridge, UK:
Cambridge University Press.
Jordania, J. (2010). Music and emotions: humming in hu-
man prehistory. Proceedings of the International Sym-
posium on Traditional Polyphony (Tbilisi), pages 41–
49.
Lerdahl, F. and Jackendoff, R. (1983). A Generative Theory
of Tonal Music. MIT Press.
Meyer, L. B. (1956). Emotion and meaning in music. Uni-
versity of Chicago Press.
Ohmura, H., Shibayama, T., Hirata, K., and Tojo, S. (2018).
Music generation system based on a human instinctive
creativity. In Proceedings of Computer Simulation of
Musical Creativity (CSMC2018).
Ohmura, H., Shibayama, T., Hirata, K., and Tojo, S. (2019).
Development of agents for creating melodies and in-
vestigation of interaction between the agents. In
ICAART2019: Proceedings of the 11th International
Conference on Agents and Artificial Intelligence, vol-
ume 1: HAMT, pages 553–569.
Development of Agents that Create Melodies based on Estimating Gaussian Functions in the Pitch Space of Consonance
369
