
Two-stage Neural-network based Prognosis Models using
Pathological Image and Transcriptomic Data: An Application in
Hepatocellular Carcinoma Patient Survival Prediction
Zhucheng Zhan
1
, Noshad Hosseni
2
, Olivier Poirion
3
, Maria Westerhoff
4
, Eun-Young Choi
4
,
Travers Ching
5
and Lana X. Garmire
2,*
1
School of Science and Engineering, Chinese University of Hong Kong, Shenzhen Campus, Shenzhen, P.R. China
2
Department of Computational Medicine and Bioinformatics, University of Michigan, Ann Arbor, MI, U.S.A.
3
Department of Cellular and Molecular Medicine, UC-San Diego, La Jolla, CA, U.S.A.
4
Department of Pathology, University of Michigan, Ann Arbor, MI, U.S.A.
5
Adaptive Biotechnologies, Seattle, Washington, U.S.A.
*corresponding author
Keywords: Prognosis, Survival, Prediction, Neural Network, Modelling, Cox Proportional Hazards, Pathology, Image,
Gene Expression, Omics, RNA-Seq, Data Integration.
Abstract: Pathological images are easily accessible data type with potential as prognostic biomarkers. Here we extend
Cox-nnet, a neural network based prognosis method previously used for transcriptomics data, to predict
patient survival using hepatocellular carcinoma (HCC) pathological images. Cox-nnet based imaging
predictions are more robust and accurate than Cox proportional hazards model. Moreover, using a novel two-
stage Cox-nnet complex model, we are able to combine histopathology image and transcriptomics RNA-Seq
data to make impressively accurate prognosis predictions, with C-index close to 0.90 and log-ranked p-value
of 4e-21 in the testing dataset. This work provides a new, biologically relevant and relatively interpretable
solution to the challenge of integrating multi-modal and multiple types of data, particularly for survival
prediction.
1 INTRODUCTION
Previously, we developed a neural network model
called Cox-nnet to predict patient survival, using
transcriptomics data (T. Ching, et al., 2018). Cox-
nnet is an alternative to the conventional methods,
such as Cox proportional hazards (Cox-PH) methods
with LASSO or ridge penalization. We demonstrated
that Cox-nnet is more optimized for survival
prediction from high throughput gene expression
data, with comparable or better performance than
other conventional methods, including Cox-PH,
Random Survival Forests (H. Ishwaran and M. Lu,
2019) and CoxbBoost (R. D. Bin and R. De Bin,
2016). Moreover, Cox-nnet reveals much richer
biological information, at both the pathway and gene
levels, through analysing the survival related
“surrogate features” represented in the hidden layer
nodes in Cox-nnet.
One of the questions remaining unexplored, is
whether other data types that previously have been
shown prognostic values are also good input features
to be exploited by Cox-nnet. One of such data types
is pathological image data, eg. H&E staining data.
These images are much more easily accessible and
cheaper to obtain, compared to RNA-Seq
transcriptomics data.
Therefore in this study, we extend Cox-nnet to
take up pathological image features extracted from
imaging processing tool CellProfiler (C. McQuin, et
al., 2018), and compare the predictive performance of
Cox-nnet relative to Cox proportional hazards, the
second best method in the original study. Moreover,
we also propose a new kind of 2-stage complex Cox-
nnet model as the proof-of-concept. The 2-stage Cox-
nnet model combines the hidden node features from
the 1st-stage of Cox-nnet models in parallel, where
each Cox-nnet model is optimized to fit either image
or RNA-Seq based data, and then use these combined
features as the input nodes to train a 2nd-stage Cox-
nnet model. We applied the models on TCGA
hepatocellular carcinoma (HCC), which we had
296
Zhan, Z., Hosseni, N., Poirion, O., Westerhoff, M., Choi, E., Ching, T. and Garmire, L.
Two-stage Neural-network based Prognosis Models using Pathological Image and Transcriptomic Data: An Application in Hepatocellular Carcinoma Patient Survival Prediction.
DOI: 10.5220/0009381002960301
In Proceedings of the 13th International Joint Conference on Biomedical Engineering Systems and Technologies (BIOSTEC 2020) - Volume 3: BIOINFORMATICS, pages 296-301
ISBN: 978-989-758-398-8; ISSN: 2184-4305
Copyright
c
2022 by SCITEPRESS – Science and Technology Publications, Lda. All rights reserved

previously processed data and accumulated
experience (K. Chaudhary et al., 2018; K. Chaudhary
et al., n.d.). In summary, our work here not only
extends the previous Cox-nnet model to process
pathological imaging data, but also creatively
addresses the multi-modal data integration challenges
for patient survival prediction.
2 METHODS
2.1 Datasets
The histopathology images and their associated
clinical information are downloaded from The Cancer
Genome Atlas (TCGA). A total of 384 liver tumor
images are collected. Among them 322 samples are
clearly identified with tumor regions by pathology
inspection. Among these samples, 290 have gene
expression RNA-Seq data, and thus are selected for
pathology-gene expression integrated prognosis
prediction. The gene expression RNA-Seq dataset is
also downloaded from TCGA, each feature was then
normalized into RPKM using the function
ProcessRNASeqData by TCGA-Assembler.
2.2 Tumor Image Processing
For each image, the tumor regions are labelled by
pathologists at University of Michigan. The tumor
regions are then extracted using Aperio software
ImageScope (C. Marinaccio and D. Ribatti, 2015). To
reduce computational complexities, each extracted
tumor region is divided into non-overlapping 1000 by
1000 pixel tiles. The density of each tile is computed
as the summation of red, green and blue values, and
10 tiles with the highest density are selected for
further feature extraction similar to others (K.-H. Yu,
2016). To ensure that the quantitative features are
measured under the same scale, the red, green and
blue value are rescaled for each images. Image #128
with the standard background color (patient barcode:
TCGA-DD-A73D) is selected as the reference image
for the others to be compared with. The means of red,
green and blue values of the reference image are
computed and the rest of the images are normalized
by the scaling factors of the its means of red, green,
blue values relative to those of the reference image.
2.3 Feature Extraction from Image Set
CellProfiler is used for feature extraction
(Kamentsky, L. et al., 2011). Images are first
preprocessed by 'UnmixColors' module to H&E
stains for further analysis. 'IdentifyPrimaryObject'
module is used to detect unrelated tissue folds and
then removed by 'MaskImage' module to increase the
accuracy for detection of tumour cells. Nuclei of
tumour cells are then identified by
'IdentifyPrimaryObject' module again with para-
meters set by Otsu algorithm. The identified nuclei
objects are utilised by 'IdentifySecondaryObject'
module to detect the cell body objects and cytoplasm
objects which surround the nuclei. Related biological
features are computed from the detected objects, by a
series of feature extraction modules, including
'MeasureGranularity', 'MeasureObjectSizeShape',
'MeasureObjectIntensity',
'MeasureObjectIntensityDistribution',
'MeasureTexture', 'MeaureImageAreaOccupied',
'MeasureCorrelation', 'MeasureImageIntensity' and
'MeasureObjectNeighbors'. To aggregate the features
from the primary and secondary objects, the related
summary statistics (mean, median, standard deviation
and quartiles) are then calculated to summarize data
from object level to image level, yielding 2429
features in total. Each patient is represented by 10
images, and the median of each feature is selected to
represent the patient's image biological feature.
2.4 Survival Prediction Models
Cox-nnet: The Cox-nnet model is implemented in the
Python package named Cox-nnet (T. Ching, et al.,
2018). Current implementation of Cox-nnet is a fully
connected, two-layer neural network model, with a
hidden layer and an output layer for cox regression.
The drop-out method is used to avoid overfitting. We
used hold-out method by randomly splitting the
dataset to 80% training set and 20% testing set. We
used grid search and 5-fold cross-validation to
optimise the hyper-parameters for the deep learning
model on the selected training set. The model is then
trained under the optimised hyperparameter setting
using the training set and further evaluated on the
remaining testing set, the procedure is repeated 5
times to assess the average performance. More details
about Cox-nnet is described earlier in Ching et al (T.
Ching, et al., 2018).
Cox Proportional Hazards Model: Since the
number of features produced by CellProfiler exceed
the sample size, an elastic net Cox proportional
hazard model is built to select features and compute
the prognosis index (PI) (S. Huang, et al., 2014).
Function cv.glmnet in the Glmnet R package is used
to performs cross-validation to select the tuning
Two-stage Neural-network based Prognosis Models using Pathological Image and Transcriptomic Data: An Application in Hepatocellular
Carcinoma Patient Survival Prediction
297
parameter lambda. The parameter alpha that
controls the trade-off between quadratic penalty and
linear penalty is selected using grid search. Same
hold-out setting is employed by training the model
using 80% randomly selected data and evaluated on
the remaining 20% testing set. The procedure is
repeated 5 times to calculate the mean accuracy of
the model.
2.5 Model Evaluation
Similar to the previous studies (T. Ching, et al., 2018;
K. Chaudhary, et al., 2018; K. Chaudhary, et al., n.d.),
we also use concordant index (C-index) and log-
ranked p-value as the metrics to evaluate model
accuracy. C-index signifies the fraction of all pairs of
individuals whose predicted survival times are
correctly ordered and is based on Harrell C statistics.
Conventionally, a C-index around 0.70 indicates a
good model, whereas a score around 0.50 means
randomness. As both Cox-nnet and Cox-PH model
quantify the patient's prognosis by log hazard ratios,
we use the predicted median hazard ratios to stratify
patients into two risk groups (high vs. low survival
risk groups). We also compute the log-rank p-value to
test if two Kaplan-Meier survival curves produced by
the dichotomised patients are significantly different.
2.6 Feature Evaluation
The input feature importance score is calculated by
drop-out. The values of a variable are set to its mean
and the log likelihood of the model is recalculated.
The difference between the original log likelihood
and the new log likelihood is considered as feature
importance (Bengio Y, et al., 2013). We select 100
features with the highest feature scores from Cox-
nnet for association analysis between pathology
image and gene expression features. We regress each
selected image feature (y) over all the gene expres-
sion features (x) using LASSO penalization, and then
use the R-square statistic as the correlation metric.
2.7 Data Integration
We construct 1st-stage Cox-nnet models using the
image data and gene expression data of HCC,
respectively. For each model, grid search is used on the
training set to optimize the hyper-parameters under 5-
fold cross-validation. Then we extract and combine the
nodes of the hidden layer from each Cox-nnet model
as the new input features for the 2nd-stage model. This
new Cox-nnet model is constructed and evaluated with
the same parameter-optimization strategies.
3 RESULTS
3.1 Overview of Cox-nnet Model on
Pathological Image Data
In this study, we tested if pathological images can be
used to predict cancer patient survival. As described
in the Methods, pathological images of 322 TCGA
HCC patients are individually annotated with tumor
contents by pathologists, before being subject a series
of processing steps. The tumor regions of these
images then undergo segmentation, and the top 10
tiles (as described in section 2.2) out of 1000 by 1000
tiles are used to represent each patient. These tiles are
next normalized for RGB coloring against a common
reference sample, and 2429 image features of
different categories are extracted by CellProfiler.
Summary statistics (mean, median, standard
deviation and quartiles) are calculated for each image
features, and the median values of them over 10 tiles
are used as the input imaging features for survival
prediction.
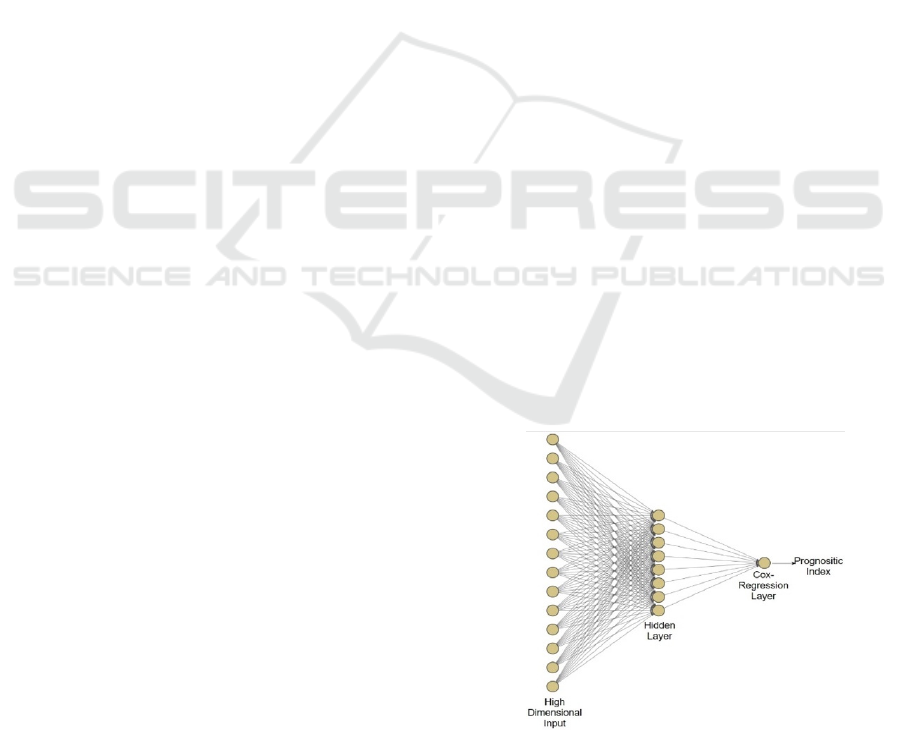
We applied these imaging features on Cox-nnet, a
neuron-network based prognosis prediction method
previously developed by our group. The architecture
of Cox-nnet is shown in Figure 1. Briefly, Cox-nnet
is composed of the input layer, one fully connected
hidden layer and an output “proportional hazards”
layer. We use 5-fold cross-validation (CV) to find the
optimal regularization parameters. Based on the
results on RNA-Seq transcriptomics previously, we
use dropout as the regularization method.
Additionally, to evaluate the results on pathology
image data, we compare Cox-nnet with Cox-PH
model, the previously 2nd-best prognosis model on
RNA-Seq data.
Figure 1: The architectures of Cox-nnet model: The sketch
of Cox-nnet model for prognosis prediction, based on a
single data type.
C2C 2020 - Workshop on COMP2CLINIC: Biomedical Researchers Clinicians Closing The Gap Between Translational Research And
Healthcare Practice
298
3.2 Comparison of Prognosis
Prediction between Cox-nnet and
Cox-PH over Pathology Imaging
Data
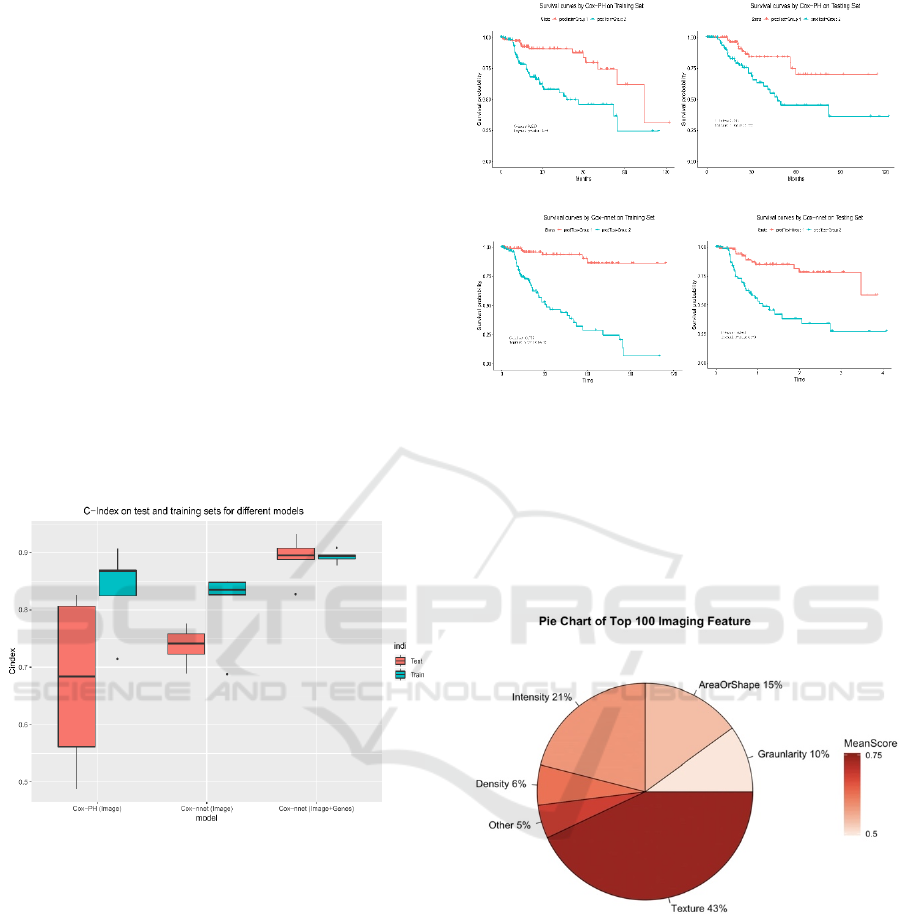
We use two accuracy metrics to evaluate the
performance of models in comparison: C-index and
log-rank P-values. C-index measures the fraction of all
pairs of individuals whose predicted survival times are
correctly ordered by the model. The higher C-index,
the more accurate the prognosis model is. On the other
hand, log-rank p-value tests if the two Kaplan-Meier
survival curves based on the survival risk-stratification
are significantly different (log-rank p-value <0.05). In
this study, we stratify the patients by the median score
of predicted prognosis index (PI) from the model. As
shown in Figure 2, the C-index values from the Cox-
PH model are much more variable (less stable),
compared to those from Cox-nnet. Moreover, the
median C-index score from Cox-nnet is higher (around
0.75) than Cox-PH (less than 0.70).
Figure 2: Comparison of prognosis prediction with different
models and data types.
Additionally, the discrimination power of Cox-nnet
on patient Kaplan-Meier survival difference (Figure
3 C and D) is much better than Cox-PH model
(Figure 3 A and B), using median PI based survival
risk stratification. In the training dataset, Cox-nnet
achieves a log-rank P-value of 1e-13, compared to 3e-
5 for Cox-PH; in the testing dataset, Cox-nnet
achieves a log-rank P-value of 1e-6, whereas Cox-PH
gives a result of 0.01.
We next investigated the top 100 image features
according to Cox-nnet ranking (Figure 4).
Interestingly, the most frequent features are those
involved in textures of the image, accounting for 43%
of raw input features. Intensity and Area/Shape
parameters make up the 2nd and 3rd highest categories,
Figure 3: Comparison of Kaplan-Meier survival curves
resulting from Cox-PH and Cox-nnet models, based on
pathological images.
with 21% and 15% features. Density, on the other
hand, is less important (6%). It is also worthy to note
that among 49 selected features from the
conventional Cox-PH model, 63% (31) are also
found in the top 100 features found by Cox-nnet.
Figure 4: Categories of the top 100 most important image
features in Cox-nnet.
3.3 Prognosis Prediction by Combining
Histopathology Imaging and Gene
Expression RNA-Seq Data
Multi-modal and multi-type data integration is
challenging, particularly so for survival prediction.
We next ask if we can utilize Cox-nnet workframe
for such purpose, exemplified by pathology imaging
and gene expression RNA-Seq based survival
prediction.
A
C
D
B
Two-stage Neural-network based Prognosis Models using Pathological Image and Transcriptomic Data: An Application in Hepatocellular
Carcinoma Patient Survival Prediction
299
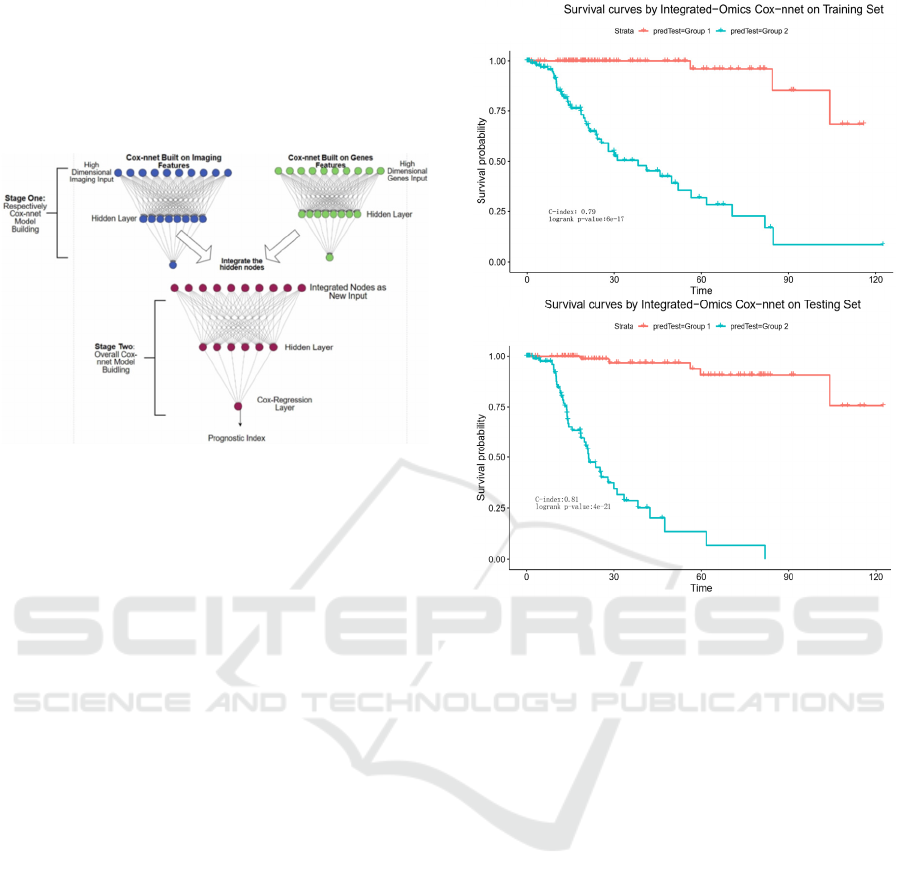
Towards this, we propose a two-stage Cox-nnet
complex model, inspired by other two-stage models
in genomics fields (T. Schulz-Streeck, et al., 2013;
R. Wei, et al., 2016; F. R. Pinu, et al., 2019). The
two-stage Cox-nnet model is depicted in Figure 5
below.
Figure 5: The architectures of 2-stage Cox-nnet complex
model for prognosis prediction, which integrates multiple
data types (eg. pathology image and gene expression).
For the first stage, we construct two Cox-nnet
models in parallel, using the image data and gene
expression data of HCC, respectively. For each
model, we optimize the hyper-parameters using grid
search under 5-fold cross-validation. Then we
extract and combine the nodes of the hidden layer
from each Cox-nnet model as the new input features
for the second-stage Cox-nnet model. We construct
and evaluate the second-stage Cox-nnet model with
the same parameter-optimisation strategy as in the
first-stage.
As shown in Figure 6, the resulting two-stage
Cox-nnet model yields impressive performance,
judged by the C-index values on both training set and
testing set, both of which are close to 0.90. In fact,
from our experience over the years, none of the
prognosis models based on one omic data type had
yielded a predictive C-index score nearly as high.
This outstanding performance of the two-stage Cox-
nnet model is also confirmed by the log-rank P-values
in the Kaplan-Meier survival curves (Figure 6). In the
training dataset, Cox-nnet achieves a log-rank P-
value of 6e-17; in the testing dataset, Cox-nnet has an
even higher log-rank P-value of 4e-21. The fact that
the testing dataset obtains a better log-rank p-value
than the training dataset, indicates that the over-fitting
is less of a concern. Note: the C-index values in
Figure 6 are different from those in Figure 2, since
the objective in these plots is to differentiate the
stratified risk groups post the cox-nnet model, rather
than fitting the survival data directly.
Figure 6: Kaplan-Meier survival curves resulting from the
2-stage Cox-nnet model, combining pathological images
and gene expression RNA-Seq data from same HCC
patients. A. training set. B. testing set.
We also investigate the correlations between the
top imaging features with those RNA-Seq gene
expression features. For this we regress each selected
image feature (y) over all the gene expression features
(x) using LASSO penalization. Interestingly, among
the top 20 imaging features, none but one feature
(StDev_Nuclei_AreaShape_MajorAxisLength) has a
decent correlation value (R-square=0.30) with gene
expression features. This result shows that imaging
features extracted using CellProfiler have mostly
orthogonal (or non-overlapping) predictive
information to the RNA-Seq gene expression
features. This also supports the observed significant
increase in C-index (Figure 2) and log-ranked p-
values (Figure 6), after adding RNA-Seq features to
imaging features.
4 CONCLUSIONS
Driven by the objective to build a uniform workframe
to integrate multi-modal and multi-type data to
predict patient survival, we extend Cox-nnet model, a
A
B
C2C 2020 - Workshop on COMP2CLINIC: Biomedical Researchers Clinicians Closing The Gap Between Translational Research And
Healthcare Practice
300

neural-network based survival prediction method, on
pathology imaging data and beyond. Using TCGA
HCC pathology images as the example, we
demonstrate that Cox-nnet is more robust and
accurate at predicting testing dataset, relative to Cox-
PH, the standard method for survival prediction
(which was also the second-best method in the
original RNA-Seq transcriptomic study (T. Ching, et
al., 2018)). Moreover, we propose a new two-stage
complex Cox-nnet model to integrate imaging and
RNA-Seq transcriptomic data, and show case its
outstanding predictive accuracy on testing dataset (C-
index almost as high as 0.90). The two-stage Cox-
nnet model combines the transformed, hidden node
features from the first-stage of Cox-nnet models for
imaging or RNA-Seq based data respectively and use
these combined features as the inputs to train a
second-stage Cox-nnet model.
Rather than using convolutional neural network
(CNN) models that are more complex, we utilized a
less complex but perhaps more biologically relevant
approach, where we extract imaging features using
the tool CellProfiler. These features are then fed in a
relatively simple, two-layer neural network model,
and still achieve credible predictive performance.
Such success argues that in biological domain, it is
possible to use relatively simple neural network
models with have prior biological relevance (such as
in the input features). In summary, our work here not
only extends the previous Cox-nnet model to process
pathological imaging data, but also creatively
addresses the multi-modal data integration challenges
for patient survival prediction.
ACKNOWLEDGEMENTS
LXG would like to thank the support by grants
K01ES025434 awarded by NIEHS through funds
provided by the trans-NIH Big Data to Knowledge
(BD2K) initiative (www.bd2k.nih.gov), R01
LM012373 and LM awarded by NLM, R01
HD084633 awarded by NICHD to L.X. Garmire.
REFERENCES
T. Ching, X. Zhu, and L. X. Garmire, “Cox-nnet: An
artificial neural network method for prognosis
prediction of high-throughput omics data,” PLoS
Comput. Biol., vol. 14, no. 4, p. e1006076, Apr. 2018.
H. Ishwaran and M. Lu, “Random Survival Forests,” Wiley
StatsRef: Statistics Reference Online. pp. 1–13, 2019.
R. D. Bin and R. De Bin, “Boosting in Cox regression: a
comparison between the likelihood-based and the
model-based approaches with focus on the R-packages
CoxBoost and mboost,” Computational Statistics, vol.
31, no. 2. pp. 513–531, 2016.
C. McQuin, A. Goodman, V. Chernyshev, L. Kamentsky,
B. A. Cimini, K. W. Karhohs, M. Doan, L. Ding, S. M.
Rafelski, D. Thirstrup, W. Wiegraebe, S. Singh, T.
Becker, J. C. Caicedo, and A. E. Carpenter,
“CellProfiler 3.0: Next-generation image processing for
biology,” PLoS Biol., vol. 16, no. 7, p. e2005970, Jul.
2018.
K. Chaudhary, O. B. Poirion, L. Lu, and L. X. Garmire,
“Deep Learning-Based Multi-Omics Integration
Robustly Predicts Survival in Liver Cancer,” Clin.
Cancer Res., vol. 24, no. 6, pp. 1248–1259, Mar. 2018.
K. Chaudhary, O. B. Poirion, L. Lu, S. Huang, T. Ching,
and L. X. Garmire, “Multi-modal meta-analysis of 1494
hepatocellular carcinoma samples reveals vast impacts
of consensus driver genes on phenotypes.” .
C. Marinaccio and D. Ribatti, “A simple method of image
analysis to estimate CAM vascularization by APERIO
ImageScope software,” Int. J. Dev. Biol., vol. 59, no. 4–
6, pp. 217–219, 2015.
K.-H. Yu, C. Zhang, G. J. Berry, R. B. Altman, C. Ré, D.
L. Rubin, and M. Snyder, “Predicting non-small cell
lung cancer prognosis by fully automated microscopic
pathology image features,” Nat. Commun., vol. 7, p.
12474, Aug. 2016.
S. Huang, C. Yee, T. Ching, H. Yu, and L. X. Garmire, “A
novel model to combine clinical and pathway-based
transcriptomic information for the prognosis prediction
of breast cancer,” PLoS Comput. Biol., vol. 10, no. 9, p.
e1003851, Sep. 2014.
T. Schulz-Streeck, J. O. Ogutu, and H.-P. Piepho,
“Comparisons of single-stage and two-stage
approaches to genomic selection,” Theor. Appl. Genet.,
vol. 126, no. 1, pp. 69–82, Jan. 2013.
R. Wei, I. De Vivo, S. Huang, X. Zhu, H. Risch, J. H.
Moore, H. Yu, and L. X. Garmire, “Meta-dimensional
data integration identifies critical pathways for
susceptibility, tumorigenesis and progression of
endometrial cancer,” Oncotarget, vol. 7, no. 34, pp.
55249–55263, Aug. 2016.
F. R. Pinu, D. J. Beale, A. M. Paten, et al., “Systems
Biology and Multi-Omics Integration: Viewpoints from
the Metabolomics Research Community,”.
Metabolites. 2019;9(4):76. Published 2019 Apr 18.
Y. Bengio, N. Boulanger-Lewandowski, R. Pascanu,
editors. “Advances in optimizing recurrent networks,”
Acoustics, Speech and Signal Processing (ICASSP),
2013 IEEE International Conference on; 2013: IEEE.
L. Kamentsky, et al. Improved structure, function and
compatibility for CellProfiler: modular high-
throughput image analysis software. Bioinformatics 27,
1179–1180 (2011).
Two-stage Neural-network based Prognosis Models using Pathological Image and Transcriptomic Data: An Application in Hepatocellular
Carcinoma Patient Survival Prediction
301
