
On Some Possibilities of using Microwave Radiometry in the Analysis
of Fluctuation Processes in Brain Tissue
Vladimir S. Kublanov, Mikhail V. Babich and Anton Yu. Dolganov
Ural Federal University, Yekaterinburg, Russian Federation
Keywords: Microwave Radiation, Heart Rate Variability, Neuro-electrostimulation, Brain Tissue.
Abstract: The article presents pilot study of the fluctuation processes in the brain tissues. Experimental setup consists
of the simultaneous record of microwave radiation in frequency range (3.4-4.2) GHz and heart rate variability
signals. As the functional load the neuro-electrostimulation was used. The preliminary results have shown
that the changes of the fluctuation process in brain tissues during the neuro-electrostimulation depends on the
changes in the autonomic nervous system, as evaluated by heart rate variability analysis.
1 INTRODUCTION
Currently, all existing scientific ideas about the
structure and principles of the human brain can be
represented as follows (Nicholls, Martin, Wallace, &
Fuchs, 2001).
The brain is a multilevel multifunctional central
nervous system designed to receive, transmit, process
and store information coming from organs, systems
and the environment.
The main informational structural and functional
units of the central nervous system are nerve cells
(neurons) of the brain, which by connecting together
using a large number of synapses form neuronal
networks.
Morphofunctional systems of the brain based on
neural networks provide functional cortical
neurodynamic integration of various regions and brain
formations of the brain (hemispheres, lobes,
convolutions, etc.), which is manifested at the level of
the whole brain by general bioelectric activity,
oscillatory processes and magnetoencephalographic
manifestations of the brain. Neurodynamic integration
forms the neural network cognitive functions of the
cerebral cortex.
As you gain new knowledge about the brain,
paradoxical contradictions about its work appear. So in
the works of A.S. Bryukhovetsky (Bryukhovetskiy,
2015) claims that the existing dogma that neural
networks process information in the brain is erroneous.
It has been hypothesized that the main structural
element of information switching in the nervous tissue
of the human brain is not a neuron, but information-
commutative modules that form the vertical
architecture of the nervous tissue of the human brain in
the form of information lines and information
channels, as well as a horizontal architecture in the
form central, intermediate and peripheral information
commutative. The information medium in the human
brain may be the pia mater, and the system
administrator and software carrier may be the
arachnoid. The dimensions of the information field still
require definition and refinement. Perhaps it is limited
only by subarachnoid or subdural space.
Therefore, the study of the proposed phenomenon,
primarily in the experiment by attracting new
information-measuring methods, is undoubtedly
relevant.
In this paper, we consider some of the possibilities
of microwave radiothermography to solve this
problem.
2 MATERIALS AND METHODS
Pilot studies of electromagnetic radiation in brain
structures have been carried out, in which signals can
be formed in accordance with the hypothesis of
A.S. Bryukhovetsky. Five relatively healthy volunteer
subjects took part in the studies. Before the experiment,
each participant was informed about the progress of the
experiment and agreed to participate in the experiment.
During the study, microwave radiation (MR) and heart
rate variability (HRV) signals were recorded.
Kublanov, V., Babich, M. and Dolganov, A.
On Some Possibilities of using Microwave Radiometry in the Analysis of Fluctuation Processes in Brain Tissue.
DOI: 10.5220/0009377204170420
In Proceedings of the 13th International Joint Conference on Biomedical Engineering Systems and Technologies (BIOSTEC 2020) - Volume 1: BIODEVICES, pages 417-420
ISBN: 978-989-758-398-8; ISSN: 2184-4305
Copyright
c
2022 by SCITEPRESS – Science and Technology Publications, Lda. All rights reserved
417
2.1 Experimental Setup
MR signals were recorded using an experimental MR8
radiometer. Radiometer Specifications:
operating frequency range (3.4-4.2) GHz;
passband of the low-pass filter 1 Hz;
normalized fluctuation sensitivity of the radiometer
0.1 K.
The operating frequency range was chosen in order
to be able to obtain information about the brightness
temperature in the area of the soft and arachnoid
meninges.
A radiometer with an antenna was located on the
subject’s head. The antenna was located in the area of
the frontal lobe. The location corresponded to the F4
electrode in the international 10–20 EEG electrode
placement system.
To provide protection against interference, the
antenna was shielded with a metallic fabric. The
experiments were carried out with the lights off. There
were no mobile phones in the experiment room.
HRV signals were recorded using the
corresponding recording channel of the Eencephalan-
131-03 electroencephalograph-analyzer.
For neuro-electrostimulation, we used a device
approved for use in Russia - the sympathetic nervous
system activity corrector “SYMPATHOCOR-
01”(Kublanov, 2008). One of the clinical effects of this
device is to improve blood circulation in the vessels of
the brain.
2.2 Timeline of the Experiment
The experiment consisted of five successive steps.
At the first stage (F), the participants sat calmly at
rest without any functional load. The duration of the
stage was 20 minutes.
At the second stage (S1), the participants were
exposed to the “SYMPATHOCOR-01” device. The
target of stimulation is the ganglia of the sympathetic
nervous system. The duration of the stage was 5
minutes.
The third step (B) is a five-minute break, without
any functional load.
At the fourth stage (S2), the participants were
exposed to “SYMPATHOCOR-01” device. The target
of stimulation is the ganglia of the sympathetic nervous
system. The duration of the stage was 5 minutes.
The fifth stage (A) is the aftereffect. The duration
of the stage was 10 minutes.
It is worth noting that neuro-electrostimulation
causes interference on the ECG signal. Therefore, in
the future, HRV signals in steps S1 and S2 were not
analyzed.
2.3 Methods of Processing
Continuous wavelet analysis was chosen as the main
processing method. The processing of biosignals was
carried out in in-house software written in python. The
main libraries used were the NumPy library for general
mathematical transformations and the PyWT library
for numerical computation of the continuous wavelet
transform.
An eighth-order Gaussian wavelet was used as the
basic wavelet. (Addison, 2005). For the HRV signal,
the signal was preliminarily interpolated to a uniform
time grid. Interpolation was carried out using the linear
interpolation method. The grid pitch was 0.25 s.
For each biosignal, a wavelet analysis was
performed in certain time-frequency windows. The
following center frequencies of the spectral filters
(0.03, 0.02, 0.01, 0.006, 0.005) Hz were selected for
the MR signal. These frequencies correspond to
fluctuations with periods of 30 s, 50 s, 100 s, 150 s, 200
s, respectively.
For the HRV signal, spectral analysis was
performed in the ranges HF, LF, and VLF (Malik,
1996). In addition, two VLF subbands with central
frequencies of 0.01 and 0.02 Hz, which are associated
with a change in cognitive loads, were analyzed.
(Togo, Kiyono, Struzik, & Yamamoto, 2006).
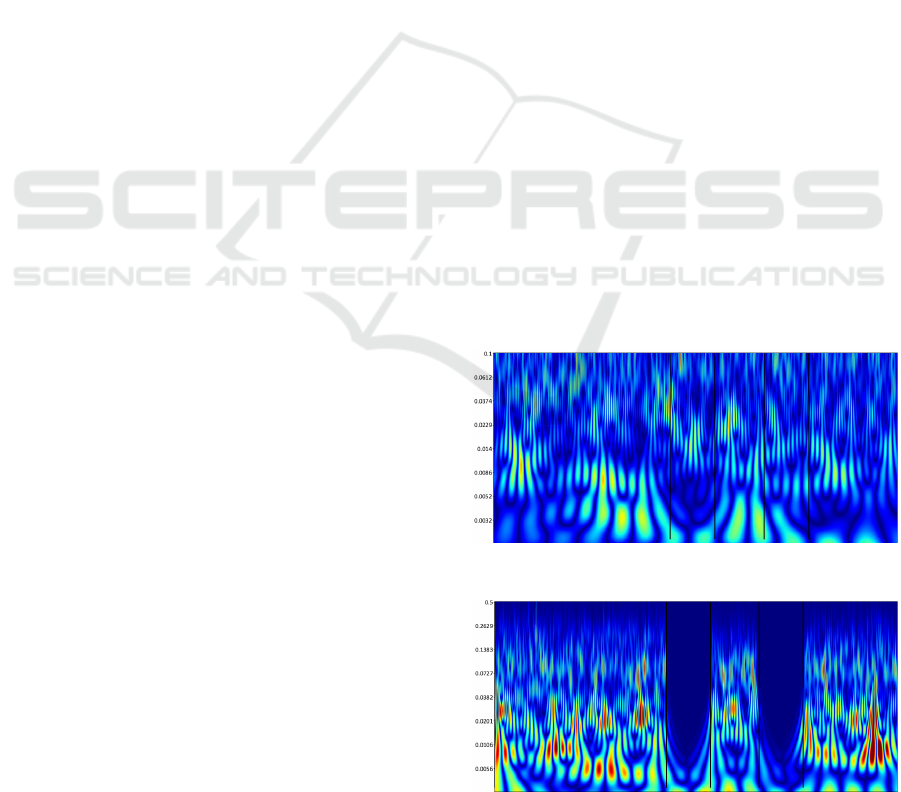
As a result of using the wavelet transform, wavelet
spectrograms were obtained. An example of the
obtained spectrograms for the MR signal and the HRV
signal for one of the subjects is presented in Figures 1
and 2, respectively. Vertical black lines indicate the
boundaries of the stages of the experiment.
Figure 1: Wavelet-spectrogram of the MR signal.
Figure 2: Wavelet-spectrogram of the HRV signal.
NDNSNT 2020 - Special Session on Non-invasive Diagnosis and Neuro-stimulation in Neurorehabilitation Tasks
418
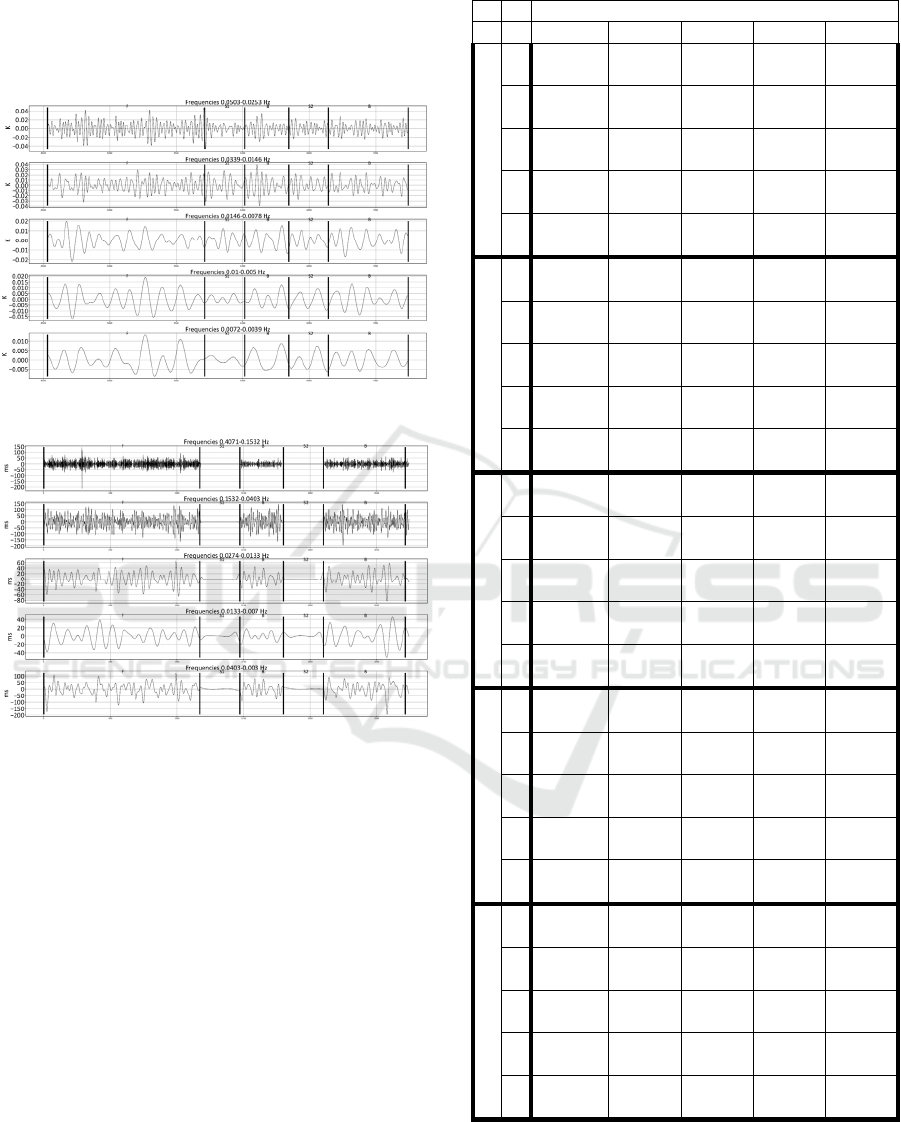
After obtaining wavelet spectrograms, the inverse
wavelet transform was carried out in the frequency
ranges of interest. Examples of signals after the inverse
wavelet transform are shown in Figures 3 and 4,
respectively.
Figure 3: Inverse Wavelet-transform of the MR signal.
Figure 4: Inverse Wavelet-transform of the HRV signal.
3 RESULTS
To assess changes in the nature of fluctuations, a
window estimate of the amplitude of the received
signals was performed. For this, the standard deviation
of the signals obtained as a result of applying the
inverse wavelet transform was estimated. The width of
the window in which the standard deviation was
estimated was 60 seconds. At the same time, the
window step was 30 seconds.
Tables 1 and 2 show the average values of the
fluctuation amplitude estimates for the MR and HRV
signals, respectively. In tables 1 and 2, column T
denotes frequency windows (and their corresponding
fluctuation periods).
In tables 1 and 2, bold marked significant changes
in the amplitude of the fluctuations.
It should be noted that for different subjects’ dif-
Table 1: MR Spectral Powers (K).
Stage of the Experiment
T F S1 B S2 A
Subject1
30
0.0068 ±
0.0022
0.0079 ±
0.0013
0.0097 ±
0.0047
0.0052 ±
0.0014
0.0063 ±
0.0015
50
0.006 ±
0.0014
0.0072 ±
0.0012
0.0072 ±
0.0027
0.0047 ±
0.0007
0.0062 ±
0.0019
100
0.003 ±
0.0011
0.0029 ±
0.0006
0.0022 ±
0.0006
0.0024 ±
0.0013
0.0025 ±
0.0008
150
0.0021 ±
0.0009
0.0031 ±
0.0008
0.0015 ±
0.0005
0.003 ±
0.0004
0.0021 ±
0.001
200
0.0013 ±
0.0006
0.0016 ±
0.0006
0.002 ±
0.0006
0.0017 ±
0.0003
0.0017 ±
0.0007
Subject2
30
0.0068 ±
0.0027
0.0055 ±
0.0009
0.0078 ±
0.0024
0.0070±
0.0015
0.0075 ±
0.0019
50
0.0064 ±
0.0017
0.0048 ±
0.0014
0.0052 ±
0.0032
0.0056 ±
0.0019
0.0062 ±
0.0012
100
0.0032 ±
0.0013
0.0031 ±
0.0011
0.0018 ±
0.0006
0.0027 ±
0.0024
0.0032 ±
0.0017
150
0.0027 ±
0.0011
0.0025 ±
0.0013
0.0019 ±
0.0009
0.0028 ±
0.0017
0.0029 ±
0.0015
200
0.0018 ±
0.0007
0.0021 ±
0.0009
0.0014 ±
0.0009
0.0018 ±
0.0006
0.0020 ±
0.0009
Subject3
30
0.0074 ±
0.0022
0.0049 ±
0.0011
0.0067 ±
0.0013
0.0083 ±
0.0027
0.0059 ±
0.0019
50
0.0065 ±
0.0021
0.0046 ±
0.0008
0.0075 ±
0.0017
0.0057 ±
0.002
0.0059 ±
0.0022
100
0.0034 ±
0.0013
0.0031 ±
0.0009
0.0029 ±
0.0015
0.0018 ±
0.0008
0.0024 ±
0.0007
150
0.0025 ±
0.0019
0.0023 ±
0.0005
0.0018 ±
0.0005
0.0013 ±
0.0007
0.0013 ±
0.0003
200
0.0017 ±
0.0012
0.0018 ±
0.0011
0.0017 ±
0.0009
0.0015 ±
0.0005
0.0009 ±
0.0004
Subject4
30
0.0074 ±
0.0024
0.0054 ±
0.0033
0.0059 ±
0.0019
0.0053 ±
0.001
0.0054 ±
0.0012
50
0.0054 ±
0.0018
0.0063 ±
0.0021
0.0071 ±
0.0025
0.0050 ±
0.0013
0.0053 ±
0.0014
100
0.003 ±
0.0015
0.0027 ±
0.0009
0.0033 ±
0.001
0.0026 ±
0.0007
0.0031 ±
0.0011
150
0.0031 ±
0.0014
0.0011 ±
0.0003
0.0026 ±
0.0009
0.0024 ±
0.0004
0.0028 ±
0.001
200
0.0019 ±
0.001
0.0006 ±
0.0003
0.0018 ±
0.0007
0.0016 ±
0.0005
0.0014 ±
0.0004
Subject5
30
0.0083 ±
0.0023
0.0082 ±
0.0024
0.0068 ±
0.0016
0.0071 ±
0.0021
0.0062 ±
0.0014
50
0.0062 ±
0.0015
0.0058 ±
0.0014
0.0059 ±
0.0012
0.0046 ±
0.0013
0.0075 ±
0.0025
100
0.0021 ±
0.001
0.002 ±
0.0004
0.0025 ±
0.0009
0.0023 ±
0.0006
0.0028 ±
0.001
150
0.0013 ±
0.0007
0.0026 ±
0.0006
0.0018 ±
0.0014
0.0021 ±
0.0012
0.0025 ±
0.0007
200
0.0013 ±
0.0005
0.0022 ±
0.0005
0.0018 ±
0.0009
0.0023 ±
0.0009
0.0014 ±
0.0006
ferent changes in the nature of fluctuations of MR
signals were observed depending on changes in the
HRV signal.
On Some Possibilities of using Microwave Radiometry in the Analysis of Fluctuation Processes in Brain Tissue
419

Table 2: HRV Spectral Powers (ms).
Stage of the Experiment
T F S1 B S2 A
Subject1
HF 8.5 ± 1.6 - 7.54 ± 0.69 - 8.26 ± 1.08
LF 17.38 ± 6.38 - 15.57 ± 5.52 - 19.82 ± 6.14
50 5.06 ± 2.43 - 4.8 ± 1.97 -
7.72 ± 2.84
100 4.85 ± 1.75 -
7.2 ± 2.6
- 4.98 ± 2.25
VLF 13.04 ± 5.15 - 13.85 ± 4.8 - 15.42 ± 4.3
Subject2
HF 3.36 ± 0.65 - 3.2 ± 0.54 - 3.53 ± 0.38
LF 4.03 ± 1.81 - 5.13 ± 2.25 - 5.75 ± 1.75
50 1.86 ± 0.57 -
3.04 ± 1.17 - 2.77 ± 1.25
100 1.35 ± 0.55 -
2.88 ± 1.46 - 2.3 ± 0.84
VLF 4.31 ± 1.85 - 7.75 ± 4.2 - 6.87 ± 3.27
Subject3
HF 5.03 ± 1.46 - 4.81 ± 0.55 -
12.45 ± 10.47
LF 9.94 ± 4.49 -
13.9 ± 4.86 - 22.46 ± 8.05
50 6.69 ± 3.39 - 6.03 ± 1.52 - 9.8 ± 4.13
100 3.32 ± 1.31 - 2.7 ± 0.98 - 5.94 ± 2.63
VLF 12.24 ± 6.7 - 11.68 ± 4.13 -
18.85 ± 7.84
Subject4
HF 13.55 ± 1.82 -
9.04 ± 1.1
- 12.17 ± 1.7
LF 25.55 ± 6.45 - 29.97 ± 6.33 - 26.44 ± 6.54
50 10.57 ± 3.9 - 12.06 ± 2.47 - 12.22 ± 5.55
100 6.74 ± 2.95 -
4.37 ± 2.2
- 8.43 ± 3.5
VLF 22.64 ± 8.96 - 20.15 ± 6.66 - 24.03 ± 11.65
Subject5
HF 2.63 ± 0.43 - 2.75 ± 0.43 - 2.95 ± 0.66
LF 4.98 ± 1.34 - 4.48 ± 1.22 - 3.83 ± 1.04
50 3.07 ± 1.15 - 2.68 ± 0.56 - 3.05 ± 1.44
100 3.29 ± 1.42 -
2.41 ± 1.17 - 1.07 ± 0.58
VLF 8.49 ± 3.2 - 6.69 ± 2.85 - 5.4 ± 2.35
So for the first subject, an increase in the amplitude
of oscillations was noted with periods of 100 seconds
during the break and with periods of 50 seconds during
the aftereffect for the HRV signal. At the same time,
significant changes were noted in the MR signal during
the break for periods of fluctuations of 100 and 150
seconds.
For the third subject, a significant increase in
fluctuations was observed in the LF range during the
break and during the aftereffect. For the MR signal, a
significant decrease in amplitude was noted for periods
of fluctuations of 150 seconds after the break.
For the fourth subject, there was a significant
decrease in fluctuations in the HF range and
fluctuations with a period of 100 seconds during a
break for the HRV signal. Moreover, in the MR
signals, a decrease in amplitude was noted during the
first stimulation for periods of fluctuations of 150 and
200 seconds. An increase in the amplitude of
fluctuations with a period of 50 seconds was also noted
during the first stimulation and interruption.
4 CONCLUSIONS
The article presents pilot study of the fluctuation
processes in the brain tissues. Experimental setup
consists of the simultaneous record of microwave
radiation in frequency range (3.4-4.2) GHz and heart
rate variability signals. As the functional load the
neuro-electrostimulation was used. The preliminary
results have shown that the changes of the fluctuation
process in brain tissues during the neuro-
electrostimulation depends on the changes in the
autonomic nervous system, as evaluated by heart rate
variability analysis.
ACKNOWLEDGEMENTS
The reported study was funded by RFBR according to
the research project № 18-29-02052 and supported by
Act 211 Government of the Russian Federation,
contract № 02.A03.21.0006.
REFERENCES
Addison, P. S. (2005). Wavelet transforms and the ECG: A
review. Physiological Measurement, 26(5), R155–R199.
https://doi.org/10.1088/0967-3334/26/5/R01
Bryukhovetskiy, A. S. (2015). Novel theory of the human
brain: Information-commutation basis of architecture and
principles of operation. Journal of Neurorestoratology,
3(1), 39–56.
Kublanov, V. S. (2008). A hardware-software system for
diagnosis and correction of autonomic dysfunctions.
Biomedical Engineering, 42(4), 206–212.
https://doi.org/10.1007/s10527-008-9047-7
Malik, M. (1996). Heart rate variability: Standards of
measurement, physiological interpretation, and clinical
use. Circulation, 93(5), 1043–1065. Retrieved from
Scopus.
Nicholls, J. G., Martin, A. R., Wallace, B. G., & Fuchs, P. A.
(2001). From neuron to brain. Sinauer Associates
Sunderland, MA.
Togo, F., Kiyono, K., Struzik, Z. R., & Yamamoto, Y.
(2006). Unique very low-frequency heart rate variability
during deep sleep in humans. IEEE Transactions on
Biomedical Engineering, 53(1), 28–34. https://doi.org/
10.1109/TBME.2005.859783
NDNSNT 2020 - Special Session on Non-invasive Diagnosis and Neuro-stimulation in Neurorehabilitation Tasks
420
