
Data-Driven Insights towards Risk Assessment of Postpartum
Depression
Evdoxia Valavani
1a
, Dimitrios Doudesis
1,2 b
, Ioannis Kourtesis
3c
, Richard F. M. Chin
4,5 d
,
Donald J. MacIntyre
6e
, Sue Fletcher-Watson
7f
, James P. Boardman
8,9 g
and Athanasios Tsanas
1,10 h
1
Usher Institute, Medical School, University of Edinburgh, Teviot Place, Edinburgh EH8 9AG, U.K.
2
BHF Centre for Cardiovascular Sciences, University of Edinburgh, 47 Little France Crescent Edinburgh EH16 4TJ, U.K.
3
Psychiatric Hospital of Attica Dafni, Athinon Avenue, Athens 12462, Greece
4
Muir Maxwell Epilepsy Centre, Centre for Clinical Brain Sciences, The University of Edinburgh,
9 Sciennes Road, Edinburgh EH9 1LF, U.K.
5
Royal Hospital for Sick Children, 9 Sciennes Road, Edinburgh EH9 1LF, U.K.
6
Division of Psychiatry, Deanery of Clinical Sciences, Royal Edinburgh Hospital, University of Edinburgh,
Morningside Park, Edinburgh EH10 5HF, U.K.
7
Salvesen Mindroom Research Centre, Kennedy Tower, Royal Edinburgh Hospital, University of Edinburgh,
Morningside Park, Edinburgh EH10 5HF, U.K.
8
MRC, Centre for Reproductive Health, University of Edinburgh, 47 Little France Crescent, Edinburgh EH16 4TJ, U.K.
9
Centre for Clinical Brain Sciences, University of Edinburgh, Chancellor’s Building, 49 Little France Crescent,
Edinburgh EH16 4SB, U.K.
10
Mathematical Institute, University of Oxford, Woodstock Road, Oxford OX2 6GG, U.K.
{d.macintyre, sue.fletcher-watson, james.boardman, athanasios.tsanas}@ed.ac.uk
Keywords: Postpartum Depression, Feature Selection, Random Forests.
Abstract: Postpartum depression is defined as depressive episodes that occur during pregnancy or within 12 months of
parturition. The goal of this study is the exploration of the birth features and maternal traits which affect the
risk of postpartum depression for mothers with preterm neonates. We analysed data from 144 women (63
mothers of term and 81 mothers of preterm infants) who completed the Edinburgh Postnatal Depression Scale
(EPDS) in the postpartum period. We used three feature selection algorithms: ReliefF, Random Forests (RF)
variable importance, and Boruta, in order to select the most predictive feature subsets, which were
subsequently mapped onto the binarized EPDS total score (a threshold of 10 was used to binarize the EPDS
total scores) using RF. We found that positive affectivity (r
s
=-0.467, p<0.001), and the Apgar score at 5
minutes (r
s
=-0.430, p<0.001) are the most statistically strongly associated features with the risk of postpartum
depression. We used 10-fold cross-validation with 100 iterations and report out-of-sample balanced accuracy
(median±IQR): 75.0±16.7, sensitivity: 66.7±16.7, specificity: 100±16.7, and F1 score: 0.8±0.2. Collectively,
these findings highlight the potential of using a data-driven process to automate risk prediction using standard
clinical characteristics and motivate the deployment of the developed tool using larger-scale datasets.
a
https://orcid.org/0000-0003-0625-9454
b
https://orcid.org/0000-0001-6699-9476
c
https://orcid.org/0000-0001-9197-4924
d
https://orcid.org/0000-0002-7256-3027
e
https://orcid.org/0000-0001-6963-1335
f
https://orcid.org/0000-0003-2688-1734
g
https://orcid.org/0000-0003-3904-8960
h
https://orcid.org/0000-0002-0994-8100
382
Valavani, E., Doudesis, D., Kourtesis, I., Chin, R., MacIntyre, D., Fletcher-Watson, S., Boardman, J. and Tsanas, A.
Data-Driven Insights towards Risk Assessment of Postpartum Depression.
DOI: 10.5220/0009369303820389
In Proceedings of the 13th International Joint Conference on Biomedical Engineering Systems and Technologies (BIOSTEC 2020) - Volume 4: BIOSIGNALS, pages 382-389
ISBN: 978-989-758-398-8; ISSN: 2184-4305
Copyright
c
2022 by SCITEPRESS – Science and Technology Publications, Lda. All rights reserved

1 INTRODUCTION
Non-psychotic mental disorders are common during
pregnancy and the postpartum period, and have a
negative impact on the mother and her offspring
(Howard et al., 2014). Postpartum depression is
defined by the American Psychiatric Association’s
Diagnostic and Statistical Manual, Fifth Edition
(DSM-5) as a major depressive episode that occurs
either during pregnancy or within 4 weeks of
parturition (APA, 2013). In practice, it is
operationalised as depressive episodes occurring
within 6 to 12 months of delivery (Committee on
Obstetric Practice, 2015). Postnatal non-psychotic
depression affects approximately 3-6% of women
during pregnancy or in the postnatal period (APA,
2013).
Clinical manifestations include despondency,
emotional lability, tearfulness, feelings of guilt,
anhedonia, low energy, loss of appetite, poor sleep,
poor concentration and memory, fatigue, irritability,
as well as feelings of being incapable of looking
after the offspring (Stewart, 2005). It is also
common for some women to report suicidal ideation
(Martini et al., 2019). Many studies have shown that
mothers’ perinatal depressive symptoms can
negatively affect the social, emotional, and
cognitive developmental outcomes of their offspring
(Letourneau et al., 2019).
Risk factors for postpartum depression include
previous history of mental health disorders such as
depression and anxiety, negative feelings towards
the current birth, low self-esteem regarding the
parental role, and positive history of sexual abuse
(Ghaedrahmati et al., 2017). Risky pregnancy,
emergency caesarean section, complications and
long hospitalization also seem to have a negative
impact on mothers’ mental health, whereas
breastfeeding is associated with lower risk of
depression. Furthermore, studies have shown a
positive correlation between young age during
pregnancy, metabolism disorders, reduced
serotonin, oxytocin, oestrogen levels and postnatal
depressed mood (Ghaedrahmati et al., 2017).
Finally, lack of emotional and financial support,
unemployment and low socioeconomic status,
sexual and domestic violence during the prenatal
period, sleeping disorders, as well as habits such as
smoking, low physical activity and unhealthy diet
can potentially increase the risk of postpartum mood
disorders (Ghaedrahmati et al., 2017).
Early detection of postpartum depression is
alarmingly low (Moraes et al., 2017). One standard
widely used clinical metric which is a validated
screening tool for postpartum depression is the
Edinburgh Postnatal Depression Scale (EPDS)
(Cox, Holden and Sagovsky, 1987). It consists of ten
items which assess symptoms of depression such as
anxiety, low energy, sleep disorders, and suicidal
thoughts. The scale shows how the mother has felt
over the preceding week. Total scores of ten or more
indicate possible depression of varying severity. The
EPDS may be used within eight weeks postpartum
and it can also be used as a depression screening tool
during pregnancy (Cox, Holden and Sagovsky,
1987). According to a systematic review of
validation studies of the EPDS conducted by Gibson
et al. 2009, when using a cut-off point of 10, the
sensitivity of the EPDS for detecting postpartum
depression ranged from 59 to 100%, and the
specificity ranged from 44 to 97% (Gibson et al.,
2009).
The aim of this study is to explore the birth
features and maternal traits that affect the risk of
postpartum depression for mothers and build a
statistical learning model in order to predict the risk
of postpartum depression for mothers who have
given birth to preterm neonates.
2 DATA
The study used data that comes from a longitudinal
study conducted at the Royal Infirmary of
Edinburgh which investigates the impact of preterm
birth on long-term outcomes
(https://theirworld.org). A total of 144 women
completed the EPDS during the first month
following childbirth, of whom 63 had term born
neonates, and 81 had preterm neonates. We analysed
data comprising demographic characteristics,
infants’ characteristics (i.e. gestational age,
birthweight, occipitofrontal circumference, Apgar
score), morbidities, and complications that occur
during the neonatal period, socioeconomic status,
and data derived from questionnaires which assess
characteristics of temperament (Adult Temperament
Questionnaire, short form), intelligence (National
Adult Reading Test), and risk of postpartum
depression (Edinburgh Postnatal Depression Scale).
Socioeconomic status of the family was determined
using the Scottish Index of Multiple Deprivation
2016. Table 1 presents the demographic
characteristics of the mothers.
Data-Driven Insights towards Risk Assessment of Postpartum Depression
383

Table 1: Demographic characteristics of the mothers who
completed the EPDS in the postpartum period.
Characteristic
Mothers with
term born
neonates
(n=63)
Mothers with
preterm
neonates
(n=81)
Age (years) 34 ± 7 31 ± 7
Ethnicity
Any White 54 (91) 73 (93)
Asian 2 (4) 4 (5)
Black 0 (0) 1 (1)
Mixed 2 (3) 1 (1)
Other 1 (2) 0 (0)
Education
None 0 (0) 2 (3)
1-4 GCSE 1 (2) 4 (6)
≥5 GCSE 2 (3) 5 (7)
A Levels/Highers 2 (3) 9 (12)
College 4 (7) 17 (24)
University 27 (47) 22 (31)
Postgraduate degree 22 (38) 13 (18)
SIMD Quintile
1 3 (5) 10 (13)
2 8 (13) 22 (28)
3 11 (17) 12 (15)
4 17 (27) 18 (23)
5 24 (38) 16 (21)
Full IQ 122.74 ± 4.96 121.10 ± 7.43
BMI 24.7 ± 6.6 26.2 ± 7.28
Gestation (weeks) 39.56 ± 1.42 29.84 ± 2.72
Variables are presented in the form median ± IQR or
number (%). Education refers to the highest educational
level attained. GCSE stands for General Certificate of
Secondary Education. SIMD stands for Scottish Index of
Multiple Deprivation. IQ stands for Intelligence Quotient.
BMI stands for Body Mass Index.
3 METHODS
We used the standard clinical cut-off of 10 (Cox,
Holden and Sagovsky, 1987) to binarize the EPDS
total scores; scores lower than 10 were classified as
“low risk for postpartum depression”, and scores
equal to or higher than 10 were classified as “high risk
for postpartum depression”. We aimed to build a
statistical model in order to estimate whether scores
would be above or below the clinical threshold (i.e.
this is a binary classification task).
3.1 Preliminary Statistical Analysis
We used the Mann – Whitney rank sum test (Mann
and Whitney, 1947) to test whether the difference
between the medians of the EPDS total score of
mothers with term born neonates and mothers with
preterm neonates is zero. The level of significance
associated with the null hypothesis was set at
α = 0.05.
In order to quantify the strength of the association
between two variables, we computed the Spearman’s
rank correlation coefficient which is effective in
quantifying general monotonic relationships
(Schober, Boer and Schwarte, 2018). There is no
universal guideline to determine when a bivariate
relationship is statistically strong; it depends on the
application (Cohen et al., 2002). In this study, we
consider that an absolute value of a correlation
coefficient > 0.3 corresponds to a statistically strong
association, in accordance to similar studies in
clinical contexts (Meyer et al., 2001; Tsanas, Little
and McSharry, 2013).
3.2 Feature Selection
A problem that often arises when we analyse high
dimensional data is the curse of dimensionality
(Bellman, 1966); given that there is only a finite
number of available samples, as the dimensions of the
feature space increase, it is difficult to adequately
populate the feature space, with detrimental effects in
the performance of the learners (Hastie, Tibshirani
and Friedman, 2009). The number of data samples
required, often grows exponentially with the number
of features. Prediction performance can often be
improved by reducing the number of dimensions in
the feature space, a process that is called
dimensionality reduction. Dimensionality reduction
techniques can be divided into two main categories:
feature transformation and feature selection (Guyon
and Elisseeff, 2003).
In this study, we have compared three efficient
feature selection algorithms: (a) ReliefF (Kononenko,
1994), (b) Random Forests (RF) variable importance
(Hastie, Tibshirani and Friedman, 2009; James et al.,
2013), and (c) Boruta (Kursa and Rudnicki, 2010).
ReliefF is a feature-weighting algorithm; it
assigns a ‘weight’ value to all features of a dataset
based on how well their values distinguish between
the data samples that are near to each other and thus,
how useful they are in predicting the response
variable. There are various feature evaluation
measures that ReliefF can use. In this study, we have
explored ReliefF expRank where k nearest instances
have weight exponentially decreasing with increasing
rank.
When using RF (Breiman, 2001), it is possible to
measure the importance of each feature in predicting
SERPICO 2020 - Special Session on Mining Self-reported Outcome Measures, Clinical Assessments, and Non-invasive Sensor Data
Towards Facilitating Diagnosis, Longitudinal Monitoring, and Treatment
384

the response variable. At each split in each tree, the
improvement in the split – criterion is the importance
measure attributed to the splitting variable and is
accumulated over all the trees in the forest for each
feature. In the context of classification models, we
can measure the total amount that the Gini index is
decreased by splits over a given feature, averaged
over all trees. A large value indicates an important
feature (Hastie, Tibshirani and Friedman, 2009;
James et al., 2013).
The Boruta algorithm is a wrapper feature
selection technique built around the random forest
learner that measures the importance of each feature
by dividing the average loss of accuracy among all
trees by the standard deviation of the accuracy loss
(Kursa and Rudnicki, 2010). In other words, it uses Z
score as the importance measure.
In this study, the feature subsets were selected
using a Cross-Validation (CV) approach, using only
the training dataset in each CV iteration. We repeated
the CV process a total of 100 times. The feature
selection algorithms described above aim at ranking
the features of a given dataset based on their
contribution towards prediction of the response
variable. In order to select the final feature subset for
each feature selection algorithm, we followed the
process described by Tsanas et al. in 2012 (Tsanas et
al., 2012). In a nutshell, for a given feature selection
algorithm, when using CV, at the end of each
iteration, we obtain a vector of the ordered sequence
of the indices of the features, where the first feature is
considered to be the most important one, and the last
feature corresponds to the least important one. We
store these vectors in a matrix of n x p size, where n
corresponds to the number of iterations and p
corresponds to the number of features of a given
dataset. This way, in each of the rows of the matrix
we have stored the feature subset selected at the end
of each iteration. Subsequently, we need to identify
the feature index which has most frequently been
ranked as first across all iterations, then we need to
identify which feature appears most frequently as
second or third and so on. In case a feature index has
already been included in the final subset and is later
found again as most frequent, we need to select the
second most frequent and so on. Ties are resolved by
including the lowest index number. In the end, we
obtain a vector which consists of feature indices
ordered from the most important to the least
important one, for a given feature selection algorithm.
These features are then used to train the learner one
by one. We choose to keep the most parsimonious
model that gives the best overall results in terms of
accuracy, sensitivity, specificity, and F1 score.
3.3 Mapping Selected Features to the
Response
Our ultimate goal is to estimate the function f which
relates X and y, that is f(X) = y, where y is the
response variable and X is a matrix comprising p
features X
1
, X
2
, X
3
, …, X
p
. That is, we need a binary
classifier that will use the selected features to predict
the risk of postpartum depression.
Here, we used RF (Breiman, 2001) which is a
widely-used statistical machine learning algorithm.
RF involve fitting decision trees on bootstrapped
samples of the original training data and then
combining all individual trees (we used 500 trees) to
create a single powerful predictive model. When
building these decision trees, each time a split in a tree
is considered, a random sample of m features is
chosen as split candidates from the full set of p
features. The split is allowed to use only one of those
m predictors. Following the suggestion of Breiman
(Breiman, 2001), we set m to be equal to the square
root of the number of features in the training data.
3.4 Classifier Validation
We validated our model using CV, which provides an
estimate of the performance of the model on new
“unseen” data, provided that the new data comes from
the same joint distribution as the data that was used to
train the model. In this study, we used 10-fold cross-
validation and repeated the process 10 times,
resulting in 100 iterations.
4 RESULTS
4.1 Preliminary Statistical Analysis
Regarding mothers who had term born neonates (n =
63), the total scores of the EPDS ranged from 0 to 15,
with a median score of 6. Among them, 16 mothers
had a total score of 10 or above, indicating high risk
of depression, while the rest scored lower than 10.
With regards to the mothers who had preterm
neonates (n = 81), the total scores of the EPDS ranged
from 0 to 23, with a median score of 7. Among them,
27 mothers had a total score of 10 or above, indicating
high risk of depression, while the rest of the mothers
scored lower than 10.
Figure 1 shows a histogram of the total scores of
the EPDS for mothers with term born neonates and
mothers with preterm neonates. The dashed lines
represent the median scores. The p-value of the Mann
Data-Driven Insights towards Risk Assessment of Postpartum Depression
385
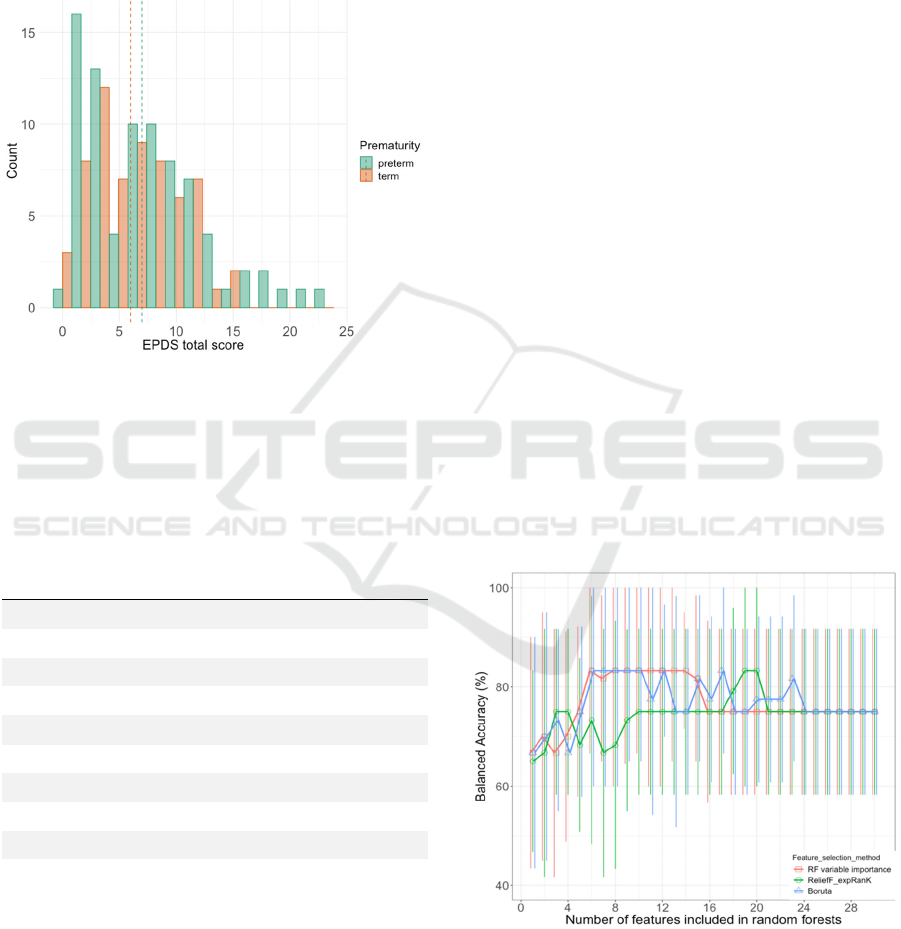
– Whitney rank sum test is 0.459. At the 0.05
significance level, there is not enough evidence to
reject the null hypothesis that there is no statistically
significant difference in the medians of the EPDS
total score between mothers who had a term born
neonate and those who gave birth to preterm
neonates.
Figure 1: EPDS total score histogram plot. The dashed line
represents the median scores.
Table 2: Correlation analysis for the EPDS total score of the
mothers who had preterm neonates (n = 81).
Feature
Statistical
association
(Spearman
correlation
coefficient)
Statistical
significance
(p-value)
Positive affect -0.467 <0.001
Apgar 5min -0.430 <0.001
Fear 0.399 <0.01
Extraversion -0.347 <0.01
Attentional control -0.339 <0.01
Days of intubation 0.330 <0.01
Days of supplemental O
2
0.323 <0.01
Gestation -0.318 <0.01
Previous live births 0.309 <0.01
Neutral perceptual
sensitivity
-0.307 <0.05
Only the ten most strongly associated features with the
EPDS total score are presented in the Table for brevity.
Positive affect, fear, extraversion, attentional control, and
neutral perceptual sensitivity are characteristics of
temperament derived from the Adult Temperament
Questionnaire, short form, and assessed during the first
month following delivery.
Table 2 presents the ten features (out of 102) most
strongly associated with the total score of the EPDS
for mothers with preterm infants. The features are
sorted according to the absolute value of the
correlation coefficient. Positive affect, fear,
extraversion, attentional control, previous live births,
and neutral perceptual sensitivity are all maternal
features. Apgar score at 5 minutes, total number of
days of intubation, total number of days of
supplemental oxygen, and gestation refer to infant
features. It is interesting to note that all features
exhibit statistically significant (p<0.05) correlation.
These findings give some initial confidence that the
binary classification task of this study may lead to
accurate results.
4.2 Classification Stage: Mapping
Features to the Thresholded EPDS
Total Score for Mothers with
Preterm Neonates
Figures 2, 3 and 4 illustrate the out of sample
performance of the RF as a function of the number of
features selected by the different feature selection
algorithms. We found that the feature size giving the
best results in terms of accuracy, sensitivity,
specificity, and F1 score is 13 using ReliefF expRank.
Therefore, our subsequent results use the first 13
features selected by each feature selection algorithm.
Table 4 presents the selected feature subsets for each
feature selection algorithm. We remark that reducing
Figure 2: Comparison of out of sample median balanced
accuracy results with IQR of the random forests classifier
using the features selected by each of the five feature
selection algorithms. These results are computed using 10-
fold CV with 100 iterations. For clarity, only the first 30
steps are presented.
SERPICO 2020 - Special Session on Mining Self-reported Outcome Measures, Clinical Assessments, and Non-invasive Sensor Data
Towards Facilitating Diagnosis, Longitudinal Monitoring, and Treatment
386
the original 102 dimensions of the feature space leads
to an improvement in out-of-sample performance
accuracy with RF. Table 3 shows a confusion matrix
of the performance of the RF when mapping the
features selected by ReliefF expRank (i.e. previous
live births, bronchopulmonary dysplasia, and
extraversion) to the response.
Figure 3: Comparison of out of sample median sensitivity
results with IQR of the random forests classifier using the
features selected by each of the five feature selection
algorithms. These results are computed using 10-fold CV
with 100 iterations. For clarity, only the first 30 steps are
presented.
Figure 4: Comparison of out of sample median specificity
results with IQR of the random forests classifier using the
features selected by each of the five feature selection
algorithms. These results are computed using 10-fold CV
with 100 iterations. For clarity, only the first 30 steps are
presented.
Table 3: Confusion matrix summarizing the out-of-sample
findings using 10-fold CV.
Reference
High risk of
depression
Low risk of
depression
Prediction
High risk of
depression
165 47
Low risk of
depression
105 493
Total number of entries is 810, which is derived from 81
samples x 10 iterations.
Table 4: Selected feature subsets and out-of-sample
classification performance.
ReliefF
expRanK
RF variable
importance
Boruta
Previous live
births
Extraversion Extraversion
BPD Positive affect Positive affect
Extraversion Fear Attentional
control
Maternal
anxiety
Gestation Fear
Days of
intubation
Attentional
control
Gestation
Apgar score
at 5 min
Inhibitory
control
Apgar score at
5 min
Days of
supplemental
O
2
Effortful
control
Inhibitory
control
Effortful
control
Apgar score at
5 min
Effortful
control
Inhibitory
control
Affective
perceptual
sensitivity
Affective
perceptual
sensitivity
Positive
affect
Days of supple-
mental O
2
Days of supple-
mental O
2
Feeding at
discharge
from NICU
Previous live
births
Days of
intubation
ROP Negative affect Negative affect
Maternal
asthma
Total days in
the NICU
Total days in
the NICU
Accuracy
Specificity
Sensitivity
F1 score
75.0±16.7
100±16.7
66.7±16.7
0.8±0.2
83.3±18.3
100±16.7
66.7±50.0
0.8±0.2
75.0±23.3
100±20.0
66.7±66.7
0.8±0.2
The selected features from each feature selection algorithm
are sorted in descending order from the most important to the
least important one. The last row presents the performance of
the random forests classifier for each feature subset. The
results are given in the form median±IQR. BPD stands for
Bronchopulmonary Dysplasia. NICU stands for Newborn
Intensive Care Unit. ROP stands for Retinopathy of
Prematurity.
Data-Driven Insights towards Risk Assessment of Postpartum Depression
387

5 DISCUSSION
In this study, our goal has been to build a
parsimonious model to determine the features that
could potentially predict the risk of postpartum
depression for mothers with preterm infants. To this
end, we compared three different feature selection
algorithms: (a) ReliefF, (b) Boruta, and (c) RF
variable importance in order to derive a small feature
subset which would be more informative than the
original feature set. Subsequently, in order to map the
selected features to the response we used RF.
We analysed data from 144 women who
completed the EPDS during the postpartum period, of
whom 63 have had term born neonates, and 81 have
had preterm neonates. For mothers who gave birth to
preterm neonates, correlation analysis revealed
statistically strong correlations. At this point, we need
to emphasize that interpretation of the results is
tentative due to the small sample size. We found that
the risk of postpartum depression is affected both by
mothers’ temperament, and perinatal factors.
Specifically, the two most strongly associated
features with risk of postpartum depression for
mothers with preterm infants are positive affect (r
s
=-
0.467, p<0.001), and the Apgar score at 5 minutes
after birth (r
s
=-0.430, p<0.001). These two features
have a negative association with postpartum
depression, meaning that mothers with high positive
affectivity (i.e. enthusiastic, energetic, confident)
have a lower risk of developing postpartum
depression. A lower Apgar score at 5 minutes after
birth increases the risk of postpartum depression.
Here, the Apgar score might be a proxy for
subsequent events, such as neonatal morbidities or
days spent in the NICU. Fear, another characteristic
of adult temperament assessed by the Adult
Temperament Questionnaire short form, has a strong
positive association with risk of postpartum
depression (r
s
=0.399, p<0.01). On the other hand,
extraversion (i.e. the tendency of primarily obtaining
gratification from outside oneself) (r
s
=-0.347,
p<0.01), attentional control (i.e. capacity to focus and
shift attention when desired) (r
s
=-0.339, p<0.01), and
neutral sensitivity (i.e. detection of low intensity
stimuli) (r
s
=-0.307, p<0.05) have a strong negative
association with postpartum depression. Moreover,
risk of postpartum depression increases with
decreasing gestational age (r
s
=-0.318, p<0.01). The
total days of intubation (r
s
=0.330, p<0.01), as well as
the total days of supplemental O
2
(r
s
=0.323, p<0.01)
that a preterm infant requires increase the risk of
postpartum depression. These two exposures are
proxies of respiratory co-morbidities of preterm birth,
which may cause distress to mothers. Finally, a past
history of live births is positively associated with
postpartum depression (r
s
=0.309, p<0.01).
We found that the feature size giving the best
results in terms of accuracy, sensitivity, specificity,
and F1 score is 13 using the feature selection
algorithm ReliefF expRank. The feature subset
selected by the ReliefF expRank comprised past
history of live births, bronchopulmonary dysplasia,
extraversion, anxiety, total days of intubation and
supplemental oxygen, Apgar score at 5 minutes after
birth, effortful control, inhibitory control, positive
affect, the infant’s feeding at discharge, retinopathy
of prematurity, and maternal asthma. We can
conclude that extraversion, which is a characteristic
of adult temperament, positive affect, as well as
effortful control and inhibitory control are negatively
correlated with the risk of postpartum depression. On
the other hand, past history of anxiety and chronic
diseases such as asthma may increase the risk of
postpartum depression. Bronchopulmonary
dysplasia, and retinopathy of prematurity are diseases
that can result in significant morbidity for preterm
neonates, causing distress to mothers. Furthermore, a
lower Apgar score at 5 minutes after birth, and a
higher number of days requiring intubation and
supplemental oxygen increase the risk of postpartum
depression; mothers who breastfeed their babies have
a lower risk of depression compared to mothers
whose babies drink infant formula. Finally, mothers
with existing childcare responsibilities find it more
challenging to cope after having a preterm infant
compared with those who do not have pre-existing
childcare duties. The performance of the RF resulted
in out-of-sample balanced accuracy (median±IQR):
75.0±16.7, specificity: 100±16.7, and sensitivity:
66.7±16.7, and F1 score: 0.8±0.2.
Although we found some statistically strong
correlations which gave some initial confidence that
the statistical learning model would have a good
chance of success, the performance of the RF was
poor when taking into account the class imbalance in
the investigated problem. One possible reason for the
poor model performance is lack of statistical power:
the sample size is not sufficiently large to effectively
train the models. Another reason for poor model
performance might be the fact that the given variables
are insufficient to predict the response accurately. In
addition, we need to bear in mind that a considerable
number of features has been derived from
questionnaires completed by the individuals
themselves and therefore subjectivity in data
collection may be another issue affecting the results.
SERPICO 2020 - Special Session on Mining Self-reported Outcome Measures, Clinical Assessments, and Non-invasive Sensor Data
Towards Facilitating Diagnosis, Longitudinal Monitoring, and Treatment
388

We remark there are many contemporary
advanced classifiers that can be used in order to map
the features to the response, such as RF and Support
Vector Machines (SVM). Here, in order to map the
selected features to the response we only used RF and
have not explored competing approaches (e.g. SVM)
to optimize the classification performance further.
We envisage that a larger sample size may lead to
a better and more generalizable model that may be
more accurate in correctly assessing postpartum
depression risk. Future work could potentially
incorporate additional statistical machine learning
algorithms which may improve prediction accuracy.
REFERENCES
APA (2013) DSM-V-The Diagnostic and Statistical
Manual of Mental Disorders.
Bellman, R. (1966) ‘Dynamic programming.’, Science
(New York, N.Y.). American Association for the
Advancement of Science, 153(3731), pp. 34–7. doi:
10.1126/science.153.3731.34.
Breiman, L. (2001) ‘Random Forests’, Machine Learning.
Kluwer Academic Publishers, 45(1), pp. 5–32. doi:
10.1023/A:1010933404324.
Cohen, J. et al. (2002) Applied Multiple Regression/
Correlation Analysis for the Behavioral Sciences Third
Edition. Available at: https://www.gbv.de/dms/
ilmenau/toc/348809573.PDF (Accessed: 28 June
2019).
Committee on Obstetric Practice (2015) ‘The American
College of Obstetricians and Gynecologists Committee
Opinion no. 630. Screening for perinatal depression.’,
Obstetrics and gynecology, 125(5), pp. 1268–71. doi:
10.1097/01.AOG.0000465192.34779.dc.
Cox, J. L., Holden, J. M. and Sagovsky, R. (1987)
‘Detection of Postnatal Depression’, British Journal of
Psychiatry. Cambridge University Press, 150(06), pp.
782–786. doi: 10.1192/bjp.150.6.782.
Ghaedrahmati, M. et al. (2017) ‘Postpartum depression risk
factors: A narrative review.’, Journal of education and
health promotion. Wolters Kluwer -- Medknow
Publications, 6, p. 60. doi: 10.4103/jehp.jehp_9_16.
Gibson, J. et al. (2009) ‘A systematic review of studies
validating the Edinburgh Postnatal Depression Scale in
antepartum and postpartum women’, Acta Psychiatrica
Scandinavica. John Wiley & Sons, Ltd (10.1111),
119(5), pp. 350–364. doi: 10.1111/j.1600-
0447.2009.01363.x.
Guyon, I. and Elisseeff, A. (2003) An Introduction to
Variable and Feature Selection, Journal of Machine
Learning Research. Available at:
http://jmlr.csail.mit.edu/papers/volume3/guyon03a/gu
yon03a.pdf (Accessed: 29 June 2019).
Hastie, T., Tibshirani, R. and Friedman, J. (2009) The
Elements of Statistical Learning Data Mining,
Inference, and Prediction. 2nd edn. Springer New
York.
Howard, L. M. et al. (2014) ‘Non-psychotic mental
disorders in the perinatal period.’, Lancet (London,
England), 384(9956), pp. 1775–88. doi: 10.1016/S01
40-6736(14)61276-9.
James, G. et al. (2013) An Introduction to Statistical
Learning with Applications in R.
Kononenko, I. (1994) ‘Estimating attributes: Analysis and
extensions of RELIEF’, in. Springer, Berlin, Heidelberg,
pp. 171–182. doi: 10.1007/3-540-57868-4_57.
Kursa, M. B. and Rudnicki, W. R. (2010) ‘Feature Selection
with the Boruta Package’, Journal of Statistical
Software, 36(11), pp. 1–13. doi: 10.18637/jss.v036.i11.
Letourneau, N.
et al. (2019) ‘Maternal and paternal
perinatal depressive symptoms associate with 2- and 3-
year-old children’s behaviour: findings from the
APrON longitudinal study’, BMC Pediatrics, 19(1), p.
435. doi: 10.1186/s12887-019-1775-1.
Mann, H. B. and Whitney, D. R. (1947) ‘On a Test of
Whether one of Two Random Variables is
Stochastically Larger than the Other’, The Annals of
Mathematical Statistics. Institute of Mathematical
Statistics, 18(1), pp. 50–60. doi: 10.1214/aoms/117773
0491.
Martini, J. et al. (2019) ‘Predictors and outcomes of suicidal
ideation during peripartum period.’, Journal of affective
disorders, 257, pp. 518–526. doi: 10.1016/j.jad.2019.
07.040.
Meyer, G. J. et al. (2001) ‘Psychological testing and
psychological assessment. A review of evidence and
issues.’, The American psychologist, 56(2), pp. 128–65.
Available at: http://www.ncbi.nlm.nih.gov/pubmed/
11279806 (Accessed: 7 July 2019).
Moraes, G. P. de A. et al. (2017) ‘Screening and diagnosing
postpartum depression: when and how?’, Trends in
Psychiatry and Psychotherapy. Associação de
Psiquiatria do Rio Grande do Sul, 39(1), pp. 54–61. doi:
10.1590/2237-6089-2016-0034.
Schober, P., Boer, C. and Schwarte, L. A. (2018)
‘Correlation Coefficients’, Anesthesia & Analgesia,
126(5), pp. 1763–1768. doi: 10.1213/ANE.00000000
00002864.
Stewart, D. (2005) ‘Depression during pregnancy.’,
Canadian family physician Medecin de famille
canadien. College of Family Physicians of Canada,
51(8), pp. 1061–7. Available at: http://www.ncbi.nlm.
nih.gov/pubmed/16121822 (Accessed: 2 December
2019).
Tsanas, A. et al. (2012) ‘Novel Speech Signal Processing
Algorithms for High-Accuracy Classification of
Parkinson’s Disease’, IEEE Transactions on
Biomedical Engineering, 59(5), pp. 1264–1271. doi:
10.1109/TBME.2012.2183367.
Tsanas, A., Little, M. A. and McSharry, P. E. (2013) ‘A
methodology for the analysis of medical data’, in
Handbook of Systems and Complexity in Health.
Springer, pp. 113–125.
Data-Driven Insights towards Risk Assessment of Postpartum Depression
389
