
Internet of Trees: A Vision for Advanced Monitoring of Crops
Alessandro Checco
1,∗ a
and Davide Polese
2,∗ b
1
Information School, The University of Sheffield, Sheffield, U.K.
2
Istituto per la Microelettronica e Microsistemi, Consiglio Nazionale delle Ricerche, Roma, Italy
Keywords:
Precision Agriculture, WSN, OpenThread, Chemical Gas Sensors.
Abstract:
Ecosystem preservation and production maximisation are competing objectives in agriculture. Reducing the
need of undifferentiated or late interventions on the crops would reduce the number of disease treatments
needed, as well as the consumption of water and fertiliser. This objective is only attainable through crop mon-
itoring systems able to reach a single plant. Precision agriculture employ continuous and pervasive monitoring
of crops, that in turn allows fast and targeted interventions. The aim of this paper is to highlight the problems
that can be found in designing a wireless sensor network (WSN) able to measure environmental parameters
such as relative humidity, irradiance and volatile pollutant concentration and introduces a possible solution
that we named the Internet of Trees.
1 INTRODUCTION
To optimise production and reduce waste of re-
sources, a detailed knowledge of the health state of
the crop, soil, water and nutrient reservoir needs to be
built (Ehlers and Goss, 2016). Up to now, such infor-
mation has been extrapolated by airborne LiDAR or
by processing satellite images. Both techniques have
high costs and suffer from low resolution (Estornell
et al., 2014; Cunha et al., 2015); moreover, even if
these approaches allow to evaluate the state of health
of the crop, they have poorly results on early detec-
tion of plant disease (Zhang et al., 2019). On the other
hand, the Volatile Organic Compounds (VOCs) have
been demonstrated to be early markers of the state of
health of the plant (Martinelli et al., 2015).
To this purpose, several techniques such as gas
chromatography mass spectrometry (GC-MS) or elec-
tronic noses have been used to detect and estimate
volatile compounds in crops (Martinelli et al., 2015).
Nevertheless, these techniques have been used to es-
timate gas concentrations in single points within the
crop that cannot supply any information on the state
of the whole farm. To this purpose, we will inves-
tigate how to design a wireless sensor network en-
dowed with a customised set of sensors able to detect
volatile pollutants and the relevant VOCs, and a tool
a
https://orcid.org/0000-0002-0981-3409
b
https://orcid.org/0000-0002-6332-5051
∗
Both authors contributed equally to this manuscript
for data collection, processing and visualisation, able
to extrapolate detailed maps of the crop health.
The parameters measured by each node provide
information on the status of the crop with a detail
that depends only on the number of nodes composing
the network, and that can reach even a single plant.
In addition to local information, trends and dynam-
ics across fields can be obtained in post-processing
and this derived information can be useful to organ-
ise farming interventions. With the aim of highlight-
ing the different information that can be extrapolated
by the WSN, an appropriate system of data collec-
tion, processing and visualisation needs to be im-
plemented. In the implementation of a such perva-
sive network two main problems arise: (i) Long time
working time of the single node, i.e. low energy con-
sumption and energy harvesting. (ii) Network recon-
figuration in case of node failure, and easy access to
single node information.
In this paper, we will introduce a WSN to monitor
the environmental parameters of the crop and a web
based platform for data collection, processing and vi-
sualisation. In particular, we will clarify which are
the main characteristics that a WSN for precise agri-
culture should have and how can be obtained thanks
to an integrated design of the hardware and software.
Our user target is initially the agronomy commu-
nity, with the goal to expand it to the farmer commu-
nity when the system will be more widespread.
In the following sections, we will describe our
182
Checco, A. and Polese, D.
Internet of Trees: A Vision for Advanced Monitoring of Crops.
DOI: 10.5220/0009368801820186
In Proceedings of the 9th International Conference on Sensor Networks (SENSORNETS 2020), pages 182-186
ISBN: 978-989-758-403-9; ISSN: 2184-4380
Copyright
c
2022 by SCITEPRESS – Science and Technology Publications, Lda. All rights reserved
idea of the hardware and network architecture, and
the features that they should have to fulfill our require-
ments to guarantee adequate monitoring performance.
At the end of every section we will present some im-
plementation examples.
Related Work
In the last years, precision agriculture has been identi-
fied as a promising research field to improve the mon-
itoring and managements of crops.
While few studies propose crop automation so-
lutions (e.g. automated ventilation in (Stipanicev
and Marasovic, 2003) or irrigation as in (Sahu and
Mazumdar, 2012)), the majority of them focus on
crop monitoring, using mainly humidity, light and
temperature sensors (Fisher and Kebede, 2010; Dan
et al., 2015; Patil and Kale, 2016; de Lima et al.,
2010; Yoo et al., 2007; Jiber et al., 2011).
We refer to the extensive review papers in preci-
sion agriculture for more information on the state of
this research field (Liaghat et al., 2010; Brisco et al.,
1998; Ge et al., 2011; Jawad et al., 2017).
Novelty
While the use of WSNs for monitoring, management
and prediction purposes is not new, to the best of our
knowledge no previous work addressed the goal of
integrating chemical sensors in the network nodes for
precise agriculture. Such an ambitious goal would al-
low to understand the disease diffusion process, their
correlation with other environmental parameters, and
to build more accurate disease prevention models.
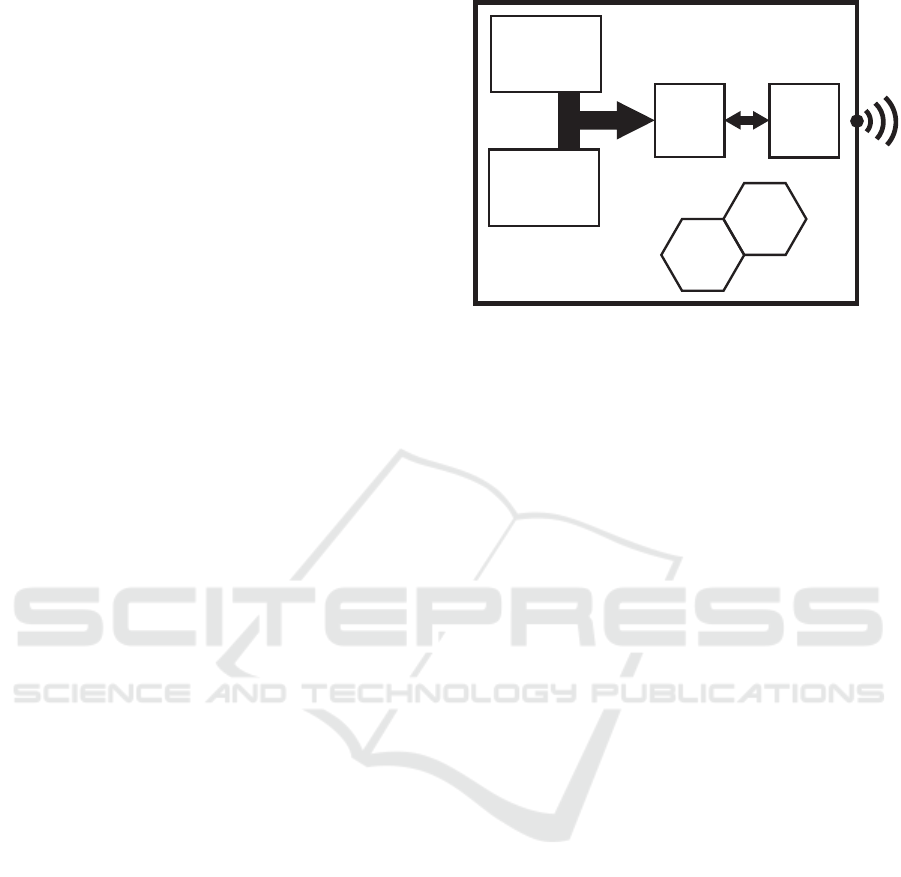
2 HARDWARE ARCHITECTURE
The hardware part of the network, i.e the nodes, have
to fulfill several main tasks: (i) Acquire the sensor
data. (ii) Communicate the sensor data. (iii) Harvest
energy. (iv) Minimize the energy consumption. In
Figure 1, a schematic representation of a possible ar-
chitecture of a WSN node satisfying the aforemen-
tioned constraints is shown. The node is based on
a micro-controller (µC) and at least a wireless inter-
face. The µC is assisted by a Battery Management
(BM) and a Maximum Power Point Tracking (MPPT)
circuit, for the power management, finally electronic
interfaces are required for the physical and chemical
sensors.
With more details, the micro-controller perform
the data reading from the sensors, manage the energy
harvesting and the power consumption and elaborate
Chemical
gas sensor
Physical
Sensor
mC
RF interface
BM
MPPT
Figure 1: Schematic representation of the sensor node ar-
chitecture. In particular three main parts are highlighted:
the battery management (BM) and the Maximum Power
Point Tracking (MPPT) circuits; the Microcontroller (µC),
the Radio Frequency (RF) interface; the physical sensors
(Light intensity and Temperature) and the chemical sensors
(Relative Humidity, VOC sensors).
the data to send to the RF interface. The RF inter-
face should supports different protocol, in order to
allow the communication in long range (LoRa), but
sometimes a single node short range communication
could be useful to download single node information,
perform node debug, or simply for updating the node
GPS position during the installation procedures.
The MPPT and BM circuits have the role of opti-
mizing the power transfer from a photovoltaic panel
towards the battery, preserving the battery function-
ality and energy in order to guarantee a continuous
functioning of the nodes in the long period without
maintenance. The solar energy appears as an obvi-
ous source of energy since these nodes will be placed
onto the tree in a crop, nevertheless the foliage could
sometime darken the panel.
3 SENSORS
Light, water and CO
2
are the three main components
that sustain the plant life (Ehlers and Goss, 2016), any
lack of these three components have an effect on the
state of health of the plant, at the same time, light and
temperature have effect on the fruit maturation (Uzun,
2007), VOCs are markers of state of health of the
plant (Martinelli et al., 2015), and the levels of plant
bioregulator (Rademacher, 2015) have effect on the
flowering, fruit formation, ripening, fruit drop, defo-
liation, etc.
In order to extract the information about the state
of health of the plants and if they are suffering a lack
of water or nutrients, several sensors have to be inte-
Internet of Trees: A Vision for Advanced Monitoring of Crops
183
grate into the sensor nodes. Fundamentally, three kind
of sensors should be integrated: (i) Physical sensors to
measure temperature and radiance, (ii) Chemical sen-
sors to estimate VOCs, gases and vapors, (iii) Elec-
tro-chemical sensors to evaluate the levels of bio-reg-
ulators.
Physical sensors enable to know the surrounding
condition of the crop environment. Light intensity
and temperature are the main physical quantity that
should be measured since they are correlated with
several plant conditions and fruit maturation. Com-
mercial available physical sensors reach level of per-
formance that satisfies the need of the application.
Different consideration have to be done for chemi-
cal gas sensors and electro-chemical sensors. Chemi-
cal gas sensors have to perform two different tasks:
(i) quantify gas, vapors and VOCs, (ii) discrimi-
nate the different VOCs; these tasks require differ-
ent sensor approaches. In volatile quantification,
selective sensors are more appropriate, whereas, in
volatile discrimination an approach based on elec-
tronic nose (Gardner and Bartlett, 1994) is more ef-
ficient. In both cases, the research in low power, ad-
justable selectivity, and stability are still going for-
ward. Among the different kind of chemical sensors,
polymeric based (Bai and Shi, 2007) and metal ox-
ides (Polese et al., 2017; Polese et al., 2015; Zhu and
Zeng, 2017; Sun et al., 2012) show interesting char-
acteristics.
On the other hand, electro-chemical sensors need
to be functionalised to detect the appropriate bio-
regulator, this generally needs the interaction with
chemist or biologist to optimize their structures. Ex-
amples of this kind of sensors can be find else-
where (Khater et al., 2017; Maiolo et al., 2016).
4 NETWORK ARCHITECTURE
WSNs for precise agriculture need to cover large cul-
tivated area, work for long time without maintenance,
and to be re-configurable under node failure or node
integration. We found that the Thread network pro-
tocol (https://www.threadgroup.org), and in particu-
lar OpenThread, the Google open-source implemen-
tation of it (https://openthread.io/) satisfy these re-
quirements ant it has be chosen in order to have a
re-configurable network that can easily prevent node
failures and work under stringent energy constraints.
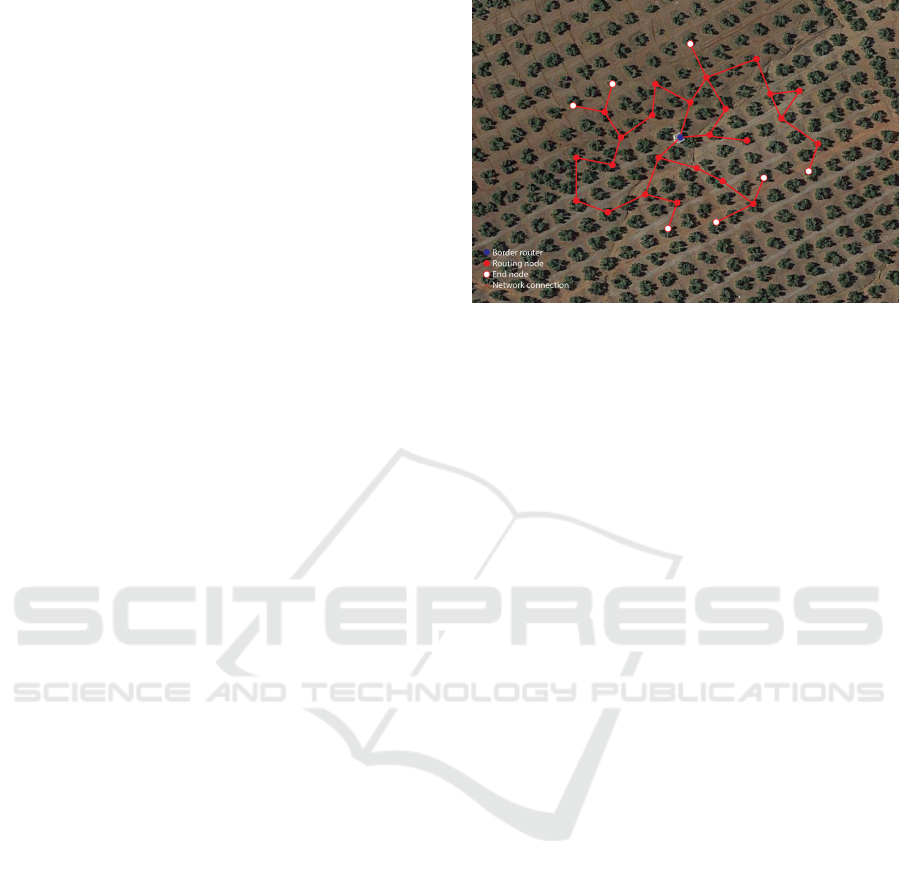
A traditional Wireless multi-hop structure will be
employed, with a small number of border routers con-
nected to the Internet, and a dense network of nodes
equipped as described in the previous section. This
solution is adequate for crops that need to accommo-
Figure 2: Example of WSN structure in olive orchard. In
the figure, the different roles carried out from the nodes are
highlighted.
date hundreds of nodes and a limited (less than 32)
number of routers. For bigger crops, a solution based
on Contiki and RPL ( IPv6 Routing Protocol for Low-
Power and Lossy Networks) might be more appropri-
ate (Ellmer, 2017).
We will develop adaptive algorithms to dynami-
cally adapt the sensor report frequency depending on
the energy requirements and the measurement vari-
ability in that space and time frame.
Location Mapping
After the installation phase, a GPS equipped de-
vice can map the position of the sensors, using a
combination of anchoring during the pairing pro-
cess and RSSIs-based multilateration for error correc-
tion (Hightower and Borriello, 2001).
5 DATA VISUALIZATION
DASHBOARD
To build a dashboard, we will investigate the use of
Google Data Studio (Snipes, 2018), as well as open-
source solutions like chartist.js (Kunz, 2014) or can-
dela, using the Resonant data and analytics platform.
We aim at following the state-of-the-art of dashboard
design best practices (Elias and Bezerianos, 2011).
The main interface of the dashboard will show a
map of the crop, with an estimation of the health of
the crop. By clicking on a region in the map, an his-
toric trace of the health of that area will be shown.
The health parameter of an area is not the raw
sensor data, but rather a time and spatial interpolated
summary of the neighbouring nodes status, consider-
ing each sensor thresholds in an adequate time win-
WSN4PA 2020 - Special Session on Wireless Sensor Networks for Precise Agriculture
184
dow. This is obtained using health rules, that are a set
of conditions an area is supposed to satisfy. Health
rules can be time-dependent (e.g. different during the
night), and be as simple as independent thresholds for
each sensor, but also encompass complex joint rules
(e.g. humidity thresholds can depend on luminance
values). Health parameters (low and high threshold,
time and spatial tolerance) for each sensor can be
manually set in a configuration section of the dash-
board, or downloaded from an online database.
The user will be also be able to visualise the raw
measurements from the sensors in this section of the
dashboard. Advances health rules warning can be set
up using modeling and predictive tools, as explained
in the next section.
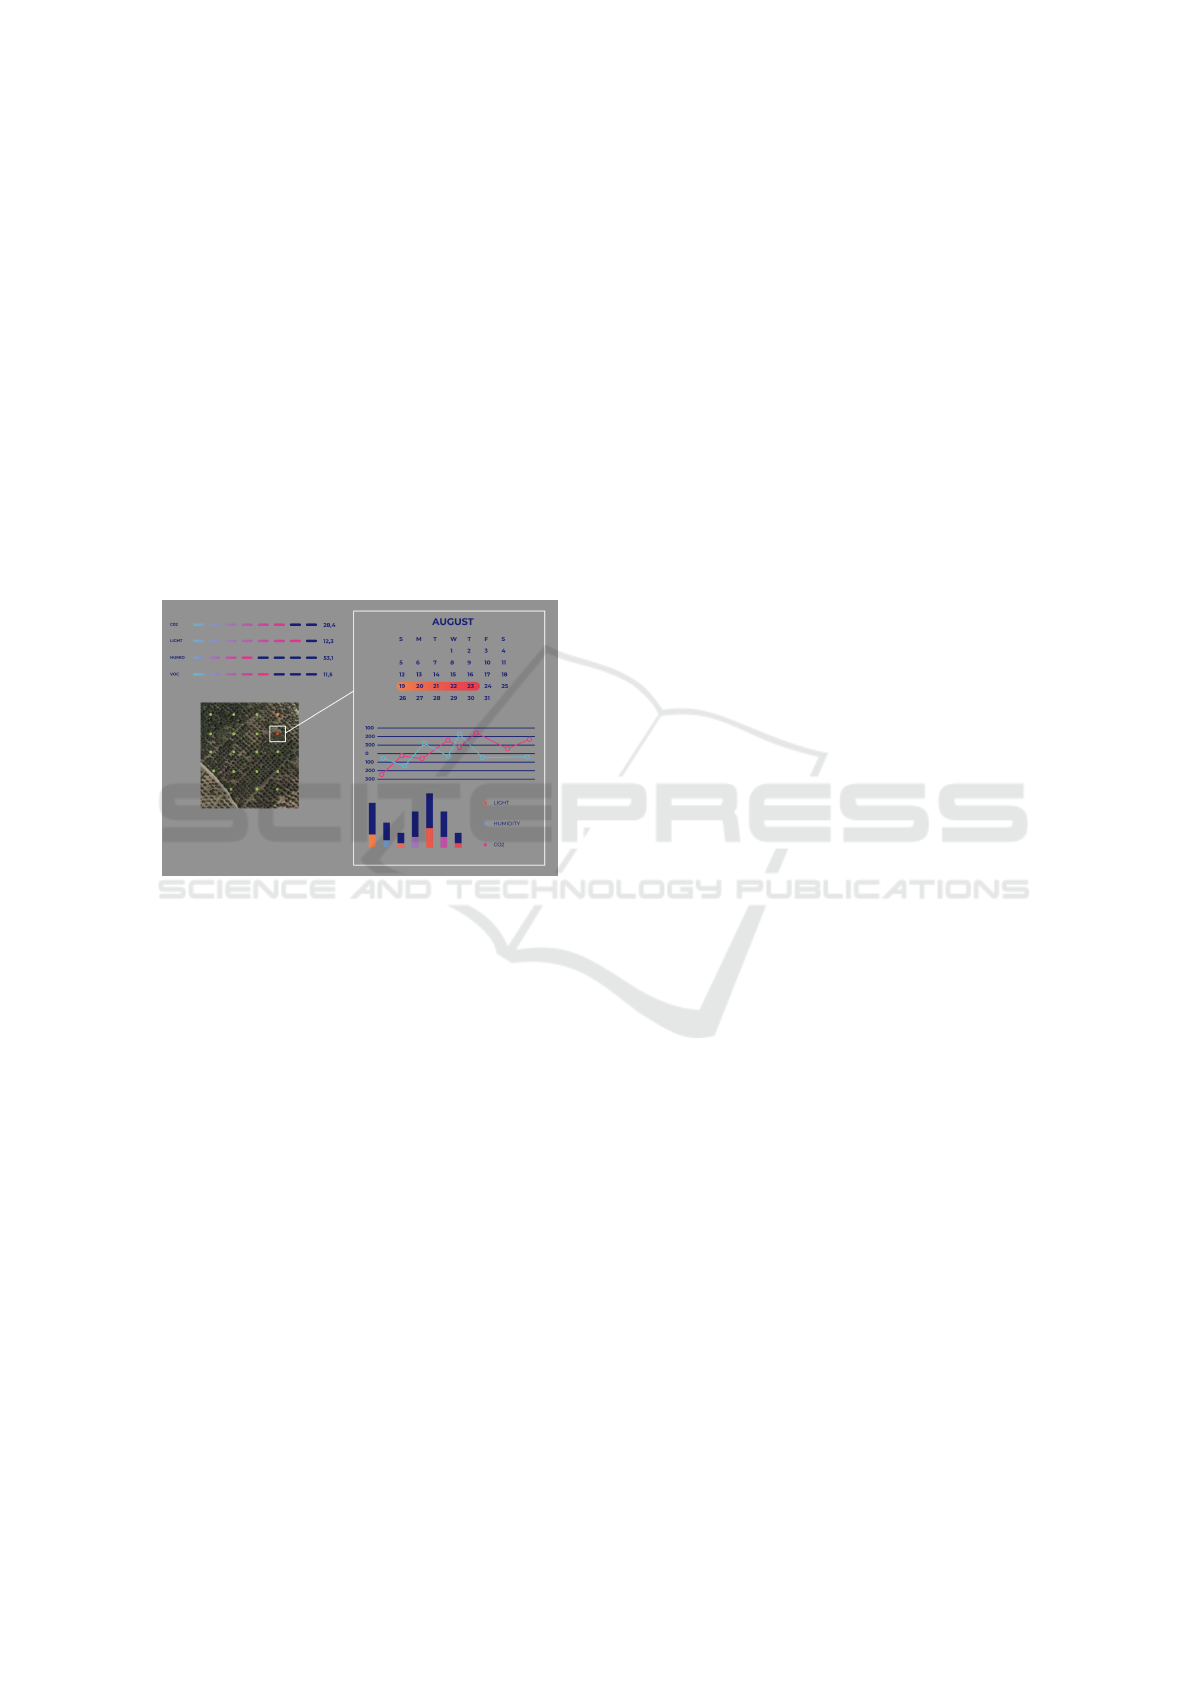
An example of a dashboard for an olive orchard is
shown in Figure 3.
Figure 3: Example of data visualization dashboard for an
olive orchard, (design elements from freepik.com).
6 MODELING AND PREDICTIVE
TOOLS
We aim to build a database of health parameters and
health warning rules, that depend on the geographic
position of the crop and the type of cultivar. This will
be obtained with an extensive analysis of the litera-
ture in the agriculture field. Moreover, farmers will
be able to contribute to this database by inputting their
configurations and their rules: the challenge here is to
convert the farmer experience to algorithmic rules, to
be able of learning from the agronomy community.
A challenging goal of this project is to be able
to assist the planning of crop irrigation, fertilization
and treatment: we aim to build health models able to
early pinpoint the need of an intervention in an area,
reducing the size of the area treated and potentially
reducing the effect of the issue because of the model
predictive abilities (e.g. for olive orchard (Testi et al.,
2006; Moriana et al., 2003)).
7 CONCLUSIONS
In this paper, we introduced the main challenges that
arise when designing a Wireless Sensor Networks for
monitoring the health of a crop. In particular, we have
identified the most important physicals and chemicals
features that should be monitored to assess the health
of a crop and potentially predict future issues. We dis-
cussed which characteristics a network node should
have and the network protocols that should support.
Moreover, the use of an appropriate dashboard for
the data visualization can help the user to understand
the evolution of the state of health of the crop, and
provide them with a tool to investigate how to opti-
mize irrigation, fertilisation and the phytosanitary in-
terventions in order to maximize the production and
minimize the environmental side-effects. In the fu-
ture, these approaches could also be directly used by
farmers to improve agriculture worldwide.
REFERENCES
Bai, H. and Shi, G. (2007). Gas Sensors Based on Conduct-
ing Polymers. Sensors, 7(3):267–307.
Brisco, B., Brown, R., Hirose, T., McNairn, H., and Staenz,
K. (1998). Precision agriculture and the role of re-
mote sensing: a review. Canadian Journal of Remote
Sensing, 24(3):315–327.
Cunha, A., Alval
´
a, R. C., Nobre, C. A., and Carvalho, M. A.
(2015). Monitoring vegetative drought dynamics in
the brazilian semiarid region. Agricultural and Forest
Meteorology, 214:494–505.
Dan, L., Xin, C., Chongwei, H., and Liangliang, J. (2015).
Intelligent agriculture greenhouse environment mon-
itoring system based on iot technology. In 2015 In-
ternational Conference on Intelligent Transportation,
Big Data and Smart City, pages 487–490. IEEE.
de Lima, G. H., e Silva, L. C., and Neto, P. F. (2010). Wsn
as a tool for supporting agriculture in the precision ir-
rigation. In 2010 Sixth International Conference on
Networking and Services, pages 137–142. IEEE.
Ehlers, W. and Goss, M. (2016). Water dynamics in plant
production. CABI.
Elias, M. and Bezerianos, A. (2011). Exploration views:
understanding dashboard creation and customiza-
tion for visualization novices. In IFIP Conference
on Human-Computer Interaction, pages 274–291.
Springer.
Ellmer, C. (2017). Openthread vs. contiki ipv6: An experi-
mental evaluation.
Estornell, J., Vel
´
azquez-Mart
´
ı, B., L
´
opez-Cort
´
es, I.,
Salazar, D., and Fern
´
andez-Sarr
´
ıa, A. (2014). Esti-
mation of wood volume and height of olive tree plan-
tations using airborne discrete-return lidar data. GI-
Science & remote sensing, 51(1):17–29.
Internet of Trees: A Vision for Advanced Monitoring of Crops
185

Fisher, D. K. and Kebede, H. (2010). A low-cost
microcontroller-based system to monitor crop temper-
ature and water status. Computers and Electronics in
Agriculture, 74(1):168–173.
Gardner, J. W. and Bartlett, P. N. (1994). A brief history of
electronic noses. Sensors and Actuators B: Chemical,
18(1-3):210–211.
Ge, Y., Thomasson, J. A., and Sui, R. (2011). Remote sens-
ing of soil properties in precision agriculture: A re-
view. Frontiers of Earth Science, 5(3):229–238.
Hightower, J. and Borriello, G. (2001). Location systems
for ubiquitous computing. Computer, (8):57–66.
Jawad, H. M., Nordin, R., Gharghan, S. K., Jawad, A. M.,
and Ismail, M. (2017). Energy-efficient wireless sen-
sor networks for precision agriculture: A review. Sen-
sors, 17(8):1781.
Jiber, Y., Harroud, H., and Karmouch, A. (2011). Pre-
cision agriculture monitoring framework based on
wsn. In 2011 7th International Wireless Communica-
tions and Mobile Computing Conference, pages 2015–
2020. IEEE.
Khater, M., de la Escosura-Mu
˜
niz, A., and Merkoc¸i, A.
(2017). Biosensors for plant pathogen detection.
Biosensors and Bioelectronics, 93:72–86.
Kunz, G. (2014). Chartist.js, an open-source library for re-
sponsive charts. Published on: Dec, 16.
Liaghat, S., Balasundram, S. K., et al. (2010). A review:
The role of remote sensing in precision agriculture.
American journal of agricultural and biological sci-
ences, 5(1):50–55.
Maiolo, L., Polese, D., Pecora, A., Fortunato, G., Shacham-
Diamand, Y., and Convertino, A. (2016). Highly dis-
ordered array of silicon nanowires: an effective and
scalable approach for performing and flexible electro-
chemical biosensors. Advanced healthcare materials,
5(5):575–583.
Martinelli, F., Scalenghe, R., Davino, S., Panno, S., Scud-
eri, G., Ruisi, P., Villa, P., Stroppiana, D., Boschetti,
M., Goulart, L. R., et al. (2015). Advanced methods of
plant disease detection. a review. Agronomy for Sus-
tainable Development, 35(1):1–25.
Moriana, A., Orgaz, F., Pastor, M., and Fereres, E. (2003).
Yield responses of a mature olive orchard to water
deficits. Journal of the American Society for Horti-
cultural Science, 128(3):425–431.
Patil, K. and Kale, N. (2016). A model for smart agriculture
using iot. In 2016 International Conference on Global
Trends in Signal Processing, Information Computing
and Communication (ICGTSPICC), pages 543–545.
IEEE.
Polese, D., Mattoccia, A., Giorgi, F., Pazzini, L., Di Gi-
amberardino, L., Fortunato, G., and Medaglia, P.
(2017). A phenomenological investigation on chlorine
intercalated layered double hydroxides used as room
temperature gas sensors. Journal of Alloys and Com-
pounds, 692:915–922.
Polese, D., Mattoccia, A., Giorgi, F., Pazzini, L., Ferrone,
A., Di Giamberardino, L., Maiolo, L., Pecora, A.,
Convertino, A., Fortunato, G., et al. (2015). Layered
double hydroxides intercalated with chlorine used as
low temperature gas sensors. Procedia engineering,
120:1175–1178.
Rademacher, W. (2015). Plant growth regulators: back-
grounds and uses in plant production. Journal of plant
growth regulation, 34(4):845–872.
Sahu, K. and Mazumdar, S. G. (2012). Digitally green-
house monitoring and controlling of system based on
embedded system. International Journal of Scientific
& Engineering Research, 3(1):1–3.
Snipes, G. (2018). Google data studio. Journal of Librari-
anship and Scholarly Communication, 6(1).
Stipanicev, D. and Marasovic, J. (2003). Networked embed-
ded greenhouse monitoring and control. In Proceed-
ings of 2003 IEEE Conference on Control Applica-
tions, 2003. CCA 2003., volume 2, pages 1350–1355.
IEEE.
Sun, Y.-F., Liu, S.-B., Meng, F.-L., Liu, J.-Y., Jin, Z., Kong,
L.-T., and Liu, J.-H. (2012). Metal Oxide Nanostruc-
tures and Their Gas Sensing Properties: A Review.
Sensors, 12(3):2610–2631.
Testi, L., Villalobos, F., Orgaz, F., and Fereres, E. (2006).
Water requirements of olive orchards: I simulation of
daily evapotranspiration for scenario analysis. Irriga-
tion Science, 24(2):69–76.
Uzun, S. (2007). Effect of light and temperature on the
phenology and maturation of the fruit of eggplant
(solanum melongena) grown in greenhouses. New
Zealand journal of crop and horticultural science,
35(1):51–59.
Yoo, S.-e., Kim, J.-e., Kim, T., Ahn, S., Sung, J., and Kim,
D. (2007). A 2 s: automated agriculture system based
on wsn. In 2007 IEEE International Symposium on
Consumer Electronics, pages 1–5. IEEE.
Zhang, J., Huang, Y., Pu, R., Gonzalez-Moreno, P., Yuan,
L., Wu, K., and Huang, W. (2019). Monitoring plant
diseases and pests through remote sensing technology:
A review. Computers and Electronics in Agriculture,
165:104943.
Zhu, L. and Zeng, W. (2017). Room-temperature gas sens-
ing of zno-based gas sensor: A review. Sensors and
Actuators A: Physical, 267:242–261.
WSN4PA 2020 - Special Session on Wireless Sensor Networks for Precise Agriculture
186
