
To Inspect or to Test? What Approach Provides Better Results When
It Comes to Usability and UX?
Walter T. Nakamura
1
, Leonardo C. Marques
1
, Bruna Ferreira
2
, Simone D. J. Barbosa
2
and Tayana Conte
1
1
Institute of Computing (IComp), Federal University of Amazonas, UFAM, Manaus, Brazil
2
Informatics Department, Pontifical Catholic University of Rio de Janeiro, PUC-Rio, Rio de Janeiro, Brazil
Keywords: Usability, User eXperience, Usability Inspection, Usability Test, Evaluation Methods.
Abstract: Companies are constantly striving to improve their products for satisfying customers. Evaluating the quality
of these products concerning usability and User eXperience (UX) has become essential for obtaining an
advantage over competing products. However, several evaluation methods exist, making it difficult to decide
which to choose. This paper presents a comparison between usability inspection and testing methods and a
UX evaluation. We investigated the extent to which each method allows identifying usability problems with
efficiency and effectiveness. We also investigated whether there is a difference in UX ratings between
inspectors and users. To do so, we evaluated a Web platform designed for a government traffic department.
Inspectors used TUXEL to evaluate the usability and UX of the platform, while usability testing moderators
employed Concurrent Think-Aloud and User Experience Questionnaire with users. The inspection method
outperformed usability testing regarding effectiveness and efficiency while addressing most major problems
that occurred in usability testing, even when considering only the results from novice inspectors. Finally, the
UX evaluation revealed contrasting results. While inspectors evaluated the platform as neutral, reflecting the
problems they identified, users, by contrast, rated it very positively, in contradiction to the problems they had
during the interaction.
1 INTRODUCTION
For many years, effective and efficient goal
achievement was the prime objective of Human-
Computer Interaction (HCI) (Hassenzahl, 2018),
making usability one of the main concerns when
designing a product. Although it is necessary, “even
the best usability may never be able to put a smile on
users’ faces” (Hassenzahl et al., 2006), but User
eXperience (UX), “when desirable, can do so” (Law
et al., 2007). The concept of usability is more narrow,
task-oriented, focusing primarily on user cognition
and performance (Law et al., 2009). By contrast, UX
is more holistic, considering not only pragmatic
aspects (task-oriented) but also augmenting
subjective aspects, such as affect, sensations,
emotions and value of user’s interaction in everyday
life, thus subsuming usability (Law et al., 2009). In
this context, practitioners and researchers from
academia have been looking for new approaches to
the design of interactive products, aiming to
accommodate not only product qualities but also
experiential qualities of technology use (Hassenzahl
et al., 2010). In a scenario of fierce competition,
understanding how technology can be used to
promote unique, satisfying, and enlightening
experiences seems to provide a competitive
advantage for business and industry (Alves et al.,
2014), leading practitioners and researchers to debate
on how to design products capable of providing
positive UX (Ardito et al., 2014). In this context,
usability and UX evaluation has become an important
activity to assess the quality of the products being
developed, aiming to identify improvement
opportunities and meet consumers’ expectations.
Despite the importance of usability and UX
evaluation and its increasing adoption in the industry,
many software development companies are still
neglecting these two quality in use attributes due to
different reasons, such as the lack of suitable methods
(Ardito et al., 2014), resource demands (Alves et al.,
2014), and lack of trained personnel (Teka et al.,
2017). Moreover, the existence of different
evaluation methods might make it difficult for
Nakamura, W., Marques, L., Ferreira, B., Barbosa, S. and Conte, T.
To Inspect or to Test? What Approach Provides Better Results When It Comes to Usability and UX?.
DOI: 10.5220/0009367904870498
In Proceedings of the 22nd International Conference on Enterprise Information Systems (ICEIS 2020) - Volume 2, pages 487-498
ISBN: 978-989-758-423-7
Copyright
c
2020 by SCITEPRESS – Science and Technology Publications, Lda. All rights reserved
487

practitioners to identify which are more efficient or
more adequate to a company’s needs (Nakamura et
al., 2019). As distinct methods allow identifying
different sets of problems (Law & Hvannberg, 2002;
Maguire & Isherwood, 2018) and require different
expertise, resources, and user availability,
comparative studies may help practitioners to identify
which method meets a company’s needs.
This paper presents a comparative study between
two of the most employed types of usability
evaluation methods: inspection and testing. We
carried out the study in a software development
company to evaluate a Web platform designed for a
government traffic department, for a population of a
state with over 4 million inhabitants. Our goal is to
verify the extent to which each method allows
identifying usability problems with efficiency and
effectiveness while providing a good level of
coverage of most severe problems. This type of
research has been extensively carried out in the 90s.
However, due to continuous changes in technology
and interaction over time, further comparative studies
should be carried out to investigate whether previous
findings still apply (Maguire & Isherwood, 2018).
Moreover, the shift to the experiential highlight the
need for broad research that considers not only
traditional usability but also investigate whether and
how its results relate to UX. In this sense, we also
carried out a UX evaluation study with both
inspectors and users to get subjective feedback about
the experience conveyed by the platform. We aimed
to investigate whether there is a difference between
the inspectors’ and users’ perceptions. The results of
this study provide empirical evidence on the benefits
and drawbacks of the methods employed and their
cost-benefit assessment, helping practitioners to
select those that best meet their needs.
2 RELATED WORK
The comparison of evaluation methods is a concern
of several years, dated back to the 90s, when
researchers started to investigate the cost-benefit ratio
of the methods in an attempt to bring down the cost
and time requirements of traditional usability testing
(Hartson et al., 2003). In this section we summarize
some of these works.
Jeffries et al. (1991) compared four Usability
Evaluation Methods (UEMs): Heuristic Evaluation
(HE), Usability Testing (UT), Guidelines, and
Cognitive Walkthrough (CW). They evaluated the
methods through the number of problems found,
problem severity, and cost-benefit ratios (problems
found per person-hour). The results indicated that HE
produced the best results, finding more problems,
including more of the most serious ones, and at the
lowest cost. By contrast, it found a large number of
specific, one-time, and low-priority problems. UT
was second, finding recurring and general problems
while avoiding low-priority problems. However, it
was also the most expensive of the four methods.
Desurvire et al. (1992) compared three methods:
HE, CW, and UT. Rather than comparing the number
of problems found by each method as Jeffries et al.
(1991) did, they aimed to investigate whether HE and
CW find problems that users face in UT, according to
the evaluators’ level of expertise. The results
indicated that HE and CW found 44% and 28% of the
problems, respectively, when employed by experts.
By contrast, when employed by system designers and
non-experts, the percentage of problems found
dropped to 16% and 8%, respectively.
Although this is not a new topic, to this day,
researchers keep carrying out comparative studies to
evaluate new methods or to employ the existing ones
in different domains or types of products. As websites
and interaction continually change over time, it is
important to carry out further studies to verify
whether previous findings still apply (Maguire &
Isherwood, 2018). Hasan et al. (2012), for example,
evaluated the usability of three e-commerce Websites
by employing ordinary UT and a specific HE method
they developed for this context. To compare the
methods, the authors considered the number of
problems identified and their severity level. The
results indicated that HE found a great number of
problems, most of them minor ones. By contrast, UT
found fewer problems, but more major ones.
More recently, Maguire and Isherwood (2018)
compared two UEMs: UT and HE. The HE group
comprised 16 participants with experience in
usability evaluation, acting as expert inspectors,
while 16 regular computer users without usability
knowledge acted as users in usability testing. They
compared both methods regarding effectiveness and
efficiency by using four metrics: number of problems
identified, problem severity, type of problem
according to Nielsen’s ten heuristics (1994), and time
spent to find these problems. Overall, HE was more
effective, finding almost five times more individual
problems than UT. By contrast, UT identified slightly
more severe problems and required less time to
complete than HE, excluding the analysis time.
Although recent studies comparing inspection and
testing methods do exist, most of them do not use a
standardized set of usability metrics for analyzing the
data as proposed by Hartson et al. (2003), making it
ICEIS 2020 - 22nd International Conference on Enterprise Information Systems
488

difficult to compare the results from previous studies
directly. Moreover, they have only compared the
results based on the overall number of problems, not
measuring the effectiveness of HE in identifying
problems found during actual user interaction.
Finally, these studies have not evaluated the UX to
complement the findings from usability evaluations
and provide a broader view of the product evaluated.
In this paper, we compared two UEMs (inspection
and testing) in a software development company by
evaluating a Web platform designed for a government
traffic department. To have a more holistic view of
the methods evaluated, we employed both novices
and expert inspectors and used metrics such as
effectiveness and efficiency to compare them. We
also calculated three standard usability metrics
proposed by Hartson et al. (2003) and used by
Hvannberg et al. (2007) to evaluate the extent to
which an inspection method predicts problems that
actual users face during UT: thoroughness, validity,
and effectiveness. Finally, we carried out a UX
evaluation to obtain subjective data about the
platform under evaluation and to investigate whether
there is a difference between the inspectors’ and
users’ perceptions of their experiences.
3 METHODOLOGY
3.1 Participants and Materials
We evaluated a Web platform under development by
a software development company for a government
traffic department. It offers functionalities such as
service scheduling and information about driver’s
licenses and vehicle fines. The stakeholders aimed to
evaluate the usability of this platform before its public
release to deliver a high-quality product for the target
audience. The study involved 20 participants, 10 for
each evaluation method. According to (Hwang &
Salvendy, 2010), a general 10±2 rule of thumb for
optimal sample size in usability evaluations may
detect 80% of usability problems.
The inspection group comprised 10 Computer
Science students (six men and four women between
20 and 38 years old) from the Federal University of
Amazonas (UFAM), all licensed drivers. Five
inspectors had low experience with usability
evaluations, i.e., they had learned about it in the
classroom and did some exercises, which makes them
comparable to typical novice practitioners
(Fernandez et al., 2013). The other five had high
1
https://www.atube.me
experience, i.e., they had already carried out this type
of evaluation at least once in the industry in the last
six months. All inspectors used Web platforms
frequently, but they did not know the application
domain, nor the platform under development.
Ten company employees participated in UTs as
users (four men and six women, between 25 and 52
years old), all licensed drivers and from different
departments unrelated to software development. We
chose company employees to avoid confidentiality
issues, as it is a common practice by professionals in
usability studies and required by the stakeholders.
We selected those without too much experience with
technology to allow identifying the most common
problems that end-users may face while using the
platform. Two participants had very low experience
with computers, i.e., they knew how to use the
computer but rarely used it. Seven participants had
low experience with computers, i.e., they knew how
to use the computer and used it occasionally. One
participant had medium experience with computers,
i.e., they knew how to use the computer and used it
regularly. None of them knew about the development
of the platform, nor had used it before.
We used the following materials in this study: (i)
an informed consent form, explaining the study and
the subjects’ voluntariness and confidentiality of their
identities; (ii) a characterization questionnaire; (iii) a
script with the set of tasks; (iv) a screen capture tool
1
for recording participants’ interactions; and (v)
computers and notebooks.
3.2 Evaluation Methods
For inspection, we employed a method developed by
one of the authors of this paper, called TUXEL
(Technique for User eXperience Evaluation in e-
Learning). Originally designed to evaluate e-learning
platforms, it comprises three main dimensions:
general usability, pedagogical usability, and UX.
Previous studies indicated that TUXEL identifies
more problems in less time than an adapted HE based
on Nielsen’s ten traditional heuristics with additional
criteria for evaluating didactic effectiveness
(Nakamura et al., 2018). We aimed to investigate
whether TUXEL can be applied to evaluate other
types of software products and how well it performs
in comparison to other general evaluation methods.
Given that the evaluated platform is not for learning
purposes, we removed the pedagogical usability
dimension, as it is specific to evaluate e-learning
To Inspect or to Test? What Approach Provides Better Results When It Comes to Usability and UX?
489

aspects, such as collaborative learning and
instructional assessment.
TUXEL employs a guided inspection approach so
that either experts or non-experts can apply it. It
provides a set of items similar to heuristics, but at a
fine-grained level, in addition to tips that guide the
inspector through examples or actions that they
should perform to identify the problem. TUXEL also
provides a tool to facilitate both evaluation and
analysis process, especially for consolidating
usability defects. According to Hornbæk (2010),
matching similar descriptions from different
inspectors is not straightforward, given that usability
reports usually contain brief and context-free
descriptions. As a result, researchers can err when
extracting or merging actual discrepancies to produce
a single set of problems, corrupting problem counts
and biasing the study (Cockton et al., 2004). The
TUXEL tool (a Google Chrome extension) minimizes
this issue through its screenshot and markup feature.
By visualizing the screenshot tagged with the selected
item, together with the description provided by the
inspector, the researcher can easily identify where
and what the problem reported is.
First, the inspector performs the tasks while
evaluating the usability of the platform by checking
the items from TUXEL and selecting an adequate one
according to the problem identified. Next, the
inspector marks the area where the problem occurs
and provides additional information about it. The tool
then captures a screenshot with the selected area and
the item identifier associated with it by TUXEL.
Then, the inspector evaluates the overall usability of
the platform through a checklist comprising items
related to ease of use and help and documentation. In
this step, the inspector can provide details about the
items they checked. Finally, the inspector fills a UX
questionnaire comprising 7-point semantic
differential scales using adjectives extracted from the
User Experience Questionnaire (UEQ) (Laugwitz et
al., 2008) to evaluate six UX dimensions: Attractive-
ness, Perspicuity, Efficiency, Dependability, Stimu-
lation, and Novelty. The inspector evaluates their
experience with the evaluated platform by marking
the point that is closest to the adjective that better
describes the UX conveyed by the platform. The
questionnaire also has two open-ended questions
where the inspector can make criticisms based on
their ratings and provide improvement suggestions.
Finally, the tool generates a report with the inspection
time, the problems reported with their corresponding
items, and the URL where each problem occurred.
For UT, we looked for methods that: (i) are easy
to apply; (ii) do not require additional equipment
(e.g., eye-tracking devices); (iii) are not much time
consuming; (iv) requires no more than one observer
per participant; and (v) provides real-time
information without obstructing the participant’s
interaction with the platform. Considering these
criteria, we selected Concurrent Think-Aloud (CTA).
According to Alhadreti & Mayhew (2018), CTA is
one of the most widely used UT methods and allows
the detection of a high number of problems with less
time than its retrospective and hybrid versions. CTA
is a variation of the Think-Aloud method that
provides “real-time” information during the
participant’s interaction with a system (Alhadreti &
Mayhew, 2018). The participant performs tasks as
they verbalize their thoughts while being observed by
a moderator that takes notes about their interaction in
a problem reporting form. The moderator can identify
the problems through three approaches (Van den
Haak et al., 2004): i) observation (i.e., from observed
evidence without verbal data); ii) verbalization (i.e.,
from verbal data without accompanying behavioral
evidence); and iii) a combination of observation and
verbalization. We also considered using
Retrospective Think-Aloud (RTA) in order to not
interfere with the participant’s thought process.
However, given that RTA requires double the time of
CTA, and that CTA outperformed both RTA and the
Hybrid Method (HB) (Alhadreti & Mayhew, 2018),
we decided to use CTA. Finally, given that CTA does
not evaluate UX specifically, we looked for a method
that was fast, easy, and low cost. As the UX
dimension of TUXEL is derived from UEQ
(Laugwitz et al., 2008), we decided to use UEQ to
make a fair comparison.
3.3 Empirical Procedures
The experiment comprised two sessions, each session
in a different day. Each participant took part in only
one session. The first session involved the inspection
group and was conducted by two researchers in a
laboratory at UFAM. Before the evaluation, we asked
the participants to review and sign a consent form,
explaining the importance of the study and the
confidentiality of their personal information. Next,
we introduced the participants to TUXEL, explaining
its purpose and how to use and report problems with
it, without giving much detail to avoid bias. We also
explained the purpose of the target platform and
provided the script with the set of tasks to be
performed during the inspection process (see Table
1). Each participant inspected individually, and all the
interaction process was recorded for further analyses.
Given that it would be important to identify every
ICEIS 2020 - 22nd International Conference on Enterprise Information Systems
490
problem found in the platform, we oriented the
participants to report problems that did not match any
of TUXEL items in a notepad.
Table 1: Description of the functionalities of the platform.
Functionalit
y
Descri
p
tion
Registration It allows users to create an account to
manage information regarding their
vehicles and driver’s license.
Scheduling It allows scheduling a service related
to vehicles or drive
r
s’ license.
Driver’s
license
consultation
It allows users to check their driver’s
license status and infringements.
Vehicle’s
consultation
It allows users to consult the vehicle’s
information, fines, and status.
The second session involved the UT participants
and was conducted by three researchers who acted as
moderators in a computer lab at the software
development company. Each researcher carried out
the tests with one participant at a time, and we
recorded all the interaction process for further
analyses. Initially, we presented ourselves to the
participants and explained the concept of usability
and the importance of the study. Then, we started the
testing process. First, we introduced the platform to
the participants, explaining its purpose. Next, we
provided the script with the set of tasks and asked
them to perform one task at a time, in order. We also
asked the participants to verbalize their thoughts and
feelings during the accomplishment of the tasks. We
took notes in the problem reporting form, describing
the problem faced by the participant and registering
the start and end time of each task. When a participant
was not able to accomplish a task after many
attempts, we instructed them to skip to the next task.
After performing the tasks, we provided them the
UEQ to evaluate the UX conveyed by the platform,
explaining its purpose and how to fill it.
3.4 Consolidation and Extraction of
Usability Problems
We divided the extraction process among three
researchers. First, we created a spreadsheet in Google
Sheets to facilitate the process. The spreadsheet was
an N x M matrix, where ‘N’ is the description of the
discrepancy extracted from the participants and ‘M’
is the participant id. Discrepancy means every
description of a potential problem provided by the
participant that was not validated yet. Each researcher
filled the spreadsheet by including the description of
the discrepancy and assigning it to the ID of the
participant from whom it was obtained. Before
including a new discrepancy, the researchers read the
previous ones to verify whether it was already
reported by another researcher. After including all the
discrepancies in the spreadsheet, we assigned a
unique ID for each of them. Similar discrepancies
were merged into a single one, with a clear and
complete description. Discrepancies that addressed
more than one potential problem were split into
different discrepancies. This process was carried out
by one researcher and reviewed by the other two
researchers. After consolidating the discrepancies, we
analyzed each one and discussed whether it was a
problem, false positive (i.e., did not represent a real
problem) or suggestion (i.e., did not describe a
problem, but a participant’s opinion).
We set up a presentation with all usability
problems identified and presented them to the
stakeholders and to the development team, which
comprised three team leaders (software architecture,
software quality, and Web design), a designer, two
programmers, a web designer, and two analysts. We
assured that all information that could lead to the
identification of the participants was removed from
the presentation. We asked the development team to
rate each problem according to its level of severity, as
follows (Nielsen, 1994): 1) Cosmetic: not need to fix
unless there is extra time available; 2) Minor: fixing
this should be given low priority; 3) Major:
important to fix, should be given high priority; 4)
Catastrophic: imperative to fix this before product
can be released.
4 RESULTS
For comparing the methods quantitatively, we
calculated effectiveness, efficiency, thoroughness,
and validity. We defined effectiveness as the ratio
between the number of problems identified by the
participant/inspector and the total number of all
problems identified in the study. With regards to
efficiency, ISO 9241-11 defines it as “resources used
in relation to the results achieved”, which includes
time, human effort, costs, and materials (International
Organization for Standardization, 2018). Given that
usability inspection requires only one person (the
inspector), while usability testing requires at least two
persons (the participant and the moderator), we
calculated the cost-efficiency using the formula Effic.
i
= P
i
/ (time
i
* n), where P
i
and time
i
refer to the total
number of problems found by participant i and the
time they spent in the evaluation, respectively, and n
is the number of people required to perform the
To Inspect or to Test? What Approach Provides Better Results When It Comes to Usability and UX?
491

evaluation (n=1 for inspection and n=2 for testing).
To investigate the extent to which TUXEL predicts
problems that actual users face during usability
testing, we calculated two standard usability metrics
proposed by Hartson et al. (2003) – thoroughness
and validity –, as follows:
𝑇ℎ𝑜𝑟𝑜𝑢𝑔ℎ𝑛𝑒𝑠𝑠
ℎ𝑖𝑡𝑠
ℎ𝑖𝑡𝑠 𝑚𝑖𝑠𝑠𝑒𝑠
𝑉𝑎𝑙𝑖𝑑𝑖𝑡𝑦
ℎ𝑖𝑡𝑠
ℎ𝑖𝑡𝑠 𝑓𝑎𝑙𝑠𝑒 𝑎𝑙𝑎𝑟𝑚𝑠
Hits are the number of problems found in both
inspection and testing. Misses refers to the number of
problems that were found in testing but not during
inspection. Finally, False Alarms are the number of
problems identified in the inspection but not
confirmed during UT.
We formulated the following hypotheses (null and
alternative, respectively):
H
1
: There is no difference in effectiveness
between inspection and testing.
H
A1
: The effectiveness of inspection is greater
than that of testing.
H
2
: There is no difference in efficiency between
inspection and testing.
H
A2
: The efficiency of inspection is greater than
that of testing.
We also compared the number of major and
catastrophic problems identified per method, given
that methods that address a higher number of these
problems may be more useful than those that identify
only minor ones (Hartson et al., 2003). Additionally,
we calculated the number of problems identified by
inspectors according to the level of knowledge in
usability evaluation to evaluate whether novices can
employ TUXEL without losing effectiveness. Thus,
we formulated the following hypotheses:
H
3
: There is no difference between the number of
major/catastrophic problems identified by inspection
and testing.
H
A3
: Inspection identifies more major/
catastrophic problems than testing.
H
4
: There is no difference in effectiveness in the
detection of major/catastrophic problems between
novice and expert inspectors.
H
A4
: The effectiveness of expert inspectors in the
detection of major/catastrophic problems is greater
than that of novice inspectors.
H
5
: There is no difference in efficiency in
identifying major/catastrophic problems between
novice and expert inspectors.
H
A5
: The efficiency of expert inspectors in
identifying major/catastrophic problems is greater
than that of novice inspectors.
We selected these metrics because they reflect
aspects that companies with budget and time
constraints may consider when choosing a method.
According to Ardito et al. (2014), practitioners state
that usability/UX evaluation requires several
resources in terms of cost, time, and people involved.
In this sense, it is important that the selected method:
i) address as many problems as possible (effective-
ness) in less time (efficiency); ii) do not require
experts for being employed, helping to reduce costs;
and iii) address most of the high-priority problems.
To test the hypotheses, we performed statistical
analyses by using IBM SPSS v25 to verify whether
there was a significant difference between the results
of each method per evaluated metric. Before running
each statistical test, we needed to know how the data
were distributed, given that different experiment
designs and data distribution require different
statistical tests (Wohlin et al., 2012). To do so, we
performed a Shapiro-Wilk normality test (Shapiro &
Francia,
1972). If p-value >= 0.05 (i.e., the data
Table 2: Raw data from usability evaluation.
Usability Inspection
Participant I1 I2 I3 I4 I5 I7 I8 I9 I10
Discrepancies 21 20 27 26 16 37 28 23 19
False Positives 2 2 2 0 1 3 1 0 3
Total Problems 19 18 25 26 15 34 27 23 16
Time (min) 108 94 101 81 98 111 96 114 92
Effectiveness (%) 15.0 14.2 19.7 20.5 11.8 26.8 21.3 18.1 12.6
Efficiency (%) 10.6 11.5 14.9 19.3 9.2 18.4 16.9 12.1 10.4
Usability Testing
Participant U1 U2 U3 U4 U5 U6 U7 U8 U9 U10
Total Problems 11 8 13 5 8 7 14 7 9 7
Time (min) 33 25 69 15 30 20 29 27 57 39
Effectiveness (%) 8.7 6.3 10.2 3.9 6.3 5.5 11.0 5.5 7.1 5.5
Efficiency (%) 10.0 9.6 5.7 10.0 8.0 10.5 14.5 7.8 4.7 5.4
ICEIS 2020 - 22nd International Conference on Enterprise Information Systems
492

follow a normal distribution) in both groups for a
given metric, we applied the Student’s t-test. By
contrast, if p-value < 0.05 (i.e., the data do not follow
a normal distribution) in at least one group for that
metric, we applied the Mann-Whitney non-
parametric statistical test.
Finally, regarding UX evaluation, we compared
the outcomes between inspectors and users. We
aimed to investigate whether there is a difference
between the perceptions of inspectors and users about
the UX conveyed by the platform.
4.1 Usability Problems Overview
A total of 157 unique discrepancies were identified.
Among them, we classified 5 as suggestions and 9 as
not applicable (i.e., aspects related to features that
were not implemented in the platform yet, such as
links for functionalities under development). After
removing these discrepancies, 126 were identified as
problems and 17 as false positives.
Table 2
presents an
overview of the discrepancies per participant, per
group. It is worth mentioning that inspector I6
performed the inspection in two days due to their time
constraints. As this can affect the results, we removed
the data from this participant from both usability and
UX evaluations.
Regarding usability problems, the registration
task was the one that had the highest number of issues
identified: 9 out of 10 participants from the usability
testing had difficulty in finding the registration
option, which was only visible when clicking on the
login button. Among them, four participants were not
even able to complete this task. This issue was also
reported by 6 out of 9 inspectors.
Participants from both groups had difficulty in
defining the password, as it required a combination of
numbers, letters, and one capital letter. Moreover, this
requirement was only informed by a warning message
that appeared when trying to submit the registration
form. This message also appeared at the bottom of the
page for only a few seconds, making it difficult for
the participants to read the entire message. Overall,
the registration task also demanded much time (9
minutes on average).
4.2 Effectiveness and Efficiency
The analysis indicated that the effectiveness and
efficiency of the inspection group (18.6% and 13.7%)
were, on average, higher than of the usability testing
(7.4% and 8.6%), indicating that the former allows
identifying a higher number of usability problems in
less time. With regard to these metrics, it is important
to highlight some issues. The time recorded in the
usability inspection included the time spent by
inspectors during the UX evaluation step, given that
it is part of TUXEL. For usability testing, we only
recorded the time spent during the execution of the
tasks. By contrast, the dual task of thinking-aloud
while working may have interfered on the accuracy
of the time-on-task metric.
The normality test showed that the data were
normally distributed for effectiveness and efficiency
in both groups, thus we performed Student’s t-test.
The results evidenced that the inspection was
significantly more effective (t(11.096) = 6.089,
p < .001) and more efficient (t(17) = 3.294, p = .004)
than the testing, thus rejecting both H
1
and H
2
null
hypotheses.
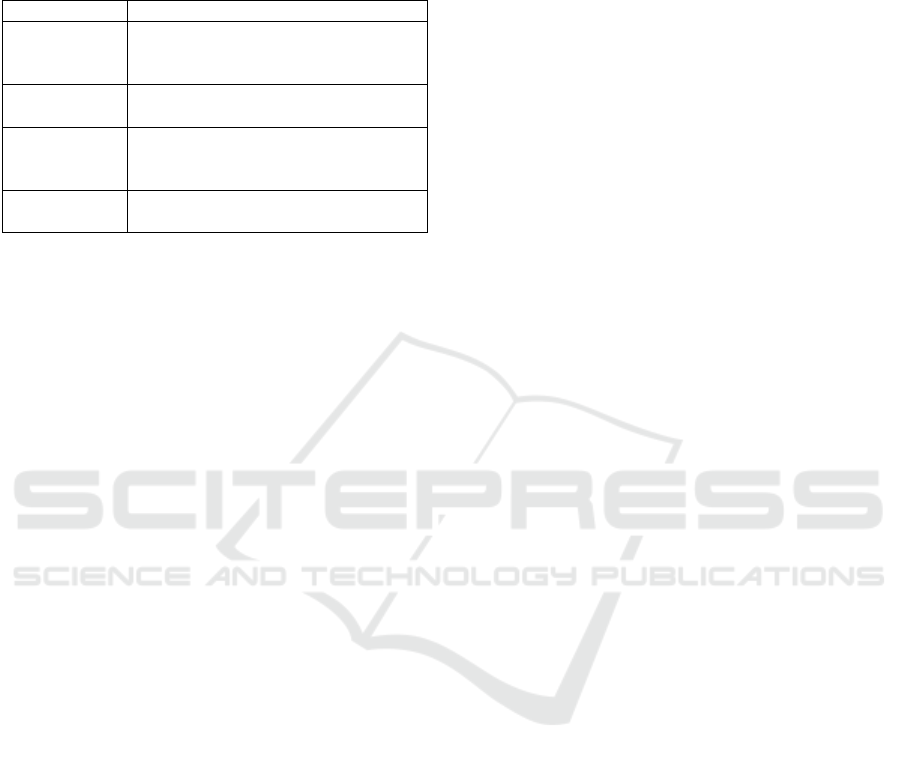
4.3 Problems by Severity
The analysis of the severity of the problems identified
per evaluation method showed that the inspection
group identified a greater number of cosmetic and
minor problems in comparison to the UT group (see
Figure 1). Additionally, they identified most of the
problems pointed out by the participants of the UT
group, while addressing a higher number of unique
major problems. None of the groups pointed out
catastrophic problems in the platform. The t-test
revealed that TUXEL identified significantly more
major problems than CTA (t(17) = 3.349, p = .004),
thus rejecting the H
3
null hypothesis.
Figure 1: Problems identified by the level of severity.
4.4 Problems by Evaluator Experience
in Usability Evaluations
Usability inspection highly depends on the
inspectors’ expertise to identify usability problems
(Følstad et al., 2012; Hornbæk, 2010). As employing
expert evaluators to perform an inspection may be
costly, it is important to verify how well novice
inspectors perform in comparison to expert ones.
Figure 2|a presents the average number of
problems grouped by inspectors’ expertise in
usability evaluation. The results indicated that
inspectors with low experience tended to identify
more major issues than those with a high level of
experience. By contrast, the former was not as
effective in identifying minor and cosmetic problems.
To Inspect or to Test? What Approach Provides Better Results When It Comes to Usability and UX?
493
(a) (b)
Figure 2: (a) Average number of problems and
(b) effectiveness and efficiency by evaluators’ level of
experience in usability evaluation.
We also calculated the effectiveness and
efficiency of novices and experts (see Figure 2|b).
The results showed that experts were more efficient
than novices. The t-test, however, indicated that the
differences were not significant, neither for
effectiveness (t(7) = -1.271, p = .244) nor for
efficiency (t(7) = -1.219, p = .262), thus not rejecting
the H
4
and H
5
null hypotheses.
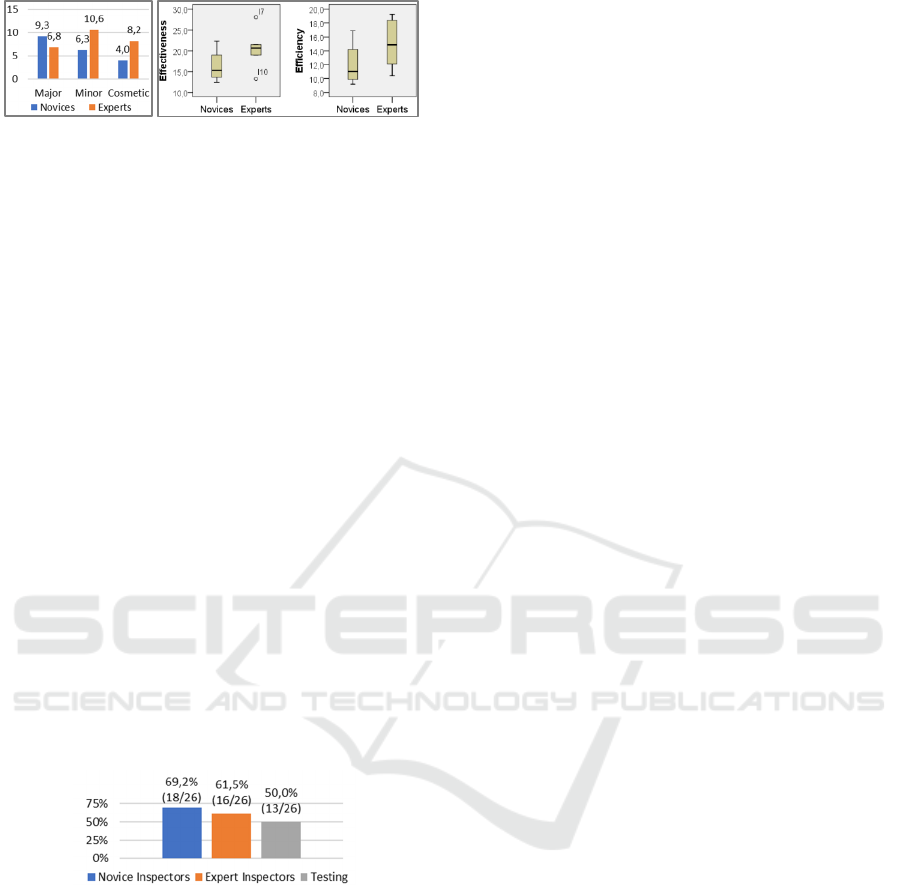
4.5 Usability Problems Coverage
As stated before, a method that identifies a high
percentage of major problems may have more utility
than those that identify a larger number of minor ones
(Hartson et al., 2003). However, given that two or
more participants can report the same problem, it is
also important to analyze the level of coverage per
evaluation method and per level of experience in
usability evaluations, rather than just verifying the
average number of major problems identified. This
will highlight how broad, i.e., how many unique
problems each method allowed to identify.
Figure 3: Level of coverage of major usability problems per
method and experience in usability evaluation.
First, we calculated the ratio between the number
of major problems identified by each evaluation
method and all major problems identified in the study,
grouping the results according to the level of
experience in usability evaluation (see Figure 3). The
results showed that both novice and expert inspectors
outperformed UT. Novice inspectors identified 18 out
of the 26 major problems (69.2%). In contrast, UT
identified only half of all major problems.
4.6 Thoroughness, Validity, and
Effectiveness
When employing inspection methods, they should
identify the highest number of problems that could
occur during actual user interaction. Thus, we
calculated the thoroughness, validity, and
effectiveness as proposed by Hartson et al. (2003).
TUXEL identified a total of 21 out of 41 problems
that occurred during UT, which gives a thoroughness
of 51.2%. This value is greater than those obtained by
traditional HE in previous works, such as those by
Hvannberg et al. (2007) and Desurvire (1992), which
resulted in 36% and 44% of thoroughness,
respectively. Regarding validity, TUXEL identified
106 problems. However, only 21 were confirmed in
UT, yielding a validity of 19.8%.
Among the 13 major problems that occurred in
usability testing, 9 (69.2%) were predicted by novice
inspectors and 7 (53.8%) by experts. All the 7
problems identified by experts were also identified by
novice inspectors.
4.7 Problems by Experience in
Usability Evaluations
The results from the UX evaluation revealed a
different perspective of the experience between the
participants who acted as users in UT and inspectors
(see Figure 4). The bars represent the mean for each
dimension evaluated by the participants. The ratings
range from -3 to 3, where values greater than or equal
to 1 indicate a positive perception about the UX of the
platform, while values less than or equal to -1 indicate
a negative perception. Finally, values between -1 and
1 indicate a neutral perception.
The results indicated that, for the participants who
acted as users in UT, despite the usability problems
they faced during the test, the UX conveyed by the
platform was positive, as the average rating for each
dimension ranged from 1 to 2 approximately (Figure
4a). On the other hand, the results from the inspection
group revealed a quite different perspective on the
UX (Figure 4b). The results indicated that inspectors
tended to be more consistent about the UX conveyed
by the platform, as the ratings reflected the problems
they identified during the evaluation. The mean for
each dimension ranged from -1 to 1, indicating a
neutral perception of the experience. The t-test
statistical analysis revealed that inspectors evaluated
the UX significantly lower than users in all UX
dimensions: ATTractiveness: t(10.013) = -3.802, p =
.003; PERSPicuity: t(11.624) = -3.303, p = .007;
EFFiciency: t(16) = -2.616, p = .019; DEPendability:
ICEIS 2020 - 22nd International Conference on Enterprise Information Systems
494
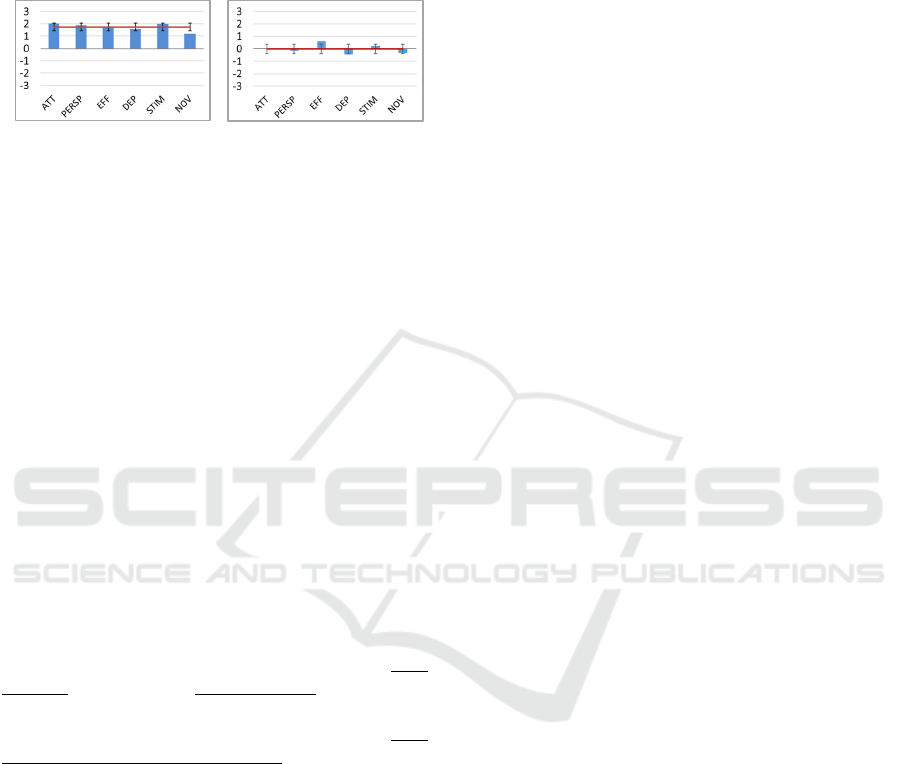
t(12.170) = -3.561, p = .004; STIMulation:
t(16) = -3.653, p = .002), except for NOVelty
(t(16) = -1.981, p = .065). It is worth mentioning that
one participant from UT had to leave the experiment
before evaluating the UX.
(a) (b)
Figure 4: Results of each dimension evaluated by the users
from usability testing (a) and inspectors (b).
We also investigated the correlation between time
spent, number of problems identified, and UX
dimensions. Since the analysis involves ordinal and
interval scale types, we calculated, for each group, the
Spearman’s rho correlation coefficient (Mukaka,
2012). We did not find any significant correlation
between these variables except for the Stimulation
dimension, which had a high negative correlation
with number of problems for the inspection group (r
= -.724, p = .028). This indicates that, the more
problems inspectors find in the platform, the less they
are motivated to use it.
The qualitative analysis from the open-ended
questions of TUXEL allowed us to identify which
aspects affected the ratings by the inspection group.
We coded the sentences (Corbin & Strauss, 2014) by
analyzing the inspectors’ answers and creating codes
that represent the concepts identified in them. For
example, participant I5 stated: “The platform is little
intuitive. I think that it lacks shortcuts to access the
platform’s option more easily. I could not read some
feedback messages because they were little
highlighted and faded out quickly”. The underlined
words are key points identified in these sentences,
which we used to start coding and understanding the
phenomenon. As we wanted to identify what affected
the inspectors’ UX with the platform, we analyzed
these key points and created codes for UX-related
issues. For example, for the key point ‘little intuitive’,
we assigned the code ‘hard to understand’, and for
‘little highlighted and faded out quickly’, we assigned
the code ‘low visibility of the feedback message’.
After coding the sentences, we grouped those that
represent the same idea, creating a broader code that
addresses the concepts identified in these sentences.
The first code indicates that the platform is not
intuitive. Inspector I2, for instance, reported
“Sometimes I do not know where to go, which limits
its utilization. Therefore, I found it a little
complicated to use”. The second code relates to the
low contrast of interface’s color, which may impair
the visibility of options and notifications. Inspector
I10 pointed out “[...] when choosing the place and
time [for scheduling], the font color was not visible”.
Finally, the third code reveals the difficulty in
visualizing the feedback messages. Inspector I6 stated
“Something recurrent is the lack of helpful feedback
to the user because the existing ones are not
significant or much visible.”
5 DISCUSSION
The results of our study reinforce previous findings
from the literature, where inspection allowed
identifying a greater number of problems in
comparison to usability testing (Hasan et al., 2012;
Hvannberg et al., 2007; Maguire & Isherwood, 2018).
The inspection was, overall, more effective and
efficient than the UT, indicating that it is still a cost-
effective method for identifying usability problems.
The analysis of problem severity showed that,
proportionally to the total of problems identified by
each method, inspection led to the identification of a
higher number of cosmetic and minor problems than
major ones, while usability testing identified more
minor and major problems than cosmetic ones. As
usability testing is task-oriented, i.e., more focused on
the identification of aspects that may impair the
accomplishment of the tasks, it may identify more
severe problems than cosmetic ones, given that it does
not evaluate the interface as a whole. By contrast,
inspection methods guide inspectors to search for
many specific aspects that may influence the usability
of the product/system, leading to the identification of
details that may be missed during usability testing.
However, although inspection proportionally
identified fewer major problems than minor and
cosmetic ones, the number of major problems
reported by inspectors surpasses those found in
usability testing. Additionally, inspectors addressed
most of the major problems reported in usability
testing while identifying a greater number of unique
ones, highlighting the effectiveness of TUXEL in
addressing potential high priority problems that can
occur during actual user interaction.
When considering the level of experience in
usability evaluation, the results showed that novice
inspectors identified as many problems as experts,
indicating that TUXEL supports the identification of
problems even by inspectors without much
experience with usability evaluation. Moreover,
To Inspect or to Test? What Approach Provides Better Results When It Comes to Usability and UX?
495

novices identified slightly more major problems than
experts. These results are contrasting to those found
by Desurvire et al. (1992), where non-experts using
HE identified less than half of the problems found by
experts. This indicates that TUXEL supports novice
inspectors to find problems during the evaluation
process. By contrast, experts reported a higher
number of cosmetic and minor problems in
comparison to novices. Given that experts are more
familiarized with this type of evaluation, they
probably were more meticulous in identifying every
aspect that was not in compliance with the evaluated
items, which would have led to the identification of
those many minor and cosmetic issues. However, as
it may be costly for companies to employ experts,
TUXEL may be a good alternative for reducing costs
without impairing the results of the evaluation, as
significant differences in effectiveness and efficiency
between novices and experts were not observed.
Regarding thoroughness, our results were better
than those obtained by Hvannberg et al. (2007) and
Desurvire (1992) who employed inspection methods,
such as Nielsen’s HE. Although we cannot make a
direct comparison, as the evaluated product is
different and we did not employ Nielsen’s HE in this
study, the results indicate good effectiveness,
especially given that TUXEL was primarily designed
for the e-learning context. Moreover, the fact that
novices predicted 69.2% of all major problems found
in UT highlights that TUXEL is cost-effective. By
contrast, TUXEL led to the identification of many
other problems that were not confirmed during UT,
resulting in low validity. It is probably because four
out of ten users from UT failed to create an account
on the platform, hindering them from performing
tasks that required logging in. Consequently, usability
problems related to these tasks could not be addressed
in UT. Although it cannot be guaranteed that these
unconfirmed problems will occur, they highlight
opportunities for improving the platform.
Despite the advantages of identifying many
problems, TUXEL also requires more effort from the
practitioners for analyzing and consolidating all the
discrepancies and verifying whether they are real
problems or not. In this sense, UT has the advantage
of not requiring further analysis for false positives, as
only real problems faced by users and identified by
the moderator are reported. Moreover, as UT focuses
only on the problems that actually occurred during the
interaction and not on those that violated a given
heuristic or standard, the number of discrepancies to
analyze and consolidate is reduced. A drawback of
UT is that it is costly, given that more participants are
needed for identifying more problems, while
inspection requires only few inspectors, even those
without too much experience (in the case of TUXEL).
If the company has access to users, UT is a good
option. By contrast, if the product involves
confidentiality issues or is under early stages of
development, employing an inspection method may
be more suitable. A combination of both approaches,
however, may provide the best results.
Finally, regarding UX evaluation, given that
inspectors found a higher number of problems, their
perception about the UX of the platform may have
been influenced by the inspection process, leading to
neutral evaluation. By contrast, the participants from
UT evaluated the UX of the platform very positively,
even those who had many difficulties, could not
perform some tasks, or took a long time to accomplish
them. Previous works have already pointed out this
phenomenon (Nakamura et al., 2019), indicating that
other factors may have had stronger influence on UX
than the problems they faced during the interaction.
As they knew that the platform was being developed
by the company, they may not have felt at ease to
criticize it, although we explained the importance of
being honest and that the object of study was the
platform, not the participants themselves. Another
possibility is related to the profile of the UT
participants. As they did not use computers very
often, they probably had never used this type of
platform before, thus everything was new to them.
Previous works, for example, have demonstrated that
participants’ expectations influence UX evaluations
(Kujala et al., 2017; Kujala & Miron-Shatz, 2015). As
they had not used this type of platform before and
only use computers occasionally, they probably did
not have any expectations about the platform, nor a
basis for evaluating their experience, leading to a
more positive evaluation.
It is worth mentioning that the small sample size
limits the generalization of the results. However, it is
representative for empirical studies in the industry,
where not many subjects are available. We also
selected participants whose profiles reflect the target
population. Although we involved employees in user
testing, we selected those from different departments,
with varied digital literacy, low experience with
technology, and were not part of the development
team. For the inspection group, we selected both
participants with and without experience in usability
evaluation to reflect companies that may or may not
have usability experts available. Finally, the platform
domain and its specificities also limit the
generalization of the results, as it did not require
domain knowledge to be evaluated.
ICEIS 2020 - 22nd International Conference on Enterprise Information Systems
496

6 CONCLUSIONS
Inspection remains a cost-effective approach for
evaluating the usability of current Web platforms,
allowing the identification of a greater number of
problems in comparison to usability testing. These
problems highlight many points that can be improved,
leading to the development of high-quality products.
Our results also showed that it is possible to employ
an inspection method with novices and still maintain
its effectiveness in identifying problems, which can
help companies to reduce costs.
Although usability testing identified considerably
fewer problems, it allowed the identification of a
great number of major ones, considered by the
development team as important to fix with high
priority. As the effort for consolidating and analyzing
the data is proportional to the number of problems
reported, usability testing is a good alternative for
focusing on the main and recurrent problems that
users may face during their interaction.
It is worth mentioning that combining these
approaches might provide more complete results,
allowing practitioners to have a broader view of the
quality of the product being evaluated. However, this
implies more cost due to the need for more personnel
and time for consolidating and analyzing the results.
In this sense, practitioners should decide according to
the company’s constraints and needs.
Regarding UX evaluation, the differences in the
results between inspectors and users raise doubts
about which results to rely on and indicate that other
factors may have influenced their subjective
evaluations. The lower ratings from inspectors
indicate a possible influence of the problem detection
process inherent to inspection, leading them to focus
on the negative aspects of the platform. The higher
ratings of the participants from usability testing, in
turn, may be related to their profile. As they only use
computers occasionally, they may have had no
expectations about the platform nor a baseline for
comparing their experience with previous ones. The
fact that they were also employees of the company
that developed the Web platform may have also
contributed to a more positive evaluation.
In contrast to usability, research in the UX field is
challenging, given that different factors can affect
users’ evaluations due to the subjective nature of
experiences. Future studies may investigate what
factors (e.g. previous experience with similar
products and UX evaluations) influence the
perceptions about their experiences. By doing so, it
would make it possible for practitioners and
researchers to focus on the factors that influence UX,
either by reducing their effects during evaluations or
by considering them when designing new products.
Another possibility is to investigate the impact of
different outcomes on practitioners’ decisions in the
development process. As practitioners rely on the
results from this type of evaluation for improving
their products and planning future releases,
contrasting results as those found in our study may
lead to different design decisions.
ACKNOWLEDGEMENTS
This work was supported by the Brazilian funding
agency FAPEAM through process number
062.00478/2019, the Coordination for the
Improvement of Higher Education Personnel - Brazil
(CAPES) process 175956/2013, and CNPq processes
204081/2018-1/PDE, 311316/2018-2, 311494/2017-
0, and 423149/2016-4. We especially thank all the
subjects who participated in this research.
REFERENCES
Alhadreti, O., & Mayhew, P. (2018). Rethinking Thinking
Aloud: A Comparison of Three Think-Aloud Protocols.
Proceedings of the 2018 CHI Conference on Human
Factors in Computing Systems - CHI ’18, 1–12.
Alves, R., Valente, P., & Nunes, N. J. (2014). The state of
user experience evaluation practice. Proceedings of the
8th Nordic Conference on Human-Computer
Interaction Fun, Fast, Foundational - NordiCHI ’14,
93–102.
Ardito, C., Buono, P., Caivano, D., Costabile, M. F., &
Lanzilotti, R. (2014). Investigating and promoting UX
practice in industry: An experimental study.
International Journal of Human-Computer Studies,
72(6), 542–551.
Cockton, G., Woolrych, A., & Hindmarch, M. (2004).
Reconditioned merchandise: Extended structured
report formats in usability inspection. Extended
Abstracts of the 2004 Conference on Human Factors
and Computing Systems - CHI ’04, 1433.
Corbin, J., & Strauss, A. (2014). Basics of qualitative
research. Sage Publications, Inc.
Desurvire, H., Kondziela, J., & Atwood, M. E. (1992).
What is gained and lost when using methods other than
empirical testing. Posters and Short Talks of the 1992
SIGCHI Conference on Human Factors in Computing
Systems - CHI ’92, 125.
Fernandez, A., Abrahão, S., & Insfran, E. (2013). Empirical
validation of a usability inspection method for model-
driven Web development. Journal of Systems and
Software, 86(1), 161–186.
Følstad, A., Law, E., & Hornbæk, K. (2012). Analysis in
practical usability evaluation: A survey study.
To Inspect or to Test? What Approach Provides Better Results When It Comes to Usability and UX?
497

Proceedings of the SIGCHI Conference on Human
Factors in Computing Systems, 2127–2136.
Hartson, H. R., Andre, T. S., & Williges, R. C. (2003).
Criteria For Evaluating Usability Evaluation Methods.
International Journal of Human-Computer Interaction,
15(1), 145–181.
Hasan, L., Morris, A., & Probets, S. (2012). A comparison
of usability evaluation methods for evaluating e-
commerce websites. Behaviour & Information
Technology, 31(7), 707–737.
Hassenzahl, M. (2018). The Thing and I (Summer of ’17
Remix). In M. Blythe & A. Monk (Orgs.), Funology 2
(p. 17–31). Springer International Publishing.
Hassenzahl, M., Diefenbach, S., & Göritz, A. (2010).
Needs, affect, and interactive products – Facets of user
experience. Interacting with Computers, 22(5), 353–
362.
Hassenzahl, M., Law, E. L.-C., & Hvannberg, E. T. (2006).
User Experience-Towards a unified view. Ux Ws
Nordichi, 6, 1–3.
Hornbæk, K. (2010). Dogmas in the assessment of usability
evaluation methods. Behaviour & Information
Technology, 29(1), 97–111.
Hvannberg, E. T., Law, E. L.-C., & Lárusdóttir, M. K.
(2007). Heuristic evaluation: Comparing ways of
finding and reporting usability problems. Interacting
with Computers, 19(2), 225–240.
Hwang, W., & Salvendy, G. (2010). Number of people
required for usability evaluation: The 10±2 rule.
Communications of the ACM, 53(5), 130.
International Organization for Standardization. (2018).
Ergonomics of human-system interaction—Part 11:
Usability: Definitions and concepts.
Jeffries, R., Miller, J. R., Wharton, C., & Uyeda, K. M.
(1991). User interface evaluation in the real world: A
comparison of four techniques. Proceedings of the
SIGCHI Conference on Human Factors in Computing
Systems Reaching through Technology - CHI ’91, 119–
124.
Kujala, S., & Miron-Shatz, T. (2015). The Evolving Role
of Expectations in Long-term User Experience.
Proceedings of the 19th International Academic
Mindtrek Conference, 167–174.
Kujala, S., Mugge, R., & Miron-Shatz, T. (2017). The role
of expectations in service evaluation: A longitudinal
study of a proximity mobile payment service.
International Journal of Human-Computer Studies, 98,
51–61.
Laugwitz, B., Held, T., & Schrepp, M. (2008). Construction
and Evaluation of a User Experience Questionnaire. In
A. Holzinger (Org.), HCI and Usability for Education
and Work (Vol. 5298, p. 63–76). Springer Berlin
Heidelberg.
Law, E. L.-C., & Hvannberg, E. T. (2002).
Complementarity and Convergence of Heuristic
Evaluation and Usability Test: A Case Study of
UNIVERSAL Brokerage Platform. Proceedings of the
Second Nordic Conference on Human-Computer
Interaction, 71–80.
Law, E. L.-C., Roto, V., Hassenzahl, M., Vermeeren, A. P.,
& Kort, J. (2009). Understanding, scoping and defining
user experience: A survey approach. Proceedings of the
SIGCHI conference on human factors in computing
systems, 719–728.
Law, E. L.-C., Vermeeren, A. P., Hassenzahl, M., & Blythe,
M. (2007). Towards a UX manifesto. Proceedings of
the 21st British HCI Group Annual Conference on
People and Computers: HCI... but not as we know it-
Volume 2, 205–206.
Maguire, M., & Isherwood, P. (2018). A Comparison of
User Testing and Heuristic Evaluation Methods for
Identifying Website Usability Problems. In A. Marcus
& W. Wang (Orgs.), Design, User Experience, and
Usability: Theory and Practice (Vol. 10918, p. 429–
438). Springer International Publishing.
Mukaka, M. M. (2012). Statistics Corner: A guide to
appropriate use of Correlation coefficient in medical
research. Malawi Medical Journal, 24(3), 69–71.
Nakamura, W. T., de Oliveira, E. H. T., & Conte, T. (2019).
Negative Emotions, Positive Experience: What Are We
Doing Wrong When Evaluating the UX? Extended
Abstracts of the 2019 CHI Conference on Human
Factors in Computing Systems - CHI EA ’19, 1–6.
Nakamura, W. T., Oliveira, E. H. T., & Conte, T. (2018).
Applying Design Science Research to develop a
Technique to Evaluate the Usability and User
eXperience of Learning Management Systems.
Brazilian Symposium on Computers in Education.
Nielsen, J. (1994). Heuristic Evaluation. J. Nielsen, & RL
Mack (Eds.), Usability Inspection Methods (pp. 25–61).
New York: John Wiley & Sons.
Shapiro, S. S., & Francia, R. S. (1972). An Approximate
Analysis of Variance Test for Normality. Journal of the
American Statistical Association, 67(337), 215–216.
Teka, D., Dittrich, Y., Kifle, M., Ardito, C., & Lanzilotti,
R. (2017). Usability Evaluation in Ethiopian Software
Organizations. Proceedings of the Second International
Conference on Information and Communication
Technology for Africa Development, ICT4AD, 17, 102–
118.
Van den Haak, M. J., de Jong, M. D. T., & Schellens, P. J.
(2004). Employing think-aloud protocols and
constructive interaction to test the usability of online
library catalogues: A methodological comparison.
Interacting with Computers, 16(6), 1153–1170.
Wohlin, C., Runeson, P., Höst, M., Ohlsson, M. C.,
Regnell, B., & Wesslén, A. (2012). Experimentation in
software engineering. Springer Science & Business
Media.
ICEIS 2020 - 22nd International Conference on Enterprise Information Systems
498
