Learning to Determine the Quality of News Headlines
Amin Omidvar
1
, Hossein Pourmodheji
1
, Aijun An
1
and Gordon Edall
2
1
Department of Electrical Engineering and Computer Science, York University, Canada
2
The Globe and Mail, Canada
{omidvar, pmodheji, aan}@eecs.yorku.ca, GEdall@globeandmail.com
Keywords: Headline Quality, Deep Learning, NLP.
Abstract: Today, most news readers read the online version of news articles rather than traditional paper-based
newspapers. Also, news media publishers rely heavily on the income generated from subscriptions and
website visits made by news readers. Thus, online user engagement is a very important issue for online
newspapers. Much effort has been spent on writing interesting headlines to catch the attention of online users.
On the other hand, headlines should not be misleading (e.g., clickbaits); otherwise readers would be
disappointed when reading the content. In this paper, we propose four indicators to determine the quality of
published news headlines based on their click count and dwell time, which are obtained by website log
analysis. Then, we use soft target distribution of the calculated quality indicators to train our proposed deep
learning model which can predict the quality of unpublished news headlines. The proposed model not only
processes the latent features of both headline and body of the article to predict its headline quality but also
considers the semantic relation between headline and body as well. To evaluate our model, we use a real
dataset from a major Canadian newspaper. Results show our proposed model outperforms other state-of-the-
art NLP models.
1 INTRODUCTION
People's attitude toward reading newspaper articles is
changing in a way that people are more willing to read
online news articles than paper-based ones. In the
past, people bought a newspaper, saw almost all the
pages while scanning headlines, and read through
articles which seemed interesting (Kuiken, Schuth,
Spitters, & Marx, 2017). The role of headlines was to
help readers have a clear understanding of the topics
of the article.
But today, online news publishers are changing
the role of headlines in a way that headlines are the
most important way to gain readers' attention. One
important reason is that online news media publishers
rely on the incomes generated from the subscriptions
and clicks made by their readers (Reis et al., 2015).
Furthermore, the publishers need to attract more
readers than their competitors if they want to succeed
in this competitive industry. The aforementioned
reasons are the most important ones why some of the
online news media come up with likable headlines to
lure the readers into clicking on their headlines. These
likable headlines may increase the number of clicks
but at the same time will disappoint the readers since
they exaggerate the content of the news articles
(Omidvar, Jiang, & An, 2018).
Therefore, having a tool that can predict the
quality of news headlines before publication would
help authors to choose those headlines that not only
increase readers' attention but also satisfy their
expectations. However, there are some challenges to
predict the quality of headlines. First, there is no
labelled data set specifying the quality of headlines.
Thus, given a set of articles and users' browsing
history on the articles, how to determine the quality
of headlines is an open issue. Second, given labelled
data, how to build a model that can accurately predict
the quality of headlines considering the metrics that
data is labelled.
The main contributions of this research are as
follows:
First, we proposed a novel headline quality
detection approach for published headlines using
dwell time and click count of the articles and we
provide four headline quality indicators. By using this
approach, we can label news article datasets of any
size automatically, which is not possible by
employing human annotators. Using human
annotators to label data is costly, requires much time
and effort, and may result in inconsistent
labels/evaluation due to subjectivity. To the best of
our knowledge, none of the previous related research
have conducted similar approach for headline quality
detection.
Second, we develop a deep network based
predictive model that incorporates some advanced
features of DNN to predict the quality of unpublished
headlines using the previous approach as a ground
truth. The proposed model considers the proposed
headline quality indicators by considering the
similarity between the headline and its article, and
their latent features.
The rest of this paper is organized as follows. In
section 2, the most relevant works regarding headline
quality in the field of Computer Science and
Psychology are studied. In section 3, we propose four
quality indicators to represent the quality of
headlines. Also, we label our dataset using a novel
way to calculate the proposed quality indicators for
published news articles. Next, we propose our novel
deep learning architecture in section 4 to predict the
headline quality for unpublished news articles. We
use the calculated headline quality from the section 3
as ground truth to train our model. Then in section 5,
our proposed model is compared with baseline
models. Finally, this study is wrapped up with a
conclusion in section 6.
2 RELATED WORKS
Many studies in different areas such as computer
science, psychology, anthropology, and
communication have been conducted on the
popularity and accuracy of the news headlines over
the past few years. In this section, the most relevant
works in the domain of computer science and
psychology are briefly described.
Researchers manually examined 151 news articles
from four online sections of the El Pais, which is a
Spanish Newspaper, in order to find out features
which are important to catch the readers’ attention.
They also analysed how important linguistic
techniques such as vocabulary and words, direct
appeal to the reader, informal language, and simple
structures are in order to gain the attention of readers
(Palau-Sampio, 2016).
In another research, 2 million Facebook posts by
over 150 U.S. based media organizations were
examined to detect clickbait headlines. They found
out clickbaits are more prevalent in entertaining
categories (Rony, Hassan, & Yousuf, 2017). In order
to determine the organic reach (i.e., which is the
number of visitors without paid distribution) of the
tweets, social sharing patterns were analysed in
(Chakraborty, Sarkar, Mrigen, & Ganguly, 2017).
They showed how the differences between customer
demographics, follower graph structure, and type of
text content can influence the tweets quality.
Ecker et al. (Ecker, Lewandowsky, Chang, &
Pillai, 2014) studied how misinformation in news
headlines could affect news readers. They found out
headlines have an important role to shape readers’
attitudes toward the content of news. In (Reis et al.,
2015), they extracted features from the content of
69907 news articles in order to find approaches which
can help to attract clicks. They discovered the
sentiment of the headline is strongly correlated to the
popularity of the news article.
Some distinctive characteristics between accurate
and clickbait headlines in terms of words, entities,
sentence patterns, paragraph structures etc. are
discovered in (Chakraborty, Paranjape, Kakarla, &
Ganguly, 2016). At the end, they proposed an
interesting set of 14 features to recognize how
accurate headlines are. In another work,
linguistically-infused network was proposed to
distinguish clickbaits from accurate headlines using
the passages of both article and headline along with
the article’s images (Glenski, Ayton, Arendt, &
Volkova, 2017). To do that, they employed Long
Short-Term Memory (LSTM) and Convolutional
Neural Network architectures to process text and
image data, respectively.
One interesting research measured click-value of
individual words of headlines. Then they proposed
headline click-based topic model (HCTM) based on
latent Dirichlet allocation (LDA) to identify words
that can bring more clicks for headlines (J. H. Kim,
Mantrach, Jaimes, & Oh, 2016). In another related
research (Szymanski, Orellana-Rodriguez, & Keane,
2017), a useful software tool was developed to help
authors to compose effective headlines for their
articles. The software uses state of the art NLP
techniques to recommend keywords to authors for
inclusion in articles’ headline in order to make
headlines look more intersecting. They calculated two
local and global popularity measures for each
keyword and use supervised regression model to
predict how likely headlines will be widely shared on
social media.
Deep Neural Networks has become a widely used
technique that has produced very promising results in
news headline popularity task in recent years (Bielski
& Trzcinski, 2018; Stokowiec, Trzciński, Wołk,
Marasek, & Rokita, 2017; Voronov, Shen, & Mondal,
2019). Most NLP approaches employ deep learning
models and they do not usually need heavy feature

engineering and data cleaning. However, most of the
traditional methods rely on the graph data of the
interactions between users and contents.
For detecting clickbait headlines, lots of research
have been conducted so far (Fu, Liang, Zhou, &
Zheng, 2017; Venneti & Alam, 2018; Wei & Wan,
2017; Zhou, 2017). In (Martin Potthast, Tim Gollub,
Matthias Hagen, 2017) they launched a clickbait
challenge competition and also released two
supervised and unsupervised datasets which contains
over 80000 and 20000 samples, respectively. Each
sample contains news content such as headline,
article, media, keywords, etc. For the supervised
dataset, there are five scores from five different
judges in a scale of 0 to 1. A leading proposed model
in the clickbait challenge competition (Omidvar et al.,
2018), which its name is albacore in the published
result list on the competition’s website
1
, employed bi-
directional GRU along with Fully connected NN
layers to determine how much clickbait each headline
is. They showed that posted headline on the twitter
(i.e., postText field) is the most important features of
each sample to predict the judges’ score due to the
fact that maybe human evaluators only used posted
Headline feature to label each sample. The leading
approach not only got the first rank in terms of Mean
Squared Error (MSE) but also is the fastest among all
the other proposed models.
To the best of our knowledge, none of the
previous studies analysed the quality of headlines by
considering both their popularity and truthfulness
(i.e., non clickbait). The reason is that almost all of
the previous research, especially those for clickbait
detection, looked at the problem as a binary
classification task. Also, most of them depend on
human evaluators to label the dataset. In our proposed
data labelling approach, we determine the quality of
headlines based on 4 quality indicators by considering
both their popularity and validity. Also, we come up
with a novel approach to calculate 4 quality indicators
automatically by using users’ activity log dataset.
Then, our trained deep learning model not only
determines how popular headlines are, but also how
honest and accurate they are.
3 LABELING DATA
In this section, a novel approach is introduced to
calculate the quality of published headlines based on
users' interactions with articles. This approach is used
for labeling our dataset.
1
https://www.clickbait-challenge.org/#results
3.1 Data
Our data is provided by The Globe and Mail which is
a major Canadian newspaper. It contains a news
corpus dataset (containing articles and their metadata)
and a log dataset (containing interactions of readers
with the news website). Every time a reader opens an
article, writes a comment or takes any other trackable
action, it is detected on the website, and then is stored
as a record in a log data warehouse. Generally, every
record contains 246 captured attributes such as event
ID, user, time, date, browser, IP address, etc.
The log data can give useful insights into readers’
behaviours. However, there are noise and
inconsistencies in the clickstream data which should
be cleaned before calculating any measures, applying
any models, or extracting any patterns. For example,
users may leave articles open in the browser for a long
time while doing other activities, such as browsing
other websites in another tab. In this case, some news
articles will get high fake dwell times from some
readers.
There are approximately 2 billion records of
users' actions in the log dataset. We use the log dataset
to find how many times each article has been read and
how much time users spent reading it. We call these
two measures click count and dwell time,
respectively.
3.2 Quality Indicators
Due to the high cost of labelling supervised training
data using human annotators, large datasets are not
available for most NLP tasks (Cer et al., 2018).
In this section, we calculate the quality of
published articles using articles’ click count and
dwell time measures. By using the proposed
approach, we can label any size of database
automatically and use those labels as ground truths to
train deep learning models. A dwell time for article a
is computed using Formula 1.
𝐷
∑
𝑇
,
𝐶
(1)
where C
a
is the number of times article a was read and
T
a,u
is the total amount of time that user u has spent
reading article a. Thus, the dwell time of article a (i.e.,
D
a
) is the average amount of time spent on the article
during a user visit. The values of read count and dwell
time are normalized in the scale of zero to one.
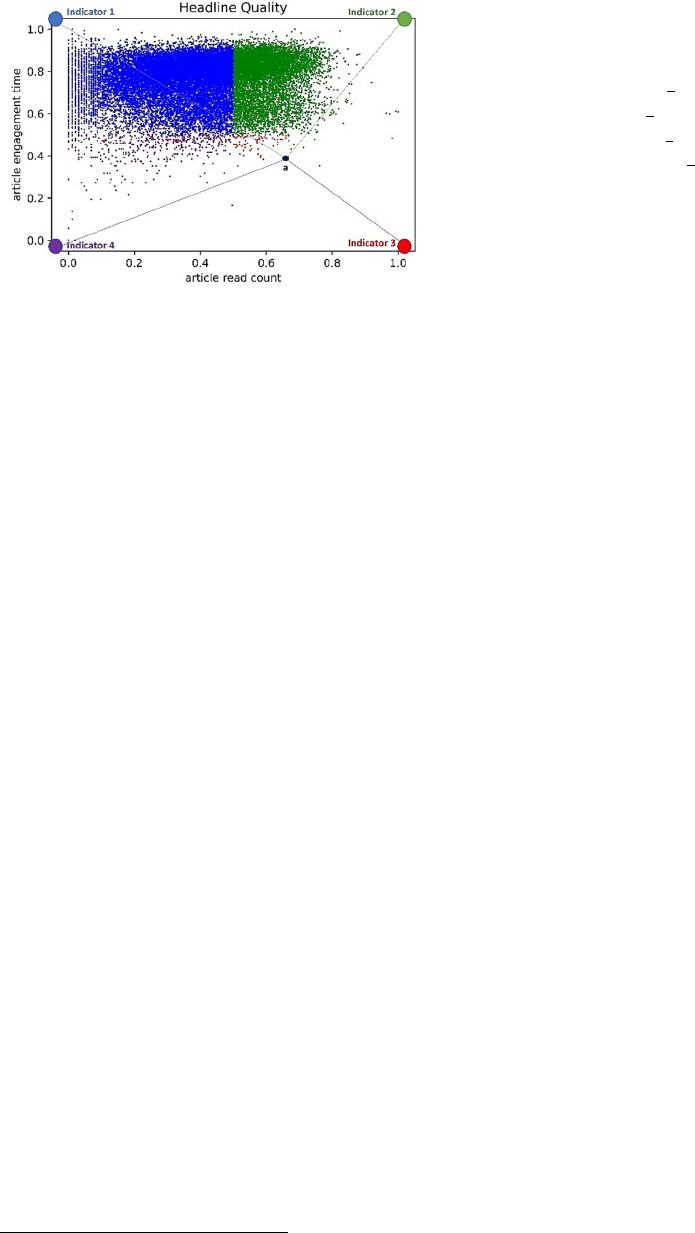
Figure 1: Representing News Headlines' quality with
respect to the four quality indicators.
By considering these two measures for headline
quality, we can define four quality indicators which
are shown by the 4 corners of the rectangle in Figure
1. We did not normalize articles’ dwell time by
articles’ length since the correlation and mutual
information between articles’ reading time and
articles’ length were 0.2 and 0.06, respectively which
indicates there is a very low dependency between
these two variables in our dataset.
Indicator 1: High dwell time but low read count.
Articles close to this indicator were interesting for
users because of their high dwell time but their
headlines were not interesting enough to motivate
users to click on the articles. However, those users
who read these articles spent a significant amount
of time reading them.
Indicator 2: High dwell time and high read count.
Articles close to indicator 2 had interesting
headlines since they had opened by many users,
and the articles were interesting as well because of
their high dwell time.
Indicator 3: Low dwell time but high read count.
Articles close to this indicator have high read count
but low dwell time. These headlines were
interesting for users, but their articles were not. We
call this type of headlines misleading headlines
since the articles do not meet the expectation of the
readers. As we can see in Figure 1, very few
articles reside in this group.
Indicator 4: Low dwell time and read count.
Headlines of these articles were not successful to
attract users and those who read them did not
spend much time reading them.
The probability that article a belongs to each
quality indicator i (i.e. P
a,i
) is calculated using
2
https://keras.io/layers/embeddings/
formula 2 which || ||
2
is the L
2
norm. Softmax function
is used to convert the calculated similarities into
probabilities.
⎣
⎢
⎢
⎡
𝑃
,
𝑃
,
𝑃
,
𝑃
,
⎦
⎥
⎥
⎤
𝑆𝑜𝑓𝑡𝑚𝑎𝑥
⎝
⎜
⎜
⎛
√
2
𝐶
,
1 𝐷
√
2
1 𝐶
,
1 𝐷
√
2
1 𝐶
, 𝐷
√
2
‖
𝐶
, 𝐷
‖
⎠
⎟
⎟
⎞
(2)
4 PREDICT HEADLINE
QUALITY
In this section, we propose a novel model to predict
the quality of unpublished news headlines. To the best
of our knowledge, we are the first to consider latent
features of headlines, bodies, and the semantic
relation between them to find the quality of news
headlines.
4.1 Problem Definition
We consider the task of headline quality prediction as
a multiclass classification problem. We assume our
input contains a dataset 𝐷
𝐻
,𝐴
of N news
articles that each news article contains a header and
an article which are shown by 𝐻
and 𝐴
,
respectively. An approach for learning the quality of
headline is to define a conditional probability
𝑃𝐼
| 𝐻
,𝐴
,𝜃 for each quality indicator I
j
with
respect to the header text (i.e., 𝐻
𝑡
,𝑡
,...,𝑡
),
article text (i.e., 𝐴
𝑧
,𝑧
,...,𝑧
), and
parameterized by a model with parameters 𝜃. We
then estimate our prediction for each news article in
our database as:
𝑦
𝑎𝑟𝑔𝑚𝑎𝑥
∈
,,,
𝑃𝐶
| 𝐻
,
𝐴
,𝜃
(3)
4.2 Proposed Model
In this section we propose a deep learning model to
predict the quality of headlines before publication.
The proposed model is implemented in python
language and will be put on authors’ GitHub account
after paper publication. The architecture of the
proposed model is illustrated in Figure 2.
4.2.1 Embedding Layer
This layer, which is available in Keras library
2
,
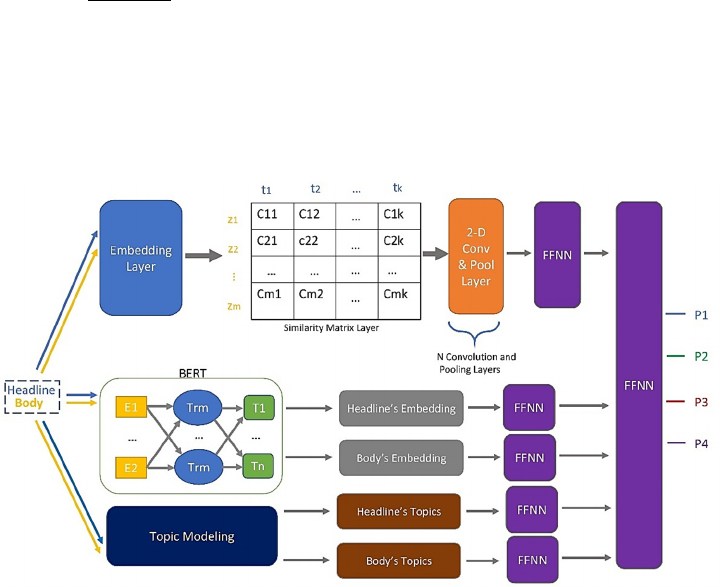
converts the one-hot-encoding of each word in
headlines and articles to the dense word embedding
vectors. The embedding vectors are initialized using
GloVe Embedding vectors (Pennington, Socher, &
Manning, 2014). We find that 100-dimensional
embedding vectors lead to the best result. Also, we
use a drop out layer on top of the embedding layer to
drop 0.2 percent of the output units.
4.2.2 Similarity Matrix Layer
Because one of the main characteristics of high-
quality headlines is that a headline should be related
to the body of its article, the main goal of this layer is
to find out how related each headline is to the article’s
body. Embedding vectors of the words of both the
headline and the first paragraph of the articles are the
inputs to this layer. We use the first paragraph of the
article since the first paragraph is used extensively for
news summarizing task due to its high importance to
representing the whole news article (Lopyrev, 2015).
In Figure 2, each cell c
i,j
represents the similarity
between words h
i
and b
j
from the headline and its
article, respectively, which is calculated using the
cosine similarity between their embedding vectors
using formula 4.
𝐶
𝑧⃗
𝑡
⃗
‖
𝑧⃗
‖
.𝑡
⃗
(4)
Using the cosine similarity function will enable
our model to capture the semantic relation between
the embedding vectors of two words z
i
and t
j
in the
article and header, respectively. Also, the 2-d
similarity matrix allows us to use 2-d CNN which has
shown great performance for text classification
through abstracting visual patterns from text data
(Pang et al., 2016). In fact, matching headline and
article is viewed as image recognition problem and 2-
d CNN is used to solve it.
4.2.3 Convolution and Max-Pooling Layers
Three Convolutional Network layers, each of which
contains 2-d CNN and 2-d Max-Pooling layers, are
used on top of the similarity matrix layer. The whole
Similarity Matrix is scanned by the first layer of 2-d
CNN to generate the first feature map. Different level
of matching patterns is extracted from the Similarity
Matrix in each Convolutional Network Layer based
on the formula 5.
𝑥
,
,
𝑓𝑤
,
,
. 𝑥
,
,
𝑏
,
(5)
𝑥
is the computed feature map at level l+1,
𝑤
,
is the k-th square kernel at the level l+1
which scans the whole feature map 𝑥
from the
previous layer, 𝑣
is the size of the kernel, 𝑏
are
the bias parameters at level l+1, and ReLU (Dahl et
al., 2013) is chosen to be the activation function f.
Then we will get feature maps by applying dynamic
pooling method (Socher, Huang, Pennington, Ng, &
Manning, 2011).
Figure 2: The proposed model for predicting news headlines' quality according to the four quality indicators.

We use (5*5), (3*3), and (3*3) for the size of
kernels, 8, 16, and 32 for the number of filters, and
(2*2) for the pool size in each Convolutional Network
layer, respectively. The result of the final 2-d Max-
Pooling layer is flattened to the 1-d vector. Then it
passes a drop out layer with the rate of 0.2. In the end,
the size of the output vector is reduced to 100 using a
fully-connected layer.
4.2.4 BERT
Google's Bidirectional Encoder Representations from
Transformers (BERT) (Devlin, Chang, Lee, &
Toutanova, 2018) is employed to transform variable-
length inputs, which are headlines and articles, into
fixed-length vectors for the purpose of finding the
latent features of both headlines and articles. BERT’s
goal is to produce a language model using the
Transformer model. Details regarding how Google
Transformer works is provided in (Vaswani et al.,
2017).
BERT is pre-trained on a huge dataset to learn the
general knowledge that can be used and combined
with the acquire knowledge on a small dataset. We
use the publicly available pre-trained BERT model
(i.e., BERT-Base, Uncased)
3
, published by Google.
After encoding each headline into a fixed-length
vector using BERT, a multi-layer perceptron is used
to project each encoded headline into a 100-d vector.
The same procedure is performed for the articles as
well.
4.2.5 Topic Modelling
We use None Negative Matrix Factorization (NNMF)
(J. Kim, He, & Park, 2014) and Latent Dirichlet
Allocation (LDA) (Hoffman, Blei, & Bach, 2010)
from Scikit-learn library to find topics from both
headlines and articles. Since headlines are
significantly shorter than articles, we use separate
topic models for headlines and articles. Even though
both NNMF and LDA can be used for topic modelling
their approach is totally different from each other in a
way that the former is based on linear algebra and the
latter relies on probabilistic graphical modelling. We
find out NNMF extracts more meaningful topics than
LDA on our news dataset.
We create matrix A, in which each article is
represented as a row and columns are the TF-IDF
values of article’s words. TF-IDF is an acronym for
term frequency - inverse document frequency which
is a statistical measure to show how important a word
is to an article in a group of articles. Term Frequency
3
https://github.com/google-research/bert\#pre-trainedmodels
(TF) part calculates how frequently a word appears in
an article divided by the total number of words in that
article. The Inverse Document Frequency (IDF) part
weighs down the frequent words while scaling up the
rare words in an entire corpus.
Then we use NNMF to factorize matrix A into two
matrices W and H which are document to topic matrix
and topic to word matrix, respectively. When these
two matrices multiplied, the result is the matrix A
with the lowest error (formula 6).
𝐴
𝑊
𝐻
(6)
In formula 6, n is the number of articles, v is the
size of vocabulary, and t is the number of topics (𝑡 ≪
𝑣) which we set it to 50. As it is shown in Figure 2,
we use topics (i.e., each rows of matrix W) as input
features to the Feedforward Neural Network (FFNN)
part of our model.
4.2.6 FFNN
As we can see in Figure 2, FFNN layers are used in
different parts of our proposed model. The rectifier is
used as the activation function of all layers except the
last one. The activation function of the last layer is
softmax which calculates the probability of the input
example being in each quality indicator. We find that
using a batch normalization layer before the
activation layer in all layers helps to reduce the loss
of our model since a batch normalization layer
normalizes the input to the activation function so that
the data are centred in the linear part of the activation
function.
5 RESULTS
5.1 Baselines
For evaluation, we have compared our proposed
model with the following baseline models.
5.1.1 EMB + 1-d CNN + FFNN
This embedding layer is similar to the embedding
layer of the proposed model which will convert one-
hot representation of the words to the dense 100-d
vectors. A drop out layer is used on top of the
embedding layer to drop 0.2 percent of the output
units. Also, we use GloVe embedding vectors to
initialize word embedding vectors (Pennington et al.,

2014). The next layer is 1-d CNN which works well
for identifying patterns within single spatial
dimension data such as text, time series, and signal.
Many recent NLP models employed 1-d CNN for text
classification tasks (Yin, Kann, Yu, & Schütze,
2017). The architecture is comprised of two layers of
convolution on top of the embedding layer. The last
layer is a single layer FFNN using softmax as its
activation function.
5.1.2 Doc2Vec + FFNN
Doc2Vec
4
is an implementation of the Paragraph
Vector model, which was proposed in (Le &
Mikolov, 2014). It is an unsupervised learning
algorithm that can learn fixed-length vector
representations for different length pieces of text such
as paragraphs and documents. The goal is to learn the
paragraph vectors by predicting the surrounding
words in contexts obtained from the paragraph. It
consists of two different models which are Paragraph
Vector Distributed Memory Model (PV-DMM) and
Paragraph Vector without word ordering Distributed
bag of words (PV-DBOW). The former has much
higher accuracy than the latter but the combination of
them yields to the best result.
We convert headlines and bodies into two
separate 100-d embedded vectors. These vectors are
fed into FFNN, which comprises of two hidden layers
with the size of 200 and 50 consecutively. ReLU is
used for the activation function of all FFNN layers
except the last layer which employs softmax function.
5.1.3 EMB + BGRU + FFNN
This is a Bidirectional Gated Recurrent Unit on top of
the Embedding layer. GRU employs two gates to trail
the input sequences without using separate memory
cells which are reset r
t
and update z
t
gates,
respectively.
𝑟
𝜎
𝑊
𝑥
𝑈
ℎ
𝑏
(7)
𝑧
𝜎
𝑊
𝑥
𝑈
ℎ
𝑏
(8)
ℎ
~
𝑡𝑎𝑛ℎ
𝑊
𝑥
𝑟
∗
𝑈
ℎ
𝑏
(9)
ℎ
1 𝑧
∗ ℎ
𝑧
∗ ℎ
~
(10)
In formulas 7 and 8, W
r
, U
r
, b
r
, W
z
, U
z
, b
z
are the
parameters of GRU that should be trained during the
training phase. Then, the candidate and new states
will be calculated at time t based on the formula 9 and
10, respectively.
In formulas 9 and 10, * denotes an elementwise
multiplication between the reset gate and the past
4
https://radimrehurek.com/gensim/models/doc2vec.html
state. So, it determines which part of the previous
state should be forgotten. And update gate in formula
10 determines which information from the past
should be kept and which one should be updated. The
forward way reads the post text from 𝑥
to 𝑥
and the
backward way reads the post text from 𝑥
to 𝑥
.
ℎ
⃗
𝐺𝑅𝑈
⃗
𝑥
,ℎ
⃗
(11)
ℎ
⃖
𝐺𝑅𝑈
⃖
𝑥
,ℎ
⃖
(12)
ℎ
ℎ
⃗
,ℎ
⃖
(13)
And the input to the FFNN layer is the
concatenation of the last output of forward way and
backward way.
5.1.4 EMB + BLSTM + FFNN
This is a Bidirectional Long Short Term Memory
(LSTM) (Hochreiter & Schmidhuber, 1997) on top of
the Embedding layer. Embedding and FFNN layers
are similar to the previous baseline. The only
difference here is using LSTM instead of using GRU.
5.2 Evaluation Metrics
Mean Absolute Error (MAE) and Relative Absolute
Error (RAE) are used to compare the result of the
proposed model with the result of the baseline models
on test dataset. As we can see in formula 14, RAE is
relative to a simple predictor, which is just the
average of the ground truth. The ground truth, the
predicted values and the average of the ground truth
are shown by 𝑃
, 𝑃
, and 𝑃
, respectively.
𝑅𝐴𝐸
∑∑
∑∑
(14)
5.3 Experimental Results
We train our proposed model with the same
configuration two times: once using hard labels (i.e.,
assigning a label 1 and three 0s to the quality
indicators for each sample) and the other time using
soft labels, which were calculate by formula 2. We
use categorical cross entropy loss function for the
former and MSE loss function for the latter. Then we
find out our proposed model will be trained more
efficiently by using soft targets than using hard
targets, same as what was shown in (Hinton, Vinyals,
& Dean, 2015). The reason could be that soft targets
provide more information per training example in
comparison with hard targets and much less variance
in the gradient between our training examples. For
instance, for the machine learning tasks such as
MNIST (LeCun, Bottou, Bengio, & Haffner, 1998),
one case of image 1 may be given probabilities 10
-6
and 10
-9
for being 7 and 9, respectively while for
another case of image 1 it may be the other way
round. So, we decide to train our proposed model and
all the baseline models just using soft targets.
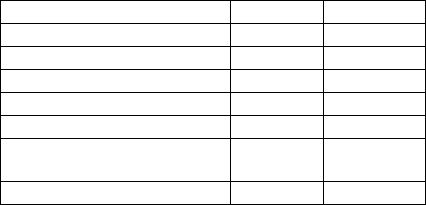
The results of the proposed model and baseline
models on the test data are shown in Table 1. The loss
function of the proposed model and all the baseline
models is based on the MSE between the predicted
quality indicators by the models and the ground truth
calculated in section 3.2 (Soft labels). And we use
Adam optimizer for the proposed model and all our
baseline models (Kingma & Ba, 2015). Also, we split
our dataset into train, validation, and test sets using
70, 10, and 20 percent of data, respectively.
Our proposed model got the best results by having
the lowest RAE among all the other models.
Surprisingly, TFIDF performs better than the other
baseline models. It can be due to the fact that the
number of articles in our dataset is not big (28751),
so complex baseline models may overfit to the
training data set.
Also, we are interested in finding the importance
of the latent features regarding the semantic relation
between headlines and articles. So, we have removed
embedding, similarity matrix, and 2-D CNN layers
from the proposed model. After making these
changes, RAE was increased by 6 percent in
comparison with the original proposed model. This
shows that measuring the similarity between article's
headline and body is beneficial for headline quality
prediction.
Table 1: Comparison between the proposed model and
baseline models.
Models MAE RAE
EMB + 1-D CNN + FFNN
0.044 105.08
Doc2Vec + FFNN
0.043 101.61
EMB + BLSTM + FFNN
0.041 97.92
EMB + BGRU + FFNN
0.039 94.38
TF-IDF + FFNN
0.038 89.28
Proposed Model without
Similarit
y
Matrix
0.036 86.1
Proposed Model 0.034 80.56
6 CONCLUSION
In this research, we proposed a method for calculating
the quality of the published news headlines with
regard to the four proposed quality indicators.
Moreover, we proposed a novel model to predict the
quality of headlines before their publication, using the
latent features of headlines, articles, and their
similarities. The experiment was conducted on a real
dataset obtained from a major Canadian newspaper.
The results showed the proposed model outperformed
all the baselines in terms of Mean Absolute Error
(MAE) and Relative Absolute Error (RAE) measures.
As headlines play an important role in catching the
attention of readers, the proposed method is of great
practical value for online news media.
ACKNOWLEDGEMENTS
This work is funded by Natural Science and
Engineering Research Council of Canada (NSERC),
The Globe and Mail, and the Big Data Research,
Analytics and Information Network (BRAIN)
Alliance established by the Ontario Research Fund –
Research Excellence Program (ORF-RE).
REFERENCES
Bielski, A., & Trzcinski, T. (2018). Understanding
Multimodal Popularity Prediction of Social Media
Videos With Self-Attention. IEEE Access, 6, 74277–
74287 https://doi.org/10.1109/ACCESS.2018.2884831
Cer, D., Yang, Y., Kong, S., Hua, N., Limtiaco, N., John,
R. S., … others. (2018). Universal sentence encoder.
ArXiv Preprint ArXiv:1803.11175.
Chakraborty, A., Paranjape, B., Kakarla, S., & Ganguly, N.
(2016). Stop Clickbait: Detecting and preventing
clickbaits in online news media. In 2016 IEEE/ACM
International Conf. on Advances in Social Networks
Analysis and Mining (ASONAM) (pp. 9–16). IEEE.
https://doi.org/10.1109/ASONAM.2016.7752207
Chakraborty, A., Sarkar, R., Mrigen, A., & Ganguly, N.
(2017). Tabloids in the Era of Social Media?
Understanding the Production and Consumption of
Clickbaits in Twitter. Retrieved from http://arxiv.
org/abs/1709.02957
Dahl, G. E., Sainath, T. N., & Hinton, G. E. (2013).
Improving deep neural networks for LVCSR using
rectified linear units and dropout. In ICASSP, IEEE
International Conference on Acoustics, Speech and
Signal Processing - Proceedings (pp. 8609–8613).
https://doi.org/10.1109/ICASSP.2013.6639346
Devlin, J., Chang, M.-W., Lee, K., & Toutanova, K. (2018).
BERT: Pre-training of Deep Bidirectional
Transformers for Language Understanding. Retrieved
from http://arxiv.org/abs/1810.04805
Ecker, U. K. H., Lewandowsky, S., Chang, E. P., & Pillai,
R. (2014). The effects of subtle misinformation in news
headlines. Journal of Experimental Psychology:
Applied. https://doi.org/10.1037/xap0000028
Fu, J., Liang, L., Zhou, X., & Zheng, J. (2017). A
Convolutional Neural Network for Clickbait Detection.
In 2017 4th International Conference on Information
Science and Control Engineering (ICISCE) (pp. 6–10).
Glenski, M., Ayton, E., Arendt, D., & Volkova, S. (2017).
Fishing for Clickbaits in Social Images and Texts with
Linguistically-Infused Neural Network Models. In
Clickbait Challenge 2017. Retrieved from http://arxiv.
org/abs/1710.06390
Hinton, G., Vinyals, O., & Dean, J. (2015). Distilling the
Knowledge in a Neural Network, 1–9. https://doi.org/
10.1063/1.4931082
Hochreiter, S., & Schmidhuber, J. (1997). Long Short-Term
Memory. Neural Computation, 9(8), 1735–1780.
https://doi.org/10.1162/neco.1997.9.8.1735
Hoffman, M. D., Blei, D. M., & Bach, F. (2010). Online
learning for Latent Dirichlet Allocation. In Advances in
Neural Information Processing Systems 23: 24th
Annual Conference on Neural Information Processing
Systems 2010, NIPS 2010.
Kim, J. H., Mantrach, A., Jaimes, A., & Oh, A. (2016). How
to Compete Online for News Audience, 1645–1654.
https://doi.org/10.1145/2939672.2939873
Kim, J., He, Y., & Park, H. (2014). Algorithms for
nonnegative matrix and tensor factorizations: A unified
view based on block coordinate descent framework.
Journal of Global Optimization, 58(2), 285–319.
https://doi.org/10.1007/s10898-013-0035-4
Kingma, D. P., & Ba, J. L. (2015). Adam: A method for
stochastic optimization. In 3rd International Conf. on
Learning Representations, ICLR 2015 - Conference
Track Proceedings.
Kuiken, J., Schuth, A., Spitters, M., & Marx, M. (2017).
Effective Headlines of Newspaper Articles in a Digital
Environment. Digital Journalism, 5(10), 1300–1314.
https://doi.org/10.1080/21670811.2017.1279978
Le, Q., & Mikolov, T. (2014). Distributed representations
of sentences and documents. In Proceedings of the 31st
International Conference on International Conference
on Machine Learning - Volume 32 (pp. II–1188).
JMLR.org. Retrieved from https://dl.acm.org/cita
tion.cfm?id=3045025
LeCun, Y., Bottou, L., Bengio, Y., & Haffner, P. (1998).
Gradient-based learning applied to document
recognition. Proceedings of the IEEE. https://doi.org/
10.1109/5.726791
Lopyrev, K. (2015). Generating News Headlines with
Recurrent Neural Networks, 1–9. https://doi.org/10.
1023/A
Martin Potthast, Tim Gollub, Matthias Hagen, and B. S.
(2017). The Clickbait Challenge 2017: Towards a
Regression Model for Clickbait Strength. In
Proceddings of the Clickbait Chhallenge.
Omidvar, A., Jiang, H., & An, A. (2018). Using Neural
Network for Identifying Clickbaits in Online News
Media. In Annual International Symposium on
Information Management and Big Data (pp. 220–232).
Palau-Sampio, D. (2016). Reference press metamorphosis
in the digital context: clickbait and tabloid strategies in
elpais.com. Communication & Society, 29(2).
Pang, L., Lan, Y., Guo, J., Xu, J., Wan, S., & Cheng, X.
(2016). Text Matching as Image Recognition, 2793–
2799. https://doi.org/10.1007/s001700170197
Pennington, J., Socher, R., & Manning, C. D. (2014).
GloVe: Global vectors for word representation. In
EMNLP 2014 - 2014 Conference on Empirical Methods
in Natural Language Processing, Proceedings of the
Conference. https://doi.org/10.3115/v1/d14-1162
Reis, J., Benevenuto, F., de Melo, P. O. S. V., Prates, R.,
Kwak, H., & An, J. (2015). Breaking the News: First
Impressions Matter on Online News, 357–366.
Retrieved from http://arxiv.org/abs/1503.07921
Rony, M. M. U., Hassan, N., & Yousuf, M. (2017). Diving
deep into clickbaits: Who use them to what extents in
which topics with what effects? In Proceedings of the
2017 IEEE/ACM International Conf. on Advances in
Social Networks Analysis and Mining 2017 (pp.232–239)
Socher, R., Huang, E. H., Pennington, J., Ng, A. Y., &
Manning, C. D. (2011). Dynamic pooling and unfolding
recursive autoencoders for paraphrase detection. In
Advances in Neural Information Processing Systems
24: 25th Annual Conference on Neural Information
Processing Systems 2011, NIPS 2011.
Stokowiec, W., Trzciński, T., Wołk, K., Marasek, K., &
Rokita, P. (2017). Shallow reading with deep learning:
Predicting popularity of online content using only its
title. In International Symposium on Methodologies for
Intelligent Systems (pp. 136–145).
Szymanski, T., Orellana-Rodriguez, C., & Keane, M. T.
(2017). Helping News Editors Write Better Headlines:
A Recommender to Improve the Keyword Contents &
Shareability of News Headlines. Retrieved from
http://arxiv.org/abs/1705.09656
Vaswani, A., Shazeer, N., Parmar, N., Uszkoreit, J., Jones,
L., Gomez, A. N., … Polosukhin, I. (2017). Attention
is all you need. In Advances in neural information
processing systems (pp. 5998–6008).
Venneti, L., & Alam, A. (2018). How Curiosity can be
modeled for a Clickbait Detector. Retrieved from
http://arxiv.org/abs/1806.04212
Voronov, A., Shen, Y., & Mondal, P. K. (2019).
Forecasting popularity of news article by title analyzing
with BN-LSTM network. In ACM International
Conference Proceeding Series (pp. 19–27). Association
for Computing Machinery. https://doi.org/10.1145/333
5656.3335679
Wei, W., & Wan, X. (2017). Learning to identify
ambiguous and misleading news headlines. IJCAI
International Joint Conference on Artificial
Intelligence, 4172–4178.
Yin, W., Kann, K., Yu, M., & Schütze, H. (2017).
Comparative Study of CNN and RNN for Natural
Language Processing. Retrieved from http://arxiv.org/
abs/1702.01923
Zhou, Y. (2017). Clickbait Detection in Tweets Using Self-
attentive Network. In Clickbait Challenge 2017.
Retrieved from http://arxiv.org/abs/1710.05364
