
Automated Rheumatic Heart Disease Detection from
Phonocardiogram in Cardiology Ward
Melkamu Hunegnaw Asmare
1,2,3
, Frehiwot Woldehanna
3
, Luc Janssens
1
and Bart Vanrumste
1,2
1
KU Leuven, Campus Group T, eMedia Research Lab, Leuven, Belgium
2
KU Leuven, Electrical Engineering Department (ESAT), STADIUS, Leuven, Belgium
3
Addis Ababa Institute of Technology, Center of Biomedical Engineering, Addis Ababa, Ethiopia
Keywords: Rheumatic Heart Disease, Machine Learning, Support Vector Machines, Phonocardiogram.
Abstract: Rheumatic Heart Disease (RHD) is a preventable and treatable form of cardiovascular diseases. It is also re-
ferred to as the ailment of the disadvantaged mainly affecting children and young adults. RHD is recognized
as a global health priority by World Health Organization. This chronic heart condition silently deteriorates the
normal function of the heart valves which can be detected as a heart murmur using a stethoscope. As the
cardiac auscultation process is an elusive process, the clinician will always be tempted to refer the patient for
expensive and sophisticated imaging procedures like echocardiography. In this study, a machine learning
algorithm is developed to augment the limitation in the auscultation process and transform the stethoscope as
a powerful screening tool. For this current study, an RHD heart sound data set is recorded from one hundred
seventy subjects. A total of twenty-six features are extracted to model murmur due to RHD. Twenty-four
classification and regression algorithms have been tested out of which the Cubic SVM has demonstrated su-
periority with a classification accuracy of 97.1%, with 98% sensitivity, 95.3 % of specificity 97.6% precision.
The corresponding positive predictive values (PPV) are 96% and 97% for normal and RHD respectively. The
results are based on data collected from a cardiology ward where there are more pathological cases than con-
trols. Hence it is a valuable detection tool in a cardiology clinic. But in the future, integrating this machine
learning algorithm with a mobile phone can be a powerful screening tool in places where access to echocar-
diography and cardiologist is difficult. Thus, it can then aid a timely, affordable and reliable detection tool
allowing a non-medically trained individual to screen and detect RHD.
1
INTRODUCTION
Due to the rapid epidemiological transition observed
in developing countries, not only communicable dis-
eases but also noncommunicable diseases are
becoming the major cause of death risks.
Cardiovascular diseases, cancer, chronic respiratory
disorders, and diabetes are the most common ones.
Among these, cardiovascular disorder takes the
leading role (WHOAnnualReport, 2013). Worldwide,
ischemic heart disease is the number one cause of
death, which affects males with age usually 65 or
more (Emelia J. Benjamin, 2019). However, RHD is
the leading cause of cardiovascular disorders in
middle- and low-income countries. The average age
is around 28 years with females affected twice as
much as men (Watkins DA, 2017).
RHD is caused by Group A streptococcal
Bacteria (GAS) infection. These bacteria are
normally found in the skin and in the throat of healthy
people. GAS is an important cause of throat infection.
In certain susceptible people, usually children, the
immune system becomes confused and attacks both
the GAS bacteria and parts of the host’s body. This
autoimmune at- tack causes the inflammation of the
joints, skin, brain and most importantly the heart
(Watkins DA, 2017). RHD is a chronic heart
condition and early in the dis- ease, there are usually
no symptoms. The disease can silently progress
especially after repeated episodes of infection. Each
episode brings renewed heart valve inflammation that
eventually leads to local scarring and distortion of the
valve architecture. First, the affected valve starts to
leak, normally referred to as re- gurgitation; later the
scarring can stop the valve from opening properly
and make it narrow for sufficient blood passage,
referred to as stenosis. These abnormalities create
unusually turbulent blood flow in the heart chambers
Asmare, M., Woldehanna, F., Janssens, L. and Vanrumste, B.
Automated Rheumatic Heart Disease Detection from Phonocardiogram in Cardiology Ward.
DOI: 10.5220/0009367108390844
In Proceedings of the 13th International Joint Conference on Biomedical Engineering Systems and Technologies (BIOSTEC 2020) - Volume 5: HEALTHINF, pages 839-844
ISBN: 978-989-758-398-8; ISSN: 2184-4305
Copyright
c
2022 by SCITEPRESS – Science and Technology Publications, Lda. All rights reserved
839
which is called heart murmur. Left untreated, RHD
will compromise the cardiac output of the patient
which will subsequently lead to pre- mature death
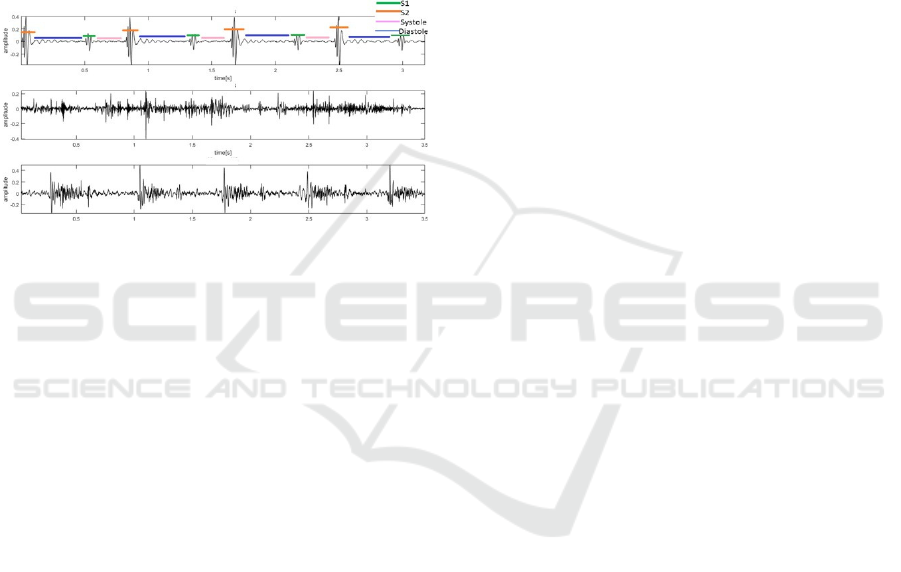
(Walsh, 2019). The heart sound wave- form has
distinct features called the first heart sound (S1), the
second heart sound (S2), systole and diastole parts.
Murmur normally presents itself in the systolic or
diastolic parts. The heart sound can be listened to
and recorded using a stethoscope in the form of a
phonocardiograph (PCG). A three second MATLAB
plot of clean, noisy and murmur types of heart sound
is shown in Fig. 1. The clean signal is manually
segmented to locate S1, S2, systole and diastole.
Figure 1: Time series representation of heart sounds: clean
heart sound with S1, S2, Systole and Diastole labelled (top),
noisy heart sound (middle), and heart sound with a murmur
(bottom).
The heart sound gives vital information about
cardiac wellbeing. However, even under ideal condi-
tions, the accuracy of diagnosis is very low (Pelech,
2004). This is in reality attributed to the inherent
limitation of the human auditory system to perform
accurate auscultation. On top of that, the listening
process is highly subjective. This usually forces
doctors to be highly dependent on other expensive
imaging devices like echocardiography and x-ray for
cardiac screening (Vukanovic-Criley JM, 2006).
To counter the subjectivity and the high percent-
age of diagnostic errors, computer-aided diagnostic
(CAD) systems can provide paramount importance
(Bozˇo
Tomas,
2007), (Belloni
and
Spoletini,
2007).
For the successful implementation of CADs, the qual-
ity of the input signal should be high. Such automa-
tion has been researched for over six decades now. In
the 1960s, one of the ground-breaking studies in the
automatic classification of heart sound pathology was
performed by (D. S. Gerbarg and Hofler, 1963). Since
then thousands of research papers have been
published. Some of the prominent works have been
properly investigated in the report published in 2016
by (Liu C1, 2016). This paper demonstrates the im-
portance of a well-characterized dataset for develop-
ing successful classification algorithms. This work
also assembles the largest heart sound dataset.
The 2016 PhysioNet Computing in Cardiology
Challenge was one of the most successful challenges
conducted by the program which attracted a large
number of researchers to solve the heart sound classi-
fication to normal and abnormal. In the competition,
the largest heart sound dataset compiled by (Liu C1,
2016) was provided. The winners of the competi-
tion, Potes et al. (Cristhian Potes, 2016) have devel-
oped a deep-learning-based classifier that combines
time-frequency features with a reported sensitivity of
96%, specificity of 80% and overall accuracy of 89%.
Almost all previously proposed algorithms needed
the segmentation of the heart sound recording into
first heart sound, second heart sound, systole, and di-
astole parts. This is a reasonable assumption which
may lead to pinpointing of abnormalities in the heart
sounds at specific temporal locations. However, the
complexity and also the error introduced in the accu-
rate localization of the segments have decreased the
performance of the algorithms.
Recently, P. Langley and A. Murray (Cristhian
Potes, 2017) have demonstrated the feasibility of
accurate classification without segmentation of the
heart sounds. The paper has a relatively lower overall
accuracy of 79% (specificity 80%, sensitivity 77%)
classification, and claims this is mainly due to the
quality of the dataset used. Despite the sheer volume
of research done in the area, the studies are critically
hampered by the lack of high- quality recordings that
have proper validation and standardization. This
would have created common formatting that allows
collaborative research, large- scale analytics, and
tools and methodologies to be shared. The largest
available open access data set is available which was
compiled by Liu et al. (Liu C1, 2016). It contains 2435
heart sound recordings from 1297 subjects. The
dataset consists of recordings from subjects with a
variety of abnormalities which include heart valve
damage and coronary artery disease. The maximum
overall accuracy reported in the literature by using this
database is only 94% which was achieved by
introducing different model optimization techniques
(Suhm, 2019).
D.B. Springer et al. (D.B. Springer, 2014) have
worked on a dataset that is recorded to classify an
RHD from normal heart sounds. A total of 318
recordings from 106 subjects where 40 were identi-
fied with RHD. Their aim was to detect systolic mur-
mur hence the heart sound is segmented before feature
extraction. A combination of MFCC and wavelet fea-
tures are used. SVM classification algorithm is used
by optimizing its parameters and the procedure is
validated using a 10-fold cross-validation technique.
Cognitive Health IT 2020 - Special Session on Machine Learning and Deep Learning Improve Preventive and Personalized Healthcare
840
They reported a maximum F1 score of only 0.7, the
sensitivity of 74.8% and specificity of 74.5%. Poor
quality recording and external generator noise were to
blame for such low performance. This demonstrates
the necessity for a large and reliable dataset which
takes into account specific pathology.
For the current study, we gathered one of the
largest available heart sound data set by recording it
from one hundred seventy subjects with a state-of-the-
art electronic stethoscope and addresses a particular
type of valvular heart disease called RHD. Twenty-
six different features are used and the features are
computed from a non-segmented data. These features
include time-domain components, frequency compo-
nents, and perceptual components. These features are
extracted from the entire signal to properly deal with
systolic as well as diastolic murmurs.
2
MATERIALS AND METHODS
2.1
Data Collection
The heart sound data was collected at Tikur Anbessa
Referral Teaching Hospital, College of Health Sci-
ences, Addis Ababa University, Addis Ababa,
Ethiopia from August 2018 to July 2019. The study
protocol was approved by the Research Ethics Com-
mittee of the Department of Internal Medicine (Ethi-
cal Clearance No: 014/2018).
The heart sound data were recorded from one
hundred seventy subjects, one hundred twenty four
were confirmed RHD patients (seventy four females,
fifty males) with ages from 9 to 47 with mean and SD
of 22.9±8.9 years. The time since the first diagnosis
is from two months to 20 years with mean and SD of
3.3±3.1 years. Each diagnosis is confirmed by
echocardiographic imaging and a cardiologist
analysis. There were 46 normal subjects (15 females,
31, males) with age 5 to 37 years with mean and SD
of 14.4±10.5 years. The electronic heart sound was
recorded by ThinklabsOne
TM
digital stethoscope with
a sampling frequency of 44.1KHz. An average of 3.88
minutes of recording per subject is acquired. The
digital stethoscope was positioned at the fifth
intercostal space around the midclavicular line to
properly record the mitral valve sound. The audio data
is transferred to a mobile phone and is saved as a wav
file.
2.2
Visualization
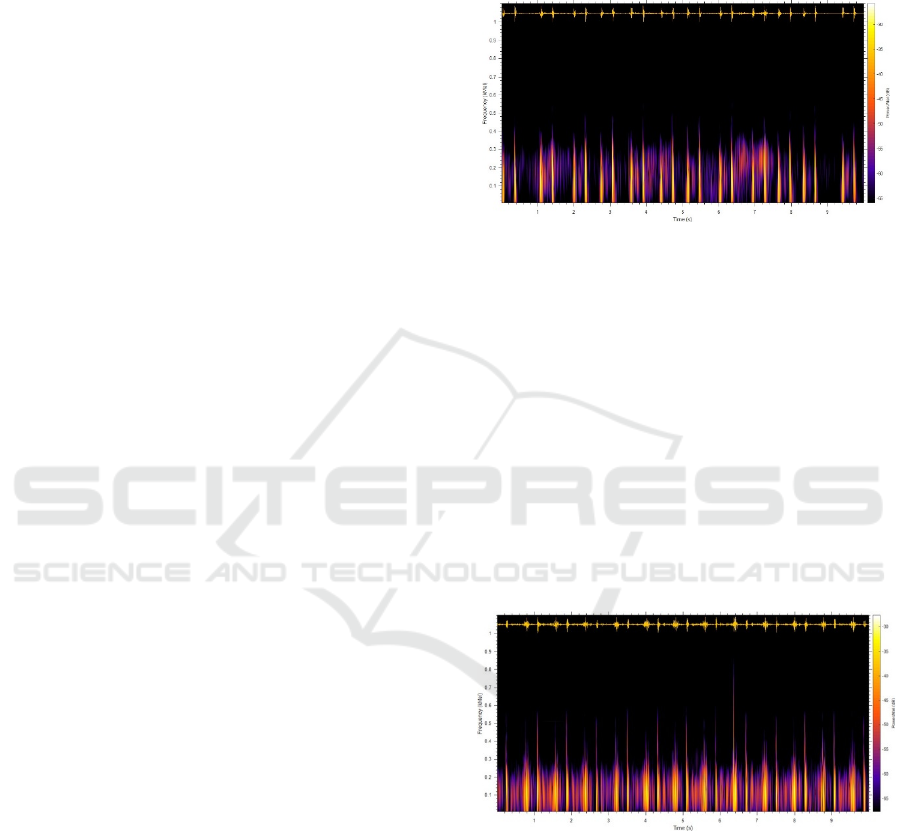
A ten-second waveform of a normal heart sound from
a healthy subject is shown in Fig. 2 (top). In this fig-
ure, the S1 and the S2 are clearly identifiable. Fig. 2
(bottom) shows the corresponding spectrogram to vi-
sualize how the energy is distributed over time. Clicks
and glitches which are common features of a murmur
can be very well visualized in the spectrogram.
Figure 2: Healthy Subject: Time domain wave from (top)
and spectrogram in Mel-frequency scale shown thermal col-
ormap
Instead of a linear scale, the Mel- frequency scale
is used to roughly resemble the resolution of the hu-
man auditory system. The spectrogram in the Mel-
frequency scale shows much of the spectral density
that belongs to S1 and S2 whereas systole and dias-
tole durations contain very little concentration. Fig. 3
shows is a recording from an RHD patient. In this
recording, S1 and S2 can still be easily identified.
However, looking at the corresponding spectrogram,
it can be seen that there is a significant amount of en-
ergy in the systole and diastole parts which indicates
the presence of murmur.
Figure 3: RHD Patient: Time domain wave from (top) and
spectrogram in Mel-frequency scale shown thermal color
map.
2.3
System Architecture
This section presents the complete workflow of devel-
oping a machine learning application to automatically
detect RHD. The data acquisition, pre-processing,
feature extraction, and classification steps are pre-
sented in detail. The classification performance of
various classification algorithms is also investigated.
Automated Rheumatic Heart Disease Detection from Phonocardiogram in Cardiology Ward
841
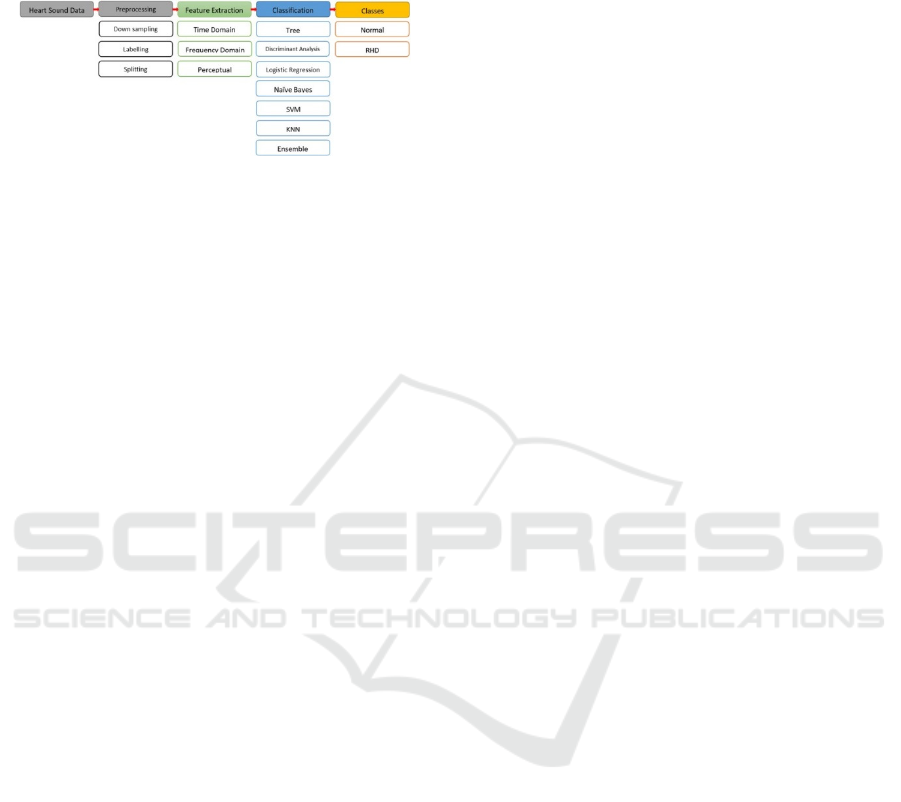
The overall architecture of the system is shown in
Fig. 4. Detail explanation of all the steps is presented
below.
Figure 4: Overall System Architecture.
2.3.1
Pre-processing
The original data is sampled at 44.1kHz. Experiments
conducted at a sampling rate greater than or equal to
2kHz showed that the performance of the classifica-
tion algorithm is not significantly affected. Hence, the
data is down sampled to 2kHz. Each record is labelled
as Normal and RHD based on echocardiography anal-
ysis and cardiologist decision. The records are split to
more manageable windows of 5 seconds and are ready
for feature extraction. As the data is recorded in an
uncontrolled environment and many of the record-
ings are corrupted by various types of noises such as
movement artefact, talking, mobile phone inter-
ference, traffic sound, coughing, lung sounds, gas-
trointestinal sounds, pounding and clicks due to high
volume recording. However, no filtering or noise re-
moval was done on the data to make sure that the sys-
tem resembles a real practice scenario.
2.3.2
Feature Extraction
In RHD patients, auscultation reveals the
characteristic systolic murmur of mitral regurgitation.
When the disease progresses, an additional diastolic
murmur may also be present. The intensity of the
murmur generally correlates with the severity of the
disease
(Liesl
Zu¨hlke,
2019).
Different
representations
of
the recorded heart sound are required to detect these
abnormalities. In the literature, several features are
proposed in order to properly characterize murmur
due
to
RHD
(Zu¨mray
Dokur,
2009).
These
features
are extracted from the entire signal to properly deal
with systolic as well as diastolic murmurs. Finally,
twenty six features were extracted which include
Time Domain Features (Median, Standard Deviation,
Mean Absolution Deviation, 25
th
percentile, 75
th
percentile, Inter Quartile Distance, Skewness,
Kurtosis), Frequency Domain Features (Shannon’s
Energy, Spectral Entropy, Dominant Frequency,
Energy Magnitude at the Dominant Frequency,
Dominant Frequency Ratio), and Perceptual Features
which first thirteen elements of the Mel frequency
cepstral coefficients (MFCC). Table 1 presents the
formulas and descriptions used in computing the
above features.
2.3.3
Classification
There exist several machine learning algorithms spe-
cially tailored for predictive modeling. Selecting the
best one is usually a tradeoff between speed of train-
ing, memory usage and predictive accuracy on new
data. In medical applications, not only the accuracy
but also specificity and sensitivity are also important.
Several existing classification algorithms are exper-
imentally compared to our heart sound dataset col-
lected from one hundred seventy subjects. Support
Vector Machines (SVM), K-Nearest Neighbor (KNN)
classification algorithms have found to classify the
data with superior accuracy.
2.3.4
Validation
The classification performance of the different algo-
rithms is compared by the overall accuracy, sensitiv-
ity, specificity and F1-Score on the 30% holdout val-
idation data. The confusion matrix is also computed.
Table 2 presents the validation parameters and corre-
sponding formulas.
3
RESULTS
Two experiments are conducted to evaluate the
classification performance of Cubic SVM and Fine
KNN. The experimental results are shown in Table 3.
3.1
Experiment I
The first experiment is done on our collected heart
sound data. This set has a total of 170 subjects (124
confirmed RHD patients and 46 Normal Subjects). A
total of 3957 (2886 RHD and 1071 Normal) records
with a 10-second duration are used. This data is
further split into 5-second intervals as mentioned in
the pre-processing step. The data is recorded in an
uncontrolled environment and many of the record-
ings are corrupted by various types of noises such as
movement artefact, talking, mobile phone interfer-
ence, traffic sound, coughing, lung sounds, gastroin-
testinal sounds, pounding and clicks due to high vol-
ume recording. No pre-processing or removal of the
data was done to simulate an actual auscultation en-
vironment. For this setup, Cubic SVM has an over-
Cognitive Health IT 2020 - Special Session on Machine Learning and Deep Learning Improve Preventive and Personalized Healthcare
842
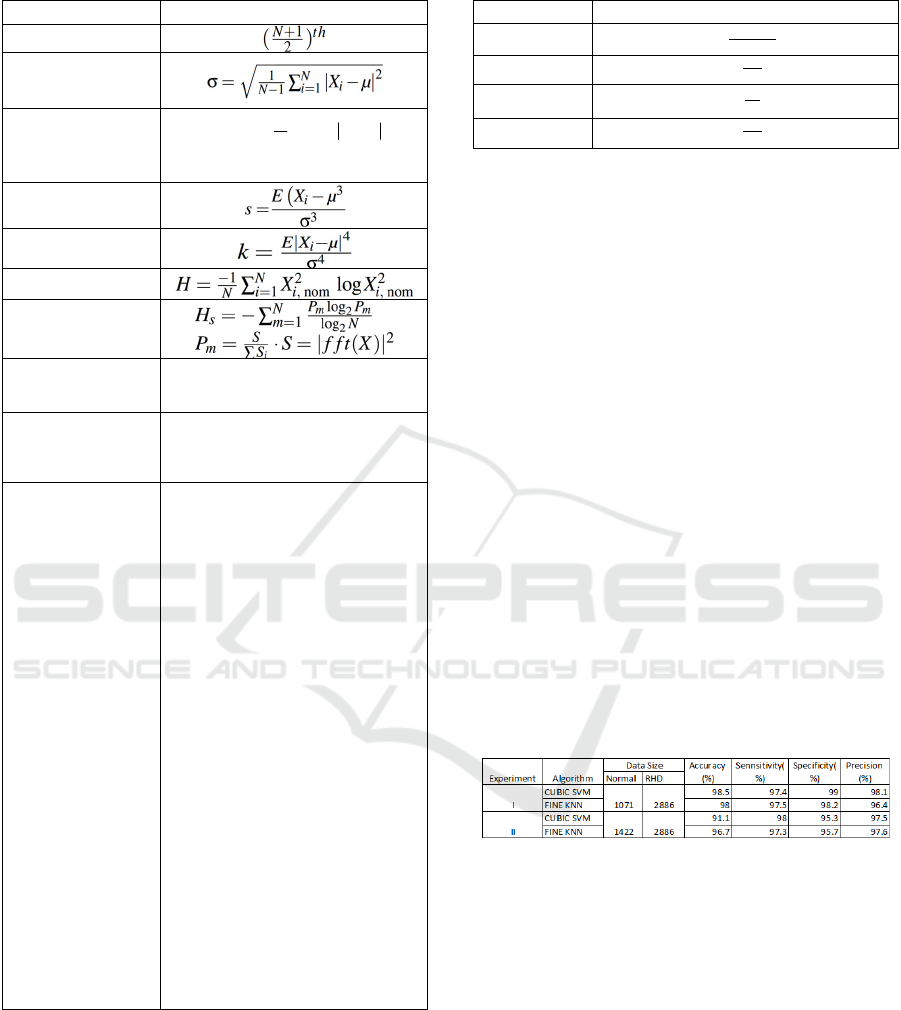
Table 1: Formulas and description to compute features.
Feature
Formula /Description
Median
Standard Deviatio
n
Mean Absolute
deviation
1
1
mean.dev(x)
N
i
i
X
N
μ
=
=−
X is the heart sound Signal
Skewness
Kurtosis
Shannon Entropy
Spectral Entropy
Dominant
Frequency
The frequency at which the
maximum of the spectrum occurs
Dominant
Frequency ratio
The ratio of the energy of the
maximum to the total energy of
the signal
Mel-frequency
Cepstral
Coefficients
The steps followed are:
1.
preemphasise heart sound
signal using a first-order FIR filter
with preemphasis coefficient of
0.97.
2.
Computer short-time Fourier
transforms.
3.
Magnitude spectrum com-
putation followed by filter bank
design with 20 triangular filters
uniformly spaced on the Mel scale
between 10Hz and 700Hz to span
the standard frequency range of
heart sounds.
4.
The filter bank is applied to
the magnitude spectrum values to
produce filter bank energies
(FBEs) (20 per frame)
5.
Log-compressed FBEs are
then decorrelated using the
discrete cosine transform to
produce cepstral coefficients.
6.
apply sinusoidal lifter to
produce liftered MFCCs.
all accuracy of 98.5% with 97.4% sensitivity,
99.0% specificity, and 98.1% precision. The
corresponding PPV is 98% for normal and 99% for
RHD.
Table 2: Validation Parameters.
Paramete
r
Formula
Accuracy
T p
+
Tn
T
p
+
Tn
+
F
p
+
Fn
Sensitivity
T p
T p
+
F p
Specificity
Tn
Tn
+
F p
Precision
T p
T p
+
F p
3.2
Experiment II
It is noted that both the training and validation sets are
unbalanced. This can only demonstrate a clinical
setup where there are more positives than negatives.
This second experiment is done to check the ro-
bustness of the system against noise and different
recording environments. For this purpose, 231 clean
heart sound recordings from normal subjects and 120
heart sound recordings with a substantial amount of
background noise and distortion are included from the
Bentley et al. (Bentley et al., 2011) open dataset.
These data are collected using iStethoscope ProTM
iPhone app and DigiScopeTM from the general
public and clinical trials. A total of 4308 (2886 RHD
and 1422 Normal) records with a 10-second duration
is used for this experiment. The data is further split
into a 5-second duration as mentioned in the pre-
processing step. The Cubic SVM algorithm has again
proved to be resilient to the noise by achieved 97.1%
accuracy with 98% sensitivity, 95.3% of specificity
and 97.6% precision. The corresponding PPV values
are 96% for normal and 97% for RHD.
Table 3: Experimental Results.
4
DISCUSSION AND
CONCLUSIONS
Although heart sounds can actually tell you a lot about
a patient, auscultation proficiency is declining fast.
This is mainly due to the intrinsic weakness of the
human auditory system and the technical ability gap
in which a clinician can explain why I need to know it
where there is more advanced technology to do it. Due
to this instead of auscultation, echocardiography is
considered as a gold standard to screen and diagnose
valve damage in the heart. Unfortunately, in
developing countries, such an advanced device is very
expensive and cardiologists who can use it are rare.
Automated Rheumatic Heart Disease Detection from Phonocardiogram in Cardiology Ward
843

To make matters worse, the burden of cardio-vascular
disease due to the non-curable but treatable and
preventable rheumatic heart disease is very high in
these countries. The damage to the heart valves due to
RHD can be reduced if it is detected early. The most
straightforward and cheapest approach to detect
valvular damage is detected by listening to the heart
murmurs. In this study, one of the largest heart sound
dataset is collected. Using this dataset, a compre-
hensive machine learning method is deployed. This
study has demonstrated the performance of the ma-
chine learning algorithm with extensive characteriza-
tion methods to quantify and accurately classify heart
sounds of a normal and confirmed Rheumatic Heart
Disease. A total of 26 features that encompass time
domain, frequency domain, and perceptual character-
istics are carefully selected and computed. The results
of the current study are very promising with respect to
classification accuracy of 97.1 %, with 98 % sensitiv-
ity, 95.3 % specificity, and 97.6% precision and a pos-
itive predictive value of 99% in detecting RHD. Our
data depicts better results in terms of classification ac-
curacy, sensitivity, and specificity than previously re-
ported studies available on heart sound data. While
this study considers a specific type of heart disease,
the other studies were trying to model generic types
of heart diseases.
Furthermore, we hope that this technology cou-
pled with mobile phone devices can be used as a
screening tool in a clinical environment where access
to echocardiography and cardiologist is difficult. This
will make it a timely, affordable and reliable detec-
tion tool allowing a non-medically trained individual
to diagnose and screen for RHD.
REFERENCES
Belloni, D. Della Giustina, S. R. M. R. and Spoletini, E.
(2007). Towards a computer-aided diagnosis by means
of phonocardiogram signals”, industrial elec- tronics.
IEEE International Symposium.
Bentley, P., Nordehn, G., Coimbra, M., and Mannor, S.
(2011). The pascal classifying heart sound challenge
2011. CHSC2011.
Bozˇo
Tomas,
D.
Z.
(2007).
Heart
sound
lines
–
proposal
of
a novel heart auscultation assistant diagnosis tool,.
International Journal of Latest Trends in Engineering
and Technology.
Cristhian Potes, Saman Parvaneh, A. R. B. C. (2016). En-
semble of feature-based and deep learning-based clas-
sifiers for detection of abnormal heart sounds. Com-
puting in Cardiology.
Cristhian Potes, Saman Parvaneh, A. R. B. C. (2017). Heart
sound classification from unsegmented phonocardio-
grams. Physiol. Meas.
D. S. Gerbarg, A. Taranta, M. S. and Hofler, J. J. (1963).
Computer analysis of phonocardiograms. Progress in
Cardiovascular Diseases.
D.B. Springer, L. Z. B. M. L. T. G. C. (2014). Mobile
phone-based rheumatic heart disease diagnosis. IEEE
Conference on Appropriate Healthcare Technologies
for Low Resource Settings.
Emelia J. Benjamin, Paul Muntner, A. A. M. S. B.-C. W. C.
A. P. C. A. M. C. (2019). Heart disease and stroke
statistics—2019 update: A report from the american
heart association, volume 139, no. 10. Circulation.
Liesl
Zu¨hlke,
F.
P.
(2019).
Clinical
manifestations
and
di-
agnosis of rheumatic heart disease. UpToDate.
Liu C1, Springer D, L. Q. M. B. J. R.-C. F. C. F. (2016). An
open-access database for the evaluation of heart sound
algorithm. Physiol Meas.
Pelech, N. (2004). The physiology of cardiac auscultation.
Pediatric Clinic North America.
Suhm, B. (2019). Heart sound classifier. MATLAB Central
File Exchange.
Vukanovic-Criley JM, Criley S, W. C. B. J. G.-M. L. C. W.
N. W. C. J. (2006). Competency in cardiac exami-
nation skills in medical students, trainees, physicians,
and faculty: a multicenter study. Arch Intern Med.
Walsh, J. C. A. B. G. M. W. (2019). In The Australian
guideline for prevention, diagnosis, and management of
acute rheumatic fever and rheumatic heart disease.
Australia RHD.
Watkins DA, Johnson CO, C. S. K. G. B. A.-B. G. (2017).
Global, regional, and national burden of rheumatic
heart disease, 1990-2015. New England Journal of
Medicine.
WHO Annual Report (2013). WHO global action plan for
the prevention and control of noncommunicable dis-
eases 2013–2020. WHO.
Zu¨mray
Dokur,
T.
(2009).
Feature
determination
for
heart
sounds based on divergence analysis. Elsevier, Digital
Signal Processing.
Cognitive Health IT 2020 - Special Session on Machine Learning and Deep Learning Improve Preventive and Personalized Healthcare
844
