
Huff Model for Shopping Centre Assessment using Aggregated
Mobile Phone Data
Irina Arhipova
1a
, Gundars Berzins
1
, Aldis Erglis
1
, Evija Ansonska
1
,
Juris Binde
2
and Andris Kovalcuks
3
1
Faculty of Business, Management and Economics, University of Latvia, Aspazijas Boulevard 5, Riga, LV-1050, Latvia
2
Latvian Mobile Telephone, Ropazu Street 6, Riga, LV-1039, Latvia
3
Ltd. “KA”, Stabu Street 15-88, Riga, LV-1010, Latvia
juris.binde@lmt.lv, andris.kovalcuks@56n.digital
Keywords: Market Share, Gravity Model, Attractiveness.
Abstract: There are several models of gravity, one of which is Huff model. It calculates customer gravity probabilities
for existing locations of trade objects. In this study, aggregated mobile data-based approach using Huff model
to determine the market share of trading objects is developed. The mobile activity data is used to give a more
precise understanding of available number of potential customers in a certain territory of Latvia. By using the
mobile phone base station unique number of users per day in 2016 within an area of each shopping centre, it
is possible to determine the unique user share and ratio between shopping centres. The use of mobile data, as
well as other statistics and real estate appraisal data, provides the opportunity to create universal criteria for
location and shopping centre standardization to compare prices for similar real estates in a specific region.
The research results have shown that the mobile activity data could be applied in gravity-based Huff model
for estimation of retail attractiveness and market share.
1 INTRODUCTION
Market analysts have used four theoretical
approaches to analyze the potential and location of a
retail area: analogy models, regression models,
central location theory and retail gravity theory
(Aboolian, et al, 2007). Analog models use existing
data and growth models from similar retailers or
leasable areas. Regression models determine
potential sales based on such factors such as
population, income and number of households in the
region (De Beule, et al, 2014).
Central location theory states that customers are
willing to travel longer distances to shopping centres
with a relatively wide selection of goods. Gravity
models determine that customer groups are redirected
to specific locations due to such factors as the
distance to a shopping centre, the distance between
shopping centres, customers of a retail area, the size
of a shopping centre, location of competitors, etc.
(Friske & Choi, 2013).
a
https://orcid.org/0000-0003-1036-2024
There are several models of gravity (Anderson,
2011), one of them is Huff model, which calculates
customer gravity probabilities to existing locations of
trade objects. From these probabilities, sales potential
can be estimated for each location using income,
population or other factors.
Huff model depends on distance calculation using
the traditional Euclidean distance or travel time in the
street network. Other factors, such as sales volume,
product variety, and retail space, should be
considered when determining the attractiveness of a
trade area. Huff model is used to:
Display probability-based locations for trade
objects,
Model economic impact of new competitive store
locations;
Predict high and low potential trade areas
resulting from the development of a new trade
object (Fernández & Hendrix, 2013).
Huff's gravity model predicts that as the size of a
shopping centre increases, the probability that the
customer will prefer the location of the shopping
Arhipova, I., Berzins, G., Erglis, A., Ansonska, E., Binde, J. and Kovalcuks, A.
Huff Model for Shopping Centre Assessment using Aggregated Mobile Phone Data.
DOI: 10.5220/0009361400910097
In Proceedings of the 2nd International Conference on Finance, Economics, Management and IT Business (FEMIB 2020), pages 91-97
ISBN: 978-989-758-422-0
Copyright
c
2020 by SCITEPRESS – Science and Technology Publications, Lda. All rights reserved
91

centre increases. Similarly, as distance increases, the
probability that customers will visit a retail facility
decreases (1):
∑
(1)
where:
P
ij
is the probability that the customer will go from
the location i to the shopping centre location j;
S
j
is the size of the shopping centre in location j;
T
ij
is the travel time (or distance) from the
customer location i to the shopping centre location
j;
is a parameter that needs to be empirically
evaluated to reflect the impact of different types
of shopping travel time.
Other studies have developed gravity models
using Geographic Information System (GIS)
technologies for the train station catchment area
determining (Lin, et al, 2016), healthcare services
spatial access analysis and planning (Luo, 2014),
evaluation of new university site locations (Bruno &
Improta, 2008) and others.
To prove that the new technical solutions and in
this particular case mobile data availability allow
developing applications of mobile data in multiple
fields, the cooperation with the largest mobile
operator in Latvia from 2016 to 2018 implemented a
cooperation project for updatable Latvian regional
business index development (Arhipova, et al, 2019).
This research has generated substantial
knowledge and data to work on multiple business user
cases in real estate, retail related and utility business
sectors where the mobile telecommunication data can
be used as a tool to optimize business decisions and
test assumptions for long-term strategic investment
decisions. Researchers at the University of Latvia, in
collaboration with leading real estate experts, have
developed a user case for shopping centers
attractiveness evaluation.
According to the latest data, shopping center stock
in Riga, the capital city of Latvia, significantly
changed during 2018 and 2019. During the last two
years, the expansion of several existing shopping
centers and new projects was finished. IKEA opened
its first shopping center near Riga with the total area
of 34 500 m
2
. A year later, in 2019, one shopping
center was opened – Akropole Riga (adding more
than 60 000 m
2
of new leasable retail space) and Alfa
expansion (adding 18 300 m
2
and providing a total
gross leasable area of 66 000 m
2
) was commissioned.
There is also Origo expansion that could be finished
in 2020, thus increasing the leasable retail stock by
additional 16 500 m
2
(CBRE Baltics, 2018).
Riga as capital of Latvia had 649 000 m
2
of total
leasable space in shopping centers by the end of 2018.
The vacancy rate of shopping centers in Riga was
around 4%. Economic growth, salary grows by 6 to 7
percent in recent years, and subsequentially
consumption increase activity on the retail market in
2018. At the same year two large shopping center sale
transactions took place in Riga. The 24 300 m
2
Galleria Riga shopping center was purchased by the
East Capital Baltic Property Fund and the 18 000 m
2
Dole shopping center by the Premier Estates Ltd.
Details of the transactions have not been disclosed
(Realia Group, 2019).
The challenge of existing models is source data
reliability that largely depends on the quality of
statistics gathered or obtained from statistics variety
of statistical sources. The study explores the use of
alternative data sources for shopping centres
attractiveness statistics based on mobile-data
obtained from mobile network providers.
The purpose of the study is developing and testing
a new aggregated mobile data-based approach to
estimate the market share for selected shopping
centers based on the Huff model. The new mobile
data-based modes will provide a more reliable source
for customer number probability estimates than
existing models.
2 HUFF MODEL
DEVELOPMENT, USING
MOBILE PHONE DATA
STATISTICS
Huff’s gravity model could be used with different
metrics to calculate gravity-based probabilities of
customers to each location using income, population
or other variables. It is very important that accurate
data about economic or social activity available for
specific territories. However, statistical data of people
living in a certain territory is not accurate and at same
time does not represent real number of people
available in this territory.
Therefore, for this research a mobile activity data
is used which gives a more precise understanding of
available number of potential customers in a certain
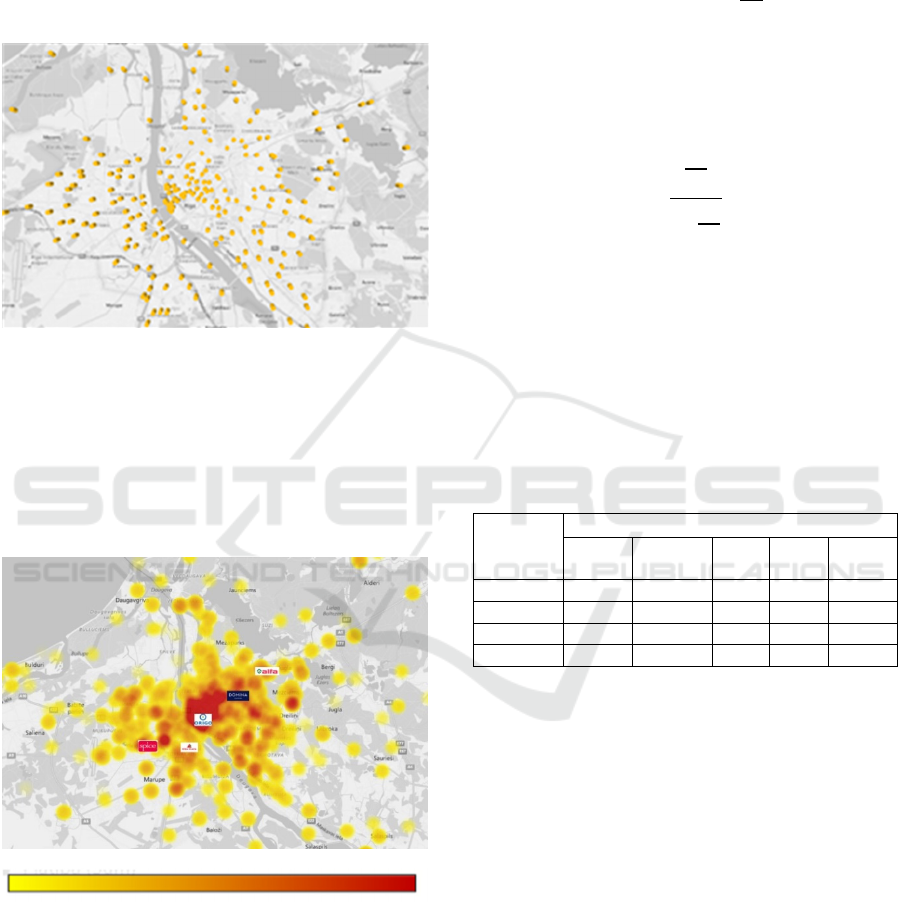
territory. Mobile activity data used from 297 mobile
base stations placed in capital of Latvia - Riga city
territory is used (Fig. 1).
Base stations are used as a geographic reference
instead of dividing territory in quadrants. Daily
FEMIB 2020 - 2nd International Conference on Finance, Economics, Management and IT Business
92
average unique mobile users are calculated for each
mobile base station for year 2016. Unique mobile
users represent unique devices (mobile users)
connected to mobile station in 15 minutes interval. To
avoid overlapping of potential and existing customers
all unique mobile users in 1 km radius from shopping
centre were excluded from further calculations.
Figure 1: Mobile phone base stations in Riga.
Huff's gravity model assumes that attractiveness
is based on the size and distance to shopping centres,
therefore the following two datasets were selected for
the analysis (Fig. 2):
Locations and size of 5 shopping centres
(j = 1,..,5)
Mobile network base stations (i = 1, .., 297).
The lowest mobile phone activity
The highest mobile phone activity
Figure 2: Shopping centres and mobile phone base stations.
To evaluate the probabilities of a customer
preference of shopping centre location, there are 3
steps:
Determine the distance from 5 shopping centres to
mobile phone base stations;
Determine the attractiveness of 5 shopping
centres, which are directly proportional to the
leasable area S
j
(m
2
) and inversely proportional to
the square of the distance T
ij
2
(2):
(2)
where j=1,…5; i=1,…,297.
Calculate the probabilities when customers from
each mobile phone base station’s area i are most
likely to go to each shopping centre j (3):
∑
(3)
where j=1,…,5; i=1,…297.
The Euclidean distance was used to determine the
distance (km) from 5 shopping centres to the mobile
network 297 base stations in Riga city area. For
example, the distance from # 100102 base station to
Riga Plaza shopping centre equals 4.49 km, but to
Origo shopping centre equals 2.02 km (Tab. 1).
Table 1: Example of the distances (km) from shopping
centres to base stations.
Base
station
#
Shopping centre
Riga
Plaza
Domina Alfa Spice Origo
100102 4.49 1.67 4.64 7.09 2.02
100103 4.20 1.70 4.74 7.01 1.75
100105 3.93 2.37 5.35 6.39 1.48
100409 0.97 6.44 9.34 4.35 3.32
2.1 Shopping Centre Attractiveness
Determination
Mobile phone base stations within a 1 km radius of
the shopping centre are excluded from further
analysis, because the actual mobile phone users are
already connected to the base stations as customers
with the probability tends to 1.
The attractiveness from all 297 base stations in
Riga territory and the total attractiveness are
calculated for 5 shopping centres. The overall
attractiveness from the base station area is calculated
as the sum of the attractiveness of all 5 shopping
centres. For example, the total attractiveness from
# 100102 base station equals 27064.4, but from
# 100409 base station equals 58549.9 (Tab. 2).
Huff Model for Shopping Centre Assessment using Aggregated Mobile Phone Data
93
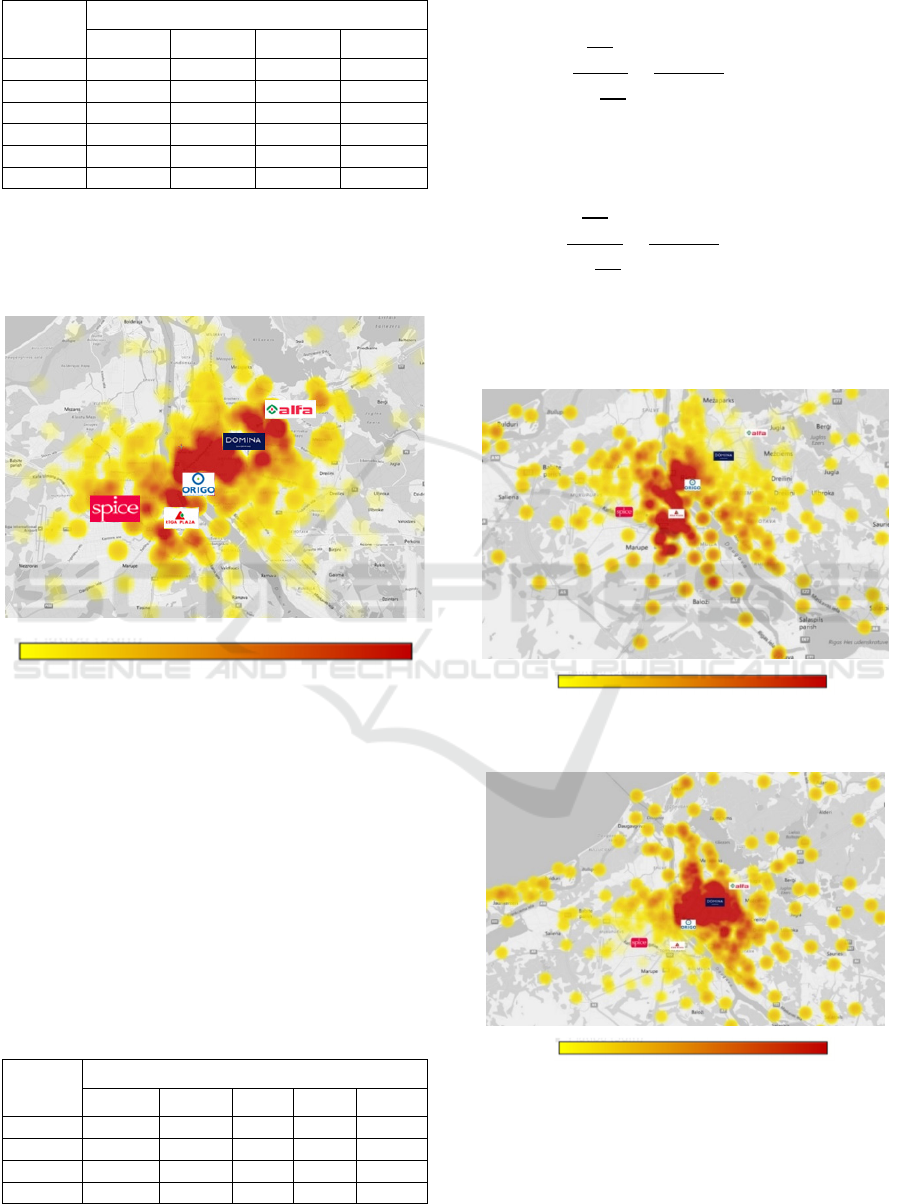
Table 2: Example of shopping centre attractiveness.
Shopping
centre
Base station #
100102 100103 100105 100409
Riga Plaza 2484.1 2830.3 3235.4 52947.5
Domina 16766.7 16112.6 8340.8 1129.3
Alfa 2227.3 2138.5 1676.2 550.4
Spice 814.5 834.5 1004.8 2162.5
Origo 4771.9 6292.9 8818.1 1760.3
Total
27064.4 28208.8 23075.3 58549.9
The overall attractiveness of shopping centres is
identified on the map from the mobile phone base
stations within 30 km surrounding area of Riga in
Figure 3.
The lowest attractiveness The highest attractiveness
Figure 3: Shopping centres attractiveness.
It can be concluded, that the Origo shopping
centre is the most attractive compared to other
shopping centres.
2.2 Shopping Centre Market Share
Probability Estimation
Using formula (3) the probabilities when customers
from each mobile phone base station area i are most
likely to go to the shopping centre j is calculated
(Tab. 3).
Table 3: Example of shopping centre market share
probability estimation.
Base
station
#
Shopping centre
Riga Plaza Domina Alfa Spice Origo
100102 9.2% 62.0% 8.2% 3.0% 17.6%
100103 10.0% 57.1% 7.6% 3.0% 22.3%
100105 14.0% 36.1% 7.3% 4.4% 38.2%
100409 90.4% 1.9% 0.9% 3.7% 3.0%
For example, probability that customers will go to
Riga Plaza from # 100102 base station equals (4):
∑
2484.1
27064.4
9.2%
(4)
In its turn, probability that customers will go to
Riga Plaza from # 100103 base station equals (5):
∑
2830.3
28208.8
10.0%
(5)
As a customer approaches a shopping centre, it
gains a higher market share, resulting in higher red
values (Fig. 4a - 4e).
0%
100%
Figure 4a: Riga Plaza shopping centre market share
probability estimation.
0%
100%
Figure 4b: Domina shopping centre market share
probability estimation.
FEMIB 2020 - 2nd International Conference on Finance, Economics, Management and IT Business
94
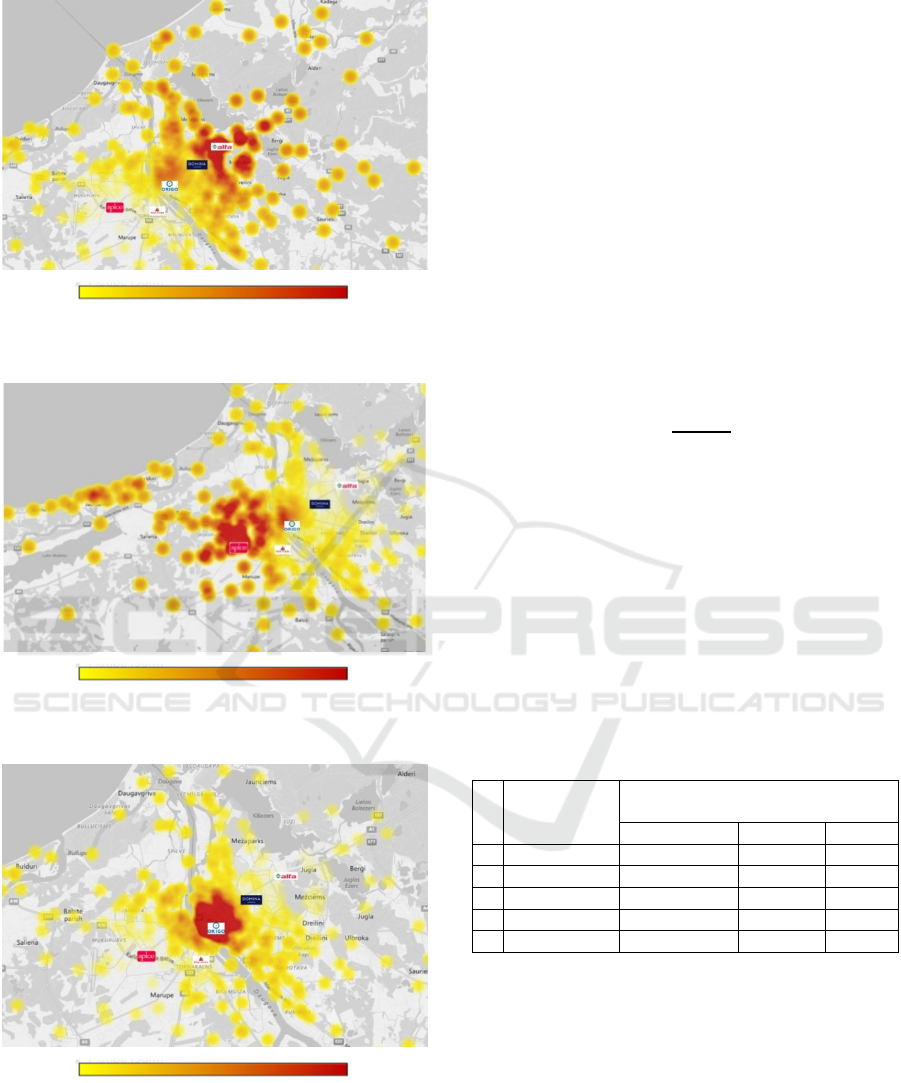
0% 100%
Figure 4c: Alfa shopping centre market share probability
estimation.
0% 100%
Figure 4d: Spice shopping centre market share probability
estimation.
0% 100%
Figure 4e: Origo shopping centre market share probability
estimation.
3 MARKET SHARE
ESTIMATION OF SHOPPING
CENTRE
To determine the number of potential customers C
j
for
a particular shopping centre j (average daily, monthly,
yearly), it is necessary to multiply the unique mobile
phone users N
i
(average daily, monthly, yearly) in
each base station area i with the probability P
ij
that
customers are likely to go to shopping centre j and
count them together (6):
(6)
Accordingly, the share of potential customers in
each shopping centre equals (7):
∑
(7)
It is possible to compare potential and actual share
of customers in each shopping centres. By using a
mobile phone base station unique number of users per
day in 2016 within a 1 km radius of each shopping
centre, it is possible to determine the unique user
share and ratio among shopping centres by selecting
Riga Plaza as 100%. Therefore, the market share of
potential customers within a radius of 1 km is the
highest for Origo – 58 %, and the lowest for Alfa –
only 7 %. (Tab. 4).
Table 4: Mobile phone unique users and potential
customers share within a 1 km radius of shopping centre.
#
Shopping
centre
Base station unique users and
potential customers
number per day share ratio
1 Riga Plaza 24 719 10 % 100 %
2 Domina 28 653 12 % 116 %
3 Alfa 17 583 7 % 71 %
4 Spice 31 042 13 % 126 %
5 Origo 143 800 58 % 582 %
By using Huff’s model, it is possible to determine
potential number of customers within a 10 km radius
of each shopping centre (5), the potential customers
share (6) and ratio between shopping centres by
selecting Riga Plaza as 100% (Tab. 5).
Comparing the obtained potential customer ratio
(Tab. 5) and actual ratio of customers in shopping
centres, it has concluded that the relationship between
shopping centres differed significantly from previous
results within a 1 km radius. This can be explained by
the fact that only 2 factors are used in the model: the
leasable area and the distance to the shopping centres
Huff Model for Shopping Centre Assessment using Aggregated Mobile Phone Data
95

from mobile phone base stations, without taking into
account other relevant factors, for example, the
presence of a train station in the case of Origo.
Therefore, it is necessary to add to the model other
factors or to multiply the number of potential
customers by a coefficient based on the ratios within
a 1 km radius.
Table 5: Potential customers within a 10 km radius of
shopping centre.
#
Shopping
centre
Potential customers
number per day share ratio
1 Riga Plaza 415 925 21 % 100%
2 Domina 524 305 27 % 126%
3 Alfa 322 640 17 % 78%
4 Spice 296 272 15 % 71%
5 Origo 392 442 20 % 94%
Valuation of shopping centres in illiquid markets,
such as the capitals of the Baltic States, is the subject
to subjective fluctuations in valuation due to the lack
of comparable deals and the absence of analogous or
similar objects in the largest and unique facilities in
the Baltic region. There is an objective difficulty in
comparing shopping centres across a broader
geography because the information about different
markets is aggregated in different, incomparable
formats and the data is affected by many local factors.
There is a lack of standardized reference points for
comparing locations and retails objects. Using mobile
data, as well as other statistics and real estate
appraisal data, provides the opportunity to create
universal criteria for location and shopping centre
standardization to compare prices for similar real
estate in a specific region.
Huff model-based approach for shopping center
assessment has been validated using real data,
including shopping centre total leasable area
(thsd.
m
2
), share of the customers (%), value per purchase
(EUR) and the turnover (EUR/m
2
). The research
results show that the model with two distance and
leasable area factors is not sufficient for the practical
purposes and should be expanded by the other factors
for model usability increasing, such as sales volume,
turnover, customer service level, etc.
4 CONCLUSIONS
In this research, the new type of source data for
measuring customer retail potential and market share
analysis using mobile activity data has been
proposed. The results have shown that mobile activity
data could be used as alternative source data for the
gravity-based Huff model to estimate retail
attractiveness, market share, and potential customer.
Mobile activity data gives more precise and realistic
information about several potential customers in a
specific territory, therefore mobile activity data could
be used in the Huff model.
The finding also indicated the specific
requirements for conditions to obtain high-reliability
source data for the Huff model. Results indicate that
mobile base stations could be used as a reference to
customer location in urban territories with a large
number and density of mobile base stations. Mobile
station density should be evenly distributed across the
territory to avoid overfitting problems. The
granularity of available mobile activity data allows
the use of the Huff model for different periods not
losing accuracy.
The advantage of mobile data use for shopping
center market share estimates is the possibility to
constantly track market share fluctuations and
seasonal changes. The model provides reliable data
sources for potential customer estimates. The method
is relatively low cost compared with traditional
methods used.
There are several opportunities for future studies
of the gravity-based approach using mobile activity
data. It is possible to use more frequent information
on a weekly level that requires data from retail stores
on weekly basis such as turnover, gross profit,
number of purchases and putting it together with
mobile activity on weekly bases that could increase
prediction accuracy and explain the impact of
seasonal sales, special sales events, etc.
ACKNOWLEDGEMENTS
This work was supported by the University of Latvia
and KA Ltd. [grant number ZD2018/20712].
REFERENCES
Aboolian, R., Berman, O., Krass, D., 2007. Competitive
facility location and design problem. European Journal
of Operational Research, 182(1), pp.40–62.
Anderson, J., 2011. The Gravity Model. Annual Review of
Economics, 3(1), pp.133-160.
Arhipova, I., Berzins, G., Brekis, E., Opmanis, M., Binde,
J., Steinbuka, I., Kravcova, J., 2019. Pattern
Identification by Factor Analysis for Regions with
Similar Economic Activity Based on Mobile
Communication Data. Advances in Intelligent Systems
and Computing, 886, pp.561–569.
FEMIB 2020 - 2nd International Conference on Finance, Economics, Management and IT Business
96

Bruno, G., Improta, G., 2008. Using gravity models for the
evaluation of new university site locations: A case
study. Computers & Operations Research, 35(2),
pp.436-444.
De Beule, M., Van den Poel, D., Van de Weghe, N., 2014.
An extended Huff-model for robustly benchmarking
and predicting retail network performance. Applied
Geography, 46, pp.80-89.
Fernández, J., Hendrix, E.M.T., 2013. Recent insights in
Huff-like competitive facility location and design.
European Journal of Operational Research, 227,
pp.581–584.
Friske, W., Choi, S., 2013. Another look at retail gravitation
theory: History, Analysis, and Future Considerations.
Academy of Business Disciplines Journal, 5(1), pp.88-
106.
Lin, T., Xia, J., Robinson, T. P., Olaru, D., Smith, B.,
Taplin, J., Cao, B., 2016. Enhanced Huff model for
estimating Park and Ride (PnR) catchment areas in
Perth, WA. Journal of Transport Geography, 54,
pp.336–348.
Luo, J., 2014. Integrating the Huff Model and Floating
Catchment Area Methods to Analyze Spatial Access to
Healthcare Services. Transactions in GIS, 18(3),
pp.436-438.
Real estate market report. Baltic States Capitals Vilnius,
Riga, Tallinn, 2019, Realia Group, https://www.ober-
haus.lt/wp-content/uploads/Ober-Haus-Market-
Report-Baltic-States-2019.pdf#page=62
The Baltics anticipating new stock increases in the capitals.
Baltics Retail, H2 2017/Q1 2018, CBRE Baltics,
www.cbre.com/researchgateway
Huff Model for Shopping Centre Assessment using Aggregated Mobile Phone Data
97
