
Large-scale Clustering of People Diagnosed with Parkinson’s Disease
using Acoustic Analysis of Sustained Vowels: Findings in the
Parkinson’s Voice Initiative Study
Athanasios Tsanas
1a
and Siddharth Arora
2b
1
Usher Institute, Edinburgh Medical School, University of Edinburgh, U.K.
2
Department of Mathematics, University of Oxford, U.K.
Keywords: Acoustic Analysis, Clustering, Parkinson’s Disease, Parkinson’s Voice Initiative (PVI).
Abstract: The heterogeneity of symptoms in Parkinson’s Disease (PD) has motivated investigating PD subtypes using
cluster analysis techniques. Previous studies investigating PD clustering have typically focused on symptoms
assessed using standardized clinical evaluations and patient reported outcome measures. Here, we explore PD
subtype delineation using speech signals. We used data from the recently concluded Parkinson’s Voice
Initiative (PVI) study where sustained vowels were solicited and collected under non-controlled acoustic
conditions. We acoustically characterized 2097 sustained vowel /a/ recordings from 1138 PD participants
using 307 dysphonia measures which had previously been successfully used in applications including
differentiating healthy controls from PD participants, and matching speech dysphonia to the standard PD
clinical metric quantifying symptom severity. We applied unsupervised feature selection to obtain a concise
subset of the originally computed dysphonia measures and explored hierarchical clustering combined with
2D-data projections using t-distributed stochastic neighbor embedding to facilitate visual exploration of PD
subgroups. We computed four main clusters which provide tentative insights into different dominating
speech-associated pathologies. Collectively, these findings provide new insights into the nature of PD towards
exploring speech-PD data-driven subtyping.
1 INTRODUCTION
Parkinson’s Disease (PD) is a progressive
neurodegenerative disorder with continuously
increasing prevalence rates and growing burden for
national health systems (Dorsey et al., 2013). In 2016
there were approximately 6.1 million people
reportedly diagnosed with PD compared to 2.5
million people in 1990 (GBD, 2018). The primary PD
symptom constellation comprises tremor, rigidity,
bradykinesia, and postural stability. These fit within
the broader spectrum of variable factors including
motor, cognitive, and neuropsychiatric symptoms
(Olanow, Stern, Sethi 2009). PD is well reported as a
largely heterogeneous disease, which is further
accentuated with considerable heterogeneity in
individual patient symptom severity trajectories
(Fereshtehnejad et al., 2015).
a
https://orcid.org/0000-0002-0994-8100
b
https://orcid.org/0000-0001-6499-6941
Assigning PD participants into subtypes is
clinically important since homogeneous groups
exhibit stronger clinical symptom manifestation and
potentially stronger genetic coherence. Therefore,
understanding different PD subtypes may lead to new
insights towards involved biological pathways, which
in turn may lead to better-informed, targeted
treatment strategies. In practice, PD group
membership may be achieved using some predefined
clinical intuition and criteria such as age onset and
dominating symptoms. Data-driven approaches to
delineate PD subtypes have received increasing
attention in the research community over the last few
years (Lewis et al., 2005; Selikhova et al., 2009;
Lawton, 2018). Indicative examples include using
clinico-pathological characteristics (Selikhova et al.,
2009), standardized clinical instruments to assess
motor, non-motor, and cognitive domains (Lawton,
2018), or sensor-based gait pattern analysis (Nguyen
Tsanas, A. and Arora, S.
Large-scale Clustering of People Diagnosed with Parkinson’s Disease using Acoustic Analysis of Sustained Vowels: Findings in the Parkinson’s Voice Initiative Study.
DOI: 10.5220/0009361203690376
In Proceedings of the 13th International Joint Conference on Biomedical Engineering Systems and Technologies (BIOSTEC 2020) - Volume 4: BIOSIGNALS, pages 369-376
ISBN: 978-989-758-398-8; ISSN: 2184-4305
Copyright
c
2022 by SCITEPRESS – Science and Technology Publications, Lda. All rights reser ved
369

et al. 2019). The use of different modalities or clinical
instruments to assess symptoms can potentially
provide new insights, but makes comparisons across
studies particularly challenging and may explain
discrepancies in the reported PD subtypes.
Crucially for the purposes of this study, speech is
very strongly associated with overall PD symptom
severity as assessed using standardized clinical
metrics (Tsanas, 2019) and 29% of people diagnosed
with PD consider it one of their most debilitating
symptoms (Hartelius and Svensson, 1994). Recent
studies have demonstrated the potential of speech
signals and in particular sustained vowel /a/
phonations in PD applications, e.g. to (1) differentiate
Healthy Controls (HC) from people diagnosed with
PD with almost 99% accuracy (Tsanas et al., 2012),
(2) accurately replicate the Unified Parkinson’s
Disease Rating Scale (UPDRS) (Tsanas et al., 2011),
which is the standard clinical tool to provide an
overall PD symptom assessment, and (3)
automatically assess voice rehabilitation (Tsanas et
al., 2014a). Recent work has also demonstrated the
potential of speech signals towards distinguishing
people with Leucine-Rich Repeat Kinase 2 (LRRK2)
associated PD, idiopathic PD, and HC (Arora et al.,
2018). Moreover, speech articulation kinematic
models to characterize PD dysarthria and provide
insights into the underlying vocal production
mechanism have been developed (Gomez et al.,
2019). Collectively, these studies and many others
demonstrate the enormous potential of using speech
signals in the context of PD analysis.
The aforementioned diverse problems rely on the
existence of clinical labels and belong to the
supervised learning paradigm. In situations where
clinical labels (i.e. outcomes of interest) are not
available, researchers typically resort to unsupervised
learning methods for data exploration. These
exploratory methods aim to decipher hidden patterns in
the data or provide the means towards understanding
the internal data structure e.g. with cluster analysis
methods (Hastie, Tibshirani, Friedman, 2009). Cluster
analysis aims to group together “similar” data samples
(also known as objects in the statistics parlance) and in
distinct groups data samples which are “different”.
There are numerous strategies and algorithms for
cluster analysis where the central notion is the concept
of computing similarity amongst objects (see Hastie,
Tibshirani, Friedman, 2009; Duda, Hart, Stork,
2001). In simple terms, each object is assigned (or
probabilistically assigned) cluster membership. The
resulting outputs of cluster analysis are known as
clusters or groups, and are often referred to as derived
subtypes in clinical applications.
Most studies aiming to report PD subtypes rely on
standard cluster analysis methods and in particular k-
means (e.g. Lewis et al., 2005; Lawton et al., 2018),
which is one of the simplest approaches but which is
known to have some fundamental drawbacks (Hastie,
Tibshirani, Friedman, 2009; Duda, Hart, Stork,
2001). Additional considerations in cluster analysis
include how to select a robust feature subset in an
unsupervised feature selection framework (Dy and
Brodley, 2004), potentially standardizing variables or
introducting weights for different variables, and
finally validating findings. Unfortunately many of the
finer details in the application of the end-to-end
cluster analysis methodology in clinical studies are
frequently not reported. For an overview of this field
(albeit using a different clinical application as an
exemplar), including highlighting shortfalls and
suggestions for best practice when reporting
clustering results we refer to Horne et al. (2020).
The aim of this study is to explore speech-PD
data-driven subtyping using cluster analysis methods
and provide tentative new insights into the nature of PD
speech symptoms. Towards this aim we acoustically
characterize sustained vowel /a/ phonations, determine
a subset of dysphonia measures using unsupervised
feature selecton, and experiment with different cluster
analysis and data visualization tools.
2 DATA
The PVI study solicited phone calls from participants
across seven major geographical locations
(Argentina, Brazil, Canada, Mexico, Spain, USA, and
the UK). People were requested to call a dedicated
phone number and contribute (1) basic demographic
information (age, gender), (2) self-report whether
they had been clinically diagnosed with PD, and (3)
two sustained vowel /a/ phonations. Following
standard voice assessment protocols participants
were instructed to sustain vowel /a/ for as long and as
steadily as possible (Titze, 2000). Recordings were
sampled at 8 kHz and stored on secure servers hosted
by Aculab.
In this study we only processed data from the PD
participants to investigate PD subtypes and discarded
data contributed by HC. Furthermore, we focus only on
the data from the US cohort (geographic location with
most data) to simplify analysis and avoid language
confounds which might be otherwise reflected in the
clustering results. In total, we processed 2097 sustained
vowel /a/ phonations from 1138 PD participants (605
males) with age (mean ± standard deviation):
63.7±10.8 years. For further details on the PVI study
SERPICO 2020 - Special Session on Mining Self-reported Outcome Measures, Clinical Assessments, and Non-invasive Sensor Data
Towards Facilitating Diagnosis, Longitudinal Monitoring, and Treatment
370

we refer to our previous work (Arora, Baghai-Ravary,
Tsanas, 2019; Tsanas and Arora, 2019).
3 METHODS
3.1 Data Pre-processing
We developed a speech recognition software which
automatically transcribed the participants’ responses
over the phone regarding age, gender, and self-
reported PD assessment. When the automated speech
recognition algorithm had less than 90% confidence
regarding the participants’ responses, the recordings
were aurally inspected. Furthermore, we developed
signal processing tools to screen out non-usable
recordings e.g. with excessive background noise.
For further details please see (Arora, Baghai-
Ravary, Tsanas, 2019).
3.2 Acoustic Characterization of
Sustained Vowel /a/ Phonations
We used the Voice Analysis Toolbox (freely available
on the first author’s website: https://www.darth-
group.com/software) to acoustically characterize each
sustained vowel /a/ phonation using 307 dysphonia
measures. The toolbox includes a range of widely
used dysphonia measures which have been developed
specifically to characterize sustained vowel /a/
phonations, and has been extensively validated in PD
applications (Tsanas et al., 2010; Tsanas et al., 2011;
Tsanas et al., 2012; Tsanas, 2012; Tsanas et al.,
2014a; Arora, Baghai-Ravary, Tsanas, 2019), and
other voice-related applications (Tsanas and Gomez-
Vilda, 2013; San Segundo, Tsanas, Gomez-Vilda,
2017). For the underlying rationale, conceptual basis
and physiological background, as well as the
algorithmic expressions for the computation of the
dysphonia measures we refer to (Tsanas, 2012;
Tsanas, 2013). A key component in speech signal
analysis which is frequently a prerequisite for the
computation of more advanced dysphonia measures
is the fundamental frequency (F0), and in particular
its time-varying property also known as F0 contour.
We used the SWIPE algorithm (Camacho and Harris,
2008), which we had previously demonstrated is the
most accurate F0 estimation algorithm in sustained
vowel /a/ phonations (Tsanas et al., 2014b). Overall,
applying the speech signal processing algorithms to
each of the phonations in the study resulted in a
2097×307 feature matrix which was subsequently
mined to determine possible cluster solutions. All
features are continuous random variables.
Before using the 307 features in the subsequent
stages we linearly scaled each feature to be in the
range [0, 1] so that no feature dominates others, in
accordance to the standard rule of thumb for distance-
based machine learning algorithms (Bishop, 2006).
3.3 Unsupervised Feature Selection
A high dimensional dataset may increase the noise to
signal ratio and obscure data structure and pattern
recognition algorithms. This standard problem is
known as the curse of dimensionality and is often
detrimental for the performance of machine learning
algorithms (Guyon et al. 2006; Hastie, Tibshirani,
Friedman, 2009). According to the general principle
of parsimony, it is desirable to develop a predictive
model which at the same time is as simple as possible,
i.e. via reducing the dimensionality of the input space.
This approach is known as dimensionality reduction,
and can be achieved either by feature transformation
(transforming the features to populate a new, lower
dimensional space), or by feature selection (choosing
a subset of features from the original feature set). The
latter is typically preferred in clinical settings because
it is desirable to retain the interpretability of the
original features (Guyon et al., 2006; Tsanas, Little,
McSharry, 2013).
In supervised learning frameworks, feature
selection can be wrapped around a well-defined
objective function capitalizing on the provided labels.
Feature selection in unsupervised learning setups is
less well defined and therefore more challenging (Dy
and Brodley, 2004). The aim is identifying
informative features supporting complex structures
embedded in the high-dimensional space, as Dy and
Brodley (2004) suggest: “The goal of feature
selection for unsupervised learning is to find the
smallest feature subset that best uncovers
“interesting natural” groupings (clusters) from data
according to the chosen criterion.”
Here, we used the algorithmic approach endorsed
by Yao et al. (2015) called i-Detect to select
informative features where the identified feature
subspace has the following property: the difference
between the total volume of the space spanned by the
selected feature subset and the sum of the volumes of
clusters in the embedded manifolds is maximized.
The i-Detect algorithm has two free hyper-parameters
which need to be optimized: the kernel width, and the
regularization parameter. Given that the algorithm is
not sensitive to the choice of the kernel width (Yao et
al. 2015), we focused only on experimenting with the
selection of the regularization parameter.
Large-scale Clustering of People Diagnosed with Parkinson’s Disease using Acoustic Analysis of Sustained Vowels: Findings in the
Parkinson’s Voice Initiative Study
371
Ultimately, the output of this unsupervised
feature selection algorithm is a feature weight vector
where many of the features are assigned to zero
weighting and hence can be eliminated. The
computed weights are then used to rank the original
features and decide on an appropriate cut-off.
3.4 Clustering
Clustering falls under the unsupervised learning
category and aims to provide some insight into the
structure of the data to and group objects based on the
similarity of the provided features. The output of a
clustering algorithm indicates the (probabilistic)
cluster membership of each object into the possible
clusters. There are many clustering algorithms in the
research literature, each with shortcomings and
different strategies to optimize performance.
In this study, we used hierarchical clustering
which is a popular cluster analysis method that has
often been successfully used in diverse applications
(Hastie, Tibshirani, Friedman, 2009). Unlike other
competing cluster analysis methods such as k-means,
hierarchical clustering does not require pre-
specifying the number of clusters in the data.
Hierarchical clustering constructs a dendrogram to
represent the data in a tree-based form, which
intuitively depicts how objects are grouped in the
form of different levels. The tree is recursively split
to form new clusters, aiming to maximize the between
group dissimilarity. For further background details
we refer readers to (Duda, Hart, and Stork 2004).
We used hierarchical clustering with Ward’s
linkage to cluster both the original high-dimensional
data and the lower-dimensional representation
obtained following unsupervised feature selection.
The number of clusters was determined following
visual inspection of the dendrogam in accordance
with Sheaves et al. (2016). In essence, we aim to find
a cut-off where there is considerable dissimilarity
difference between successive levels.
3.5 Data Visualization
We applied the t-distributed Stochastic Neighbor
Embedding (t-SNE) algorithm (van der Maaten and
Hinton, 2008) to visualize the data structure embedded
in the high-dimensional space (using the original 307-
dimensional space and also the feature space spanned
with the selected features). The resulting 2D data
representation can potentially provide new insights
following visual inspection and can also be used to
visually assess the cluster analysis results.
4 RESULTS
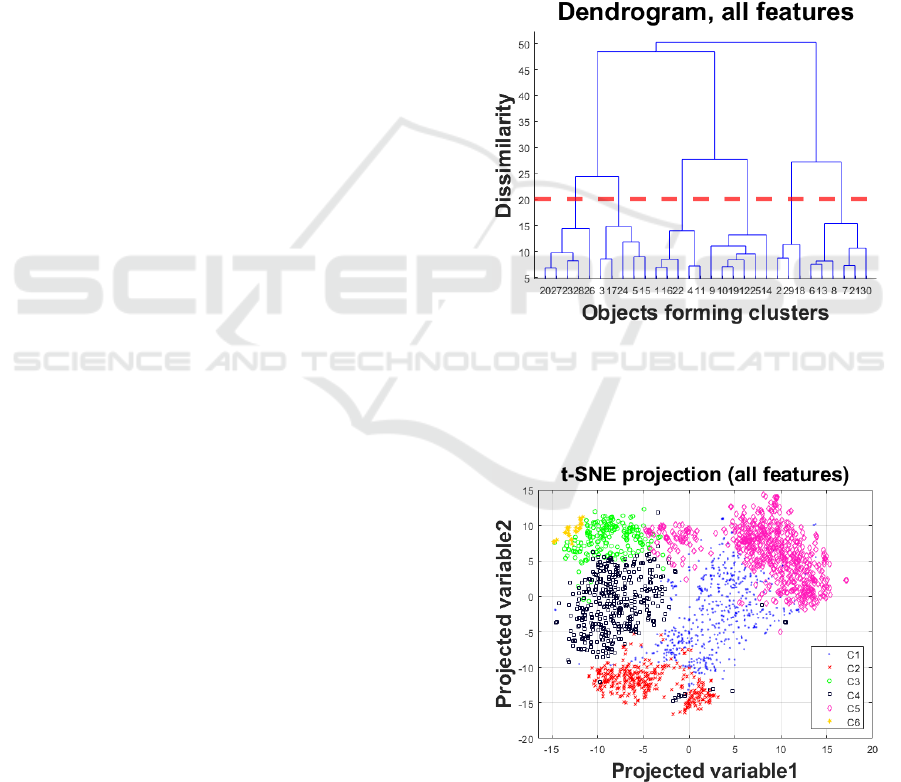
Figure 1 presents the dendrogram when using the
original high-dimensional feature set prior to feature
selection. Based on visual inspection, we decided to
opt for six clusters (highlighted with the dotted red
line). Following this, each object is assigned into a
cluster. We applied t-SNE to project the high-
dimensional data into a 2D space, using the cluster
labels to colour the two-dimensional objects in the
projected feature space (see Figure 2). We remark that
there is fairly good agreement (following visual
inspection) on the assigned clusters and the t-SNE 2D
projection.
Figure 1: Dendrogram for the hierarchical clustering with
Ward’s linkage to determine the number of clusters in the
analysis using all data. Following visual inspection we
decided to opt for six clusters (highlighted with the dotted
red line).
Figure 2: Two-dimensional representation of the original
high-dimensional dataset using t-SNE and marking the six
clusters (denoted C1…C6) computed using hierarchical
clustering with the original feature set (see dendrogram in
Figure 1).
SERPICO 2020 - Special Session on Mining Self-reported Outcome Measures, Clinical Assessments, and Non-invasive Sensor Data
Towards Facilitating Diagnosis, Longitudinal Monitoring, and Treatment
372
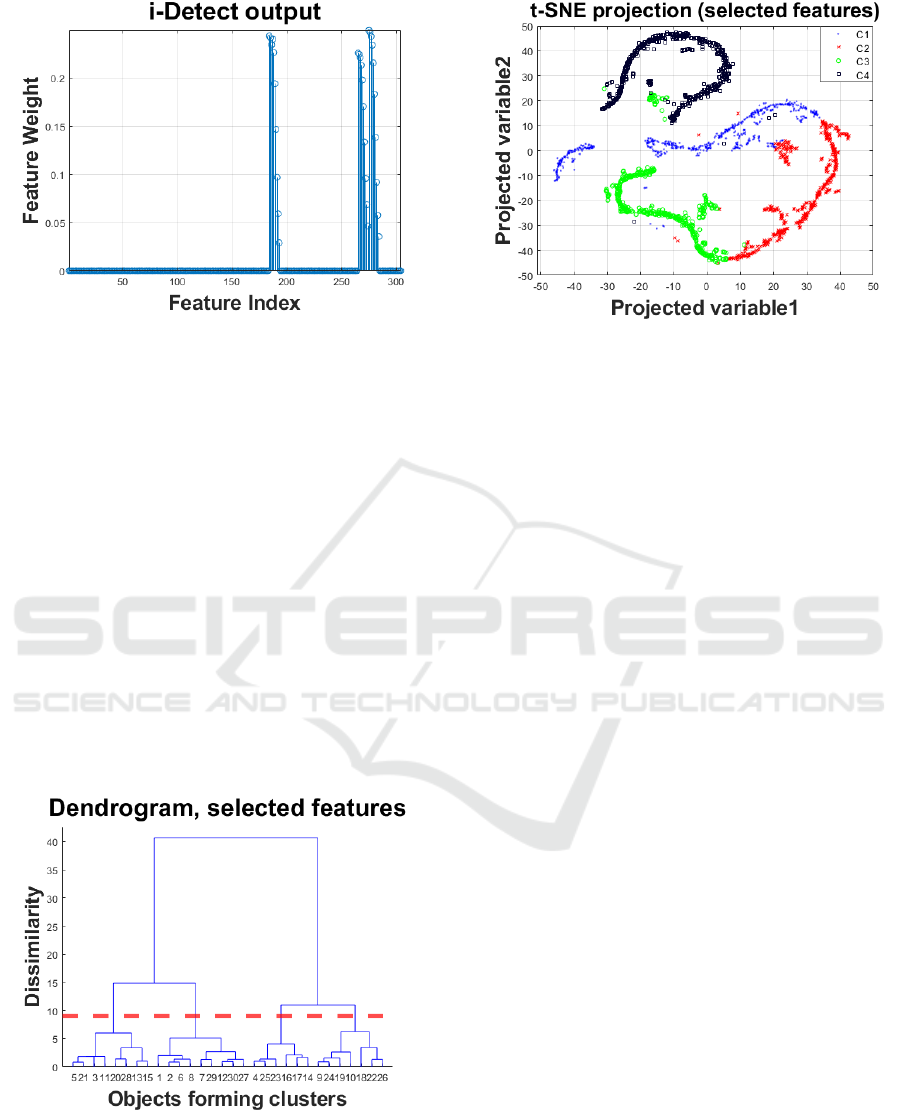
Figure 3: Output of the i-Detect algorithm assigning feature
weights resulting in unsupervised feature selection.
Figure 3 presents the output of i-Detect, denoting
the indices of the selected features associated with
non-zero weights (the vast majority of the features
were assigned zero weights and hence can be
eliminated from further processing). We set a cut-off
threshold at 0.05, which yielded 21 features. Overall,
the selected feature subset comprises primarily
wavelet-based features. We then repeated the process
with hierarchical clustering (Figure 4) and 2D
projection of the feature space spanned by the
selected feature subset (Figure 5). We note that this
time we decided on four clusters in the reduced
feature space following visual inspection of the
dendrogram, and again the 2D projection in Figure 5
is well aligned with the identified clusters. The
computed four clusters were relatively evenly
distributed with 458, 540, 577, and 522 objects in each.
Figure 4: Dendrogram for the hierarchical clustering with
Ward’s linkage to determine the number of clusters in the
analysis using all data. Following visual inspection we
decided to opt for six clusters (highlighted with the dotted
red line).
Figure 5: Two-dimensional representation of the dataset
with selected features (seen in Figure 3) using t-SNE and
marking the four clusters (denoted C1…C4) computed
using hierarchical clustering with the selected feature
subset (see Figure 4).
5 DISCUSSION
We explored the potential of processing features
extracted using acoustic analysis of sustained vowel
/a/ phonations in order to apply cluster analysis and
define PD subtypes. Using unsupervised feature
selection we determined a subset of 21 features from
the originally high-dimensional subset of 307
features. We reported that the 2097 PD phonations
used in the study could be clustered into four groups.
Therefore, in principle a new PD participant could be
phenotyped on the basis of a sustained vowel /a/
phonation to identify the PD group with which they
are similar. In turn, if we could interpret what these
clusters mean this may have important implications
regarding PD symptom trajectory and developing
better-targeted therapeutic strategies.
Interestingly, previous studies on PD subtyping
have also reported the identification of four groups
even though they had used very different data
modalities. For example, Lewis et al. (2005),
collected demographic, motor, mood, and cognitive
measures from 120 early-stage PD participants and
applied standard k-means cluster analysis which
resulted into four main subgroups: (1) younger PD
onset; (2) tremor-dominant; (3) non-tremor dominant
with considerable cognitive impairment and mild
depression; and (4) rapid disease progression but no
cognitive impairment. Lawton et al. (2018)
investigated motor, non-motor, and cognitive
domains expressed using standardized clinical
instruments on two large PD cohorts (1601 and 944
participants). They applied standard k-means
Large-scale Clustering of People Diagnosed with Parkinson’s Disease using Acoustic Analysis of Sustained Vowels: Findings in the
Parkinson’s Voice Initiative Study
373

clustering on the latent variables extracted through
factor analysis of the aggregate standardized
questionnaires, and reported four main subgroups: (1)
fast motor progression with symmetrical motor
disease, poor olfaction, cognition and postural
hypotension; (2) mild motor and non-motor disease
with intermediate motor progression; (3) severe
motor disease, poor psychological well-being and
poor sleep with an intermediate motor progression;
(4) slow motor progression with tremor-dominant,
unilateral disease. van Rooden et al. (2011) similarly
applied cluster analysis on two PD cohorts (344 and
357 participants) and reported four subgroups: (1)
mildly affected in all domains, (2) predominantly
severe motor complications, (3) affected mainly on
nondopaminergic domains with no major motor
complications, (4) severely affected across all
domains. Mu et al. (2017) employed k-means domain
clustering based on motor and non-motor symtoms in
PD using two cohorts (411 and 540 participants), and
similarly also reported finding four clusters: (1) mild,
(2) non-motor dominant, (3) motor-dominant, and (4)
severe.
Although there appear quite clear differences in
the distributions of the selected features
corresponding to each of the four clusters (results not
shown) it is difficult to associate those with specific
vocal performance degradation symptoms. In all
cases, the wavelet coefficients used here correspond
to expressing uncertainties in the F0. Moreover, it is
not clear whether and how well the four identified
clusters on the basis of the acoustic features extracted
from the sustained vowel /a/ phonations match with
the PD symptoms using in previous studies (Lewis et
al. 2005; van Rooden et al., 2011; Lawton et al.,
2018). Unfortunately, additional modalities or
UPDRS assessments are not available in the PVI
dataset, and other studies which have longitudinal
clinical evaluations and patient reported outcome
measures do not have speech signal recordings which
would enable to explore bridging this gap.
The 2D projected feature space using t-SNE was
intuitively appealing both when using the original
high-dimensional dataset and also with the selected
feature subset comprising 21 features: the clusters
identified using hierarchical clustering appear to be
generally well separated in the t-SNE derived scatter
plots. This suggests that there is indeed some inherent
underlying structure in the data, and that indeed the
unsupervised feature selection algorithm has
provided a feature subset that leads to some
meaningful natural grouping of the PD cohort.
The field of PD subtyping on the basis of voice
appears to have been scarcely investigated. Rueda
and Krishnan (2018) attempted cluster analysis
algorithms on the basis sustained vowel /a/ recordings
in 57 HC and 57 matched PD participants. However,
the limited sample size suggests there is no sufficient
statistical power to detect multiple clusters and hence
their findings should be interpreted very tentatively.
Moreover, mixing healthy controls with PD
participants by design is not aimed to deliver PD
subtypes but rather a more generic grouping of
voices. We only used data from the PVI US cohort in
this study. We decided to focus only on a single
cohort to avoid potential language confounds in the
design of cluster analysis; we are currently working
on generalizing findings to the other cohorts in PVI,
developing new insights when comparing derived
cluster groups across the different locations where PD
participants self-enrolled.
We envisage the PVI study and the findings
presented herein may contribute towards improving
understanding of the nature of PD subtypes and hence
potentially informing therapeutic interventions in
clinical practice (Triantafyllidis and Tsanas, 2019).
We are further exploring the PVI data to investigate
differences across PD cohorts at scale between
different geographical locations, both towards under-
standing differences versus HC and also internal
variability which may inform future clinical trials.
ACKNOWLEDGEMENTS
We are grateful to Max Little who led the Parkinson’s
Voice Initiative where the data for this study was
collected, and to Ladan Baghai-Ravary for
developing the data collection process using the
Aculab servers. We would like to extend our thanks
to all participants in the PVI study. The study was
made possible through generous funding via an
EPSRC-NCSML award to AT and SA.
REFERENCES
Arora, S. Visanji, N.P., Mestre, T.A., Tsanas, A., Al
Dakheel, A., Connolly, B.S., Gasca-Salas, C., Kern,
D.S., Jain, J., Slow, E.J., Faust-Socher, A., Lang, A.E.
Little, M.A., Marras C. 2018. Investigating voice as a
biomarker for leucine-rich repeat kinase 2-associated
Parkinson’s disease: a pilot study, Journal of
Parkinson’s Disease, Vol. 8(4), pp. 503-510
Arora, S., Baghai-Ravary, L., Tsanas A. 2019. Developing
a large scale population screening tool for the
assessment of Parkinson’s disease using telephone-
quality speech, Journal of Acoustical Society of
America, Vol. 145(5), 2871-2884
SERPICO 2020 - Special Session on Mining Self-reported Outcome Measures, Clinical Assessments, and Non-invasive Sensor Data
Towards Facilitating Diagnosis, Longitudinal Monitoring, and Treatment
374

Bishop, C.M. 2006. Pattern recognition and machine
learning, Springer
Camacho, A., Harris, J.G. 2008. A sawtooth waveform
inspired pitch estimator for speech and music, Journal
of the Acoustical Society of America, Vol. 124, 1638-
1652
Dorsey, E.R., George, B.P., Leff, B., Willis A.W. 2013. The
coming crisis: obtaining care for the growing burden of
neurodegenerative conditions, Neurology, Vol. 80,
1989-1996
Duda, R.O., Hart, P.E., Stork, D.G. 2001. Pattern
classification, Wiley-interscience, 2nd ed.
Dy, J.G., Brodley, C.E. 2004. Feature selection for
unsupervised learning, Journal of Machine Learning
Research, Vol. 5, 845-889
Fereshtehnejad, S.-M. et al. 2015. New clinical subtypes of
parkinson disease and their longitudinal progression: a
prospective cohort comparison with other
phenotypes. JAMA Neurology, Vol. 72, pp. 863–873
GBD 2016 Parkinson's Disease Collaborators 2018. Global,
regional, and national burden of Parkinson’s disease,
1990–2016: a systematic analysis for the Global Burden
of Disease Study 2016. The Lancet Neurology, Vol. 17,
pp. 939-953
Gomez-Vilda, P., Mykyska, J., Gomez, A., Palacios, D.,
Rodellar, V., Alvarez A. 2019. Characterization of
Parkinson’s disease dysarthria in terms of speech
articulation kinematics, Biomedical Signal Processing
and Control, Vol. 52, 312-320
Guyon, I., Gunn, S., Nikravesh, M., Zadeh, L.A. (Eds.)
2006. Feature Extraction: Foundations and
Applications, Springer
Hartelius L., Svensson P. 1994. Speech and swallowing
symptoms associated with parkinson‘s disease and
multiple sclerosis: A survey, Folia Phoniatr. Logop.,
Vol. 46, pp. 9- 17
Hastie, T. Tibshirani, R. Friedman J. 2009. The elements of
statistical learning: data mining, inference, and
prediction, Springer, 2nd ed.
Horne, E., Tibble, H. Sheikh, A., Tsanas A. 2020.
Challenges of clustering multimodal clinical data: a
review of applications in asthma subtyping, Journal of
Medical Internet Research (under review)
Lawton, M., Ben-Shlomo, Y., May, M.T., et al. 2018.
Developing and validating Parkinson’s disease
subtypes and their motor and cognitive progression,
Journal of Neurology, Neurosurgery and Psychiatry,
Vol. 89, pp. 1279-1287
Lewis, S.J.G., Foltynie, T., Blackwell, A.D., Robbins,
T.W., Owen, A.m., Barker R.A. 2005. Heterogeneity of
Parkinson’s disease in the early clinical stages using a
data driven approach, Journal of Neurology,
Neurosurgery and Psychiatry, Vol. 76, 343-348
Mu, J., Chaudhuri, K.R., Bielza, C., de Pedro-Cuesta, J.,
Larranaga, P., Martinez-Martin, P. 2017. Parkinson’s
disease subtypes identified from cluster analysis of
motor and non-motor symptoms, Frontiers in Aging
Neuroscience, 9:301
Nguyen, A., Roth, N., Ghassemi, N.H., Hannink, J., Seel,
T., Klucken, J., Gassner, H., Eskofier, B.M. 2019.
Development and clinical validation of inertial sensor-
based gait-clustering methods in Parkinson’s disease,
Journal of NeuroEngineering and Rehabilitation, 16:77
Olanow, C.W., Stern, M.B., Sethi,K. 2009. The scientific
and clinical basis forthe treatment of Parkinson disease,
Neurology, Vol. 72 (21 Suppl 4) s1-s136
Rueda, A., Krishnan, S., 2018. Clustering Parkinson’s and
age-related voice impairment signal features for
unsupervised learning, Advances in Data Science and
Adaptive Analysis, Vol. 10(2);1840007
San Segundo, E., Tsanas, A., Gomez-Vilda, P., 2017.
Euclidean distances as measures of speaker similarity
including identical twin pairs: a forensic investigation
using source and filter voice characteristics, Forensic
Science International, Vol. 270, pp.25-38
Selikhova, M., Williams, D.R., Kempster, P.A., Holton,
J.L., Revesz, T., Lees, A.J. 2009. A clinic-pathological
study of subtypes in Parkinson’s disease, Brain, Vol.
132, pp. 2947-2957
Sheaves, B., Porcheret, K., Tsanas, A., Espie, C., Foster, R.,
Freeman, D., Harrison, P.J., Wulff, K., Goodwin, G.M.
2016. Insomnia, nightmares, and chronotype as markers
of risk for severe mental illness: results from a student
population, Sleep, Vol. 39(1), pp. 173-181
Titze, I.R. 2000. Principles of Voice Production. National
Center for Voice and Speech, Iowa City, US, 2nd
printing
Triantafyllidis, A.K., Tsanas A. 2019. Applications of
machine learning in real-life digital health
interventions: review of the literature, Journal of
Medical Internet Research (JMIR), Vol. 21(4), e12286
Tsanas, A., Little, M.A., McSharry, P.E., Ramig, L.O.
2010. New nonlinear markers and insights into speech
signal degradation for effective tracking of Parkinson’s
disease symptom severity, International Symposium on
Nonlinear Theory and its Applications (NOLTA), pp.
457-460, Krakow, Poland, 5-8 September
Tsanas, A., Little, M.A., McSharry, P.E., Ramig, L.O.
2011. Nonlinear speech analysis algorithms mapped to
a standard metric achieve clinically useful
quantification of average Parkinson’s disease symptom
severity, Journal of the Royal Society Interface, Vol. 8,
pp. 842-855
Tsanas, A., Little, M.A., McSharry, P.E., Spielman, J.,
Ramig, L.O. 2012. Novel speech signal processing
algorithms for high-accuracy classification of
Parkinson’s disease, IEEE Transactions on Biomedical
Engineering, Vol. 59, 1264-1271
Tsanas A. 2012. Accurate telemonitoring of Parkinson’s
disease symptom severity using nonlinear speech signal
processing and statistical machine learning, Ph.D.
thesis, Oxford Centre for Industrial and Applied
Mathematics, University of Oxford
Tsanas A. 2013. Acoustic analysis toolkit for biomedical
speech signal processing: concepts and algorithms, 8th
International Workshop on Models and Analysis of
Vocal Emissions for Biomedical Applications
(MAVEBA), pp. 37-40, Florence, Italy, 16-18
December
Large-scale Clustering of People Diagnosed with Parkinson’s Disease using Acoustic Analysis of Sustained Vowels: Findings in the
Parkinson’s Voice Initiative Study
375

Tsanas, A., Gómez-Vilda P., 2013. Novel robust decision
support tool assisting early diagnosis of pathological
voices using acoustic analysis of sustained vowels,
Multidisciplinary Conference of Users of Voice, Speech
and Singing (JVHC 13), pp. 3-12, Las Palmas de Gran
Canaria, 27-28 June
Tsanas, A. Little, M.A., McSharry P.E. 2013. A
methodology for the analysis of medical data, in
Handbook of Systems and Complexity in Health, Eds.
J.P. Sturmberg, and C.M. Martin, Springer, pp. 113-125
(chapter 7)
Tsanas, A., Little, M.A., Fox, C., Ramig L.O. 2014a.
Objective automatic assessment of rehabilitative speech
treatment in Parkinson’s disease, IEEE Transactions on
Neural Systems and Rehabilitation Engineering, Vol.
22, 181-190
Tsanas, A., Zañartu, M., Little, M.A., Fox, C., Ramig, L.O.,
Clifford, G.D. 2014b. Robust fundamental frequency
estimation in sustained vowels: detailed algorithmic
comparisons and information fusion with adaptive
Kalman filtering, Journal of the Acoustical Society of
America, Vol. 135, 2885-2901
Tsanas A. 2019. New insights into Parkinson’s disease
through statistical analysis of standard clinical scales
quantifying symptom severity, 41st IEEE Engineering
in Medicine in Biology Conference (EMBC), Berlin,
Germany, 23-27 July
Tsanas, A., Arora S. 2019. Biomedical speech signal
insights from a large scale cohort across seven
countries: the Parkinson’s voice initiative study,
Models and Analysis of Vocal Emissions for Biomedical
Applications, Florence, Italy, 17-19 December
Yao, J., Mao, Q., Goodison, S., Mai, V., Sun, Y. 2015.
Feature selection for unsupervised learning through
local learning. Pattern Recognition Letters, Vol. 53, pp.
100–107
van der Maaten, L.J.P., Hinton, G.E. 2008. Visualizing
high-dimensional data using t-SNE, Journal of
Machine Learning Research , Vol. 9, pp. 2579-2605
van Rooden S.M., Colas F., Martínez-Martín P., Visser M.,
Verbaan D., Marinus J., Chaudhuri R.K., Kok J.N., van
Hilten J.J. 2011. Movement Disorders, Vol. 26(1),
pp.51-58.
Zhang, X., Chou, J., Liang, J., Xiao, C., Zhao, Y., Sarva,
H., Henchcliffe, C., Wang, F. 2019. Data-driven
subtyping of Parkinson’s disease using longitudinal
clinical records: a cohort study, Scientific Reports, Vol.
9;797.
SERPICO 2020 - Special Session on Mining Self-reported Outcome Measures, Clinical Assessments, and Non-invasive Sensor Data
Towards Facilitating Diagnosis, Longitudinal Monitoring, and Treatment
376
