
Geovisualization: Multidimensional Exploration of the Territory
Sidonie Christophe
a
Paris-Est University, IGN ENSG, LaSTIG, France
Keywords:
Geovisualization, Visual Analysis, Style, Interaction, Immersion.
Abstract:
The purpose of this position paper is to emphasize the remaining challenges for geovisualization in an evo-
lutive context of data, users and spatio-temporal problems to solve in an interdisciplinary approach. Geovi-
sualization is the visualization of spatio-temporal data, phenomena and dynamics on earth, based on the user
interaction with heterogeneous data, and their capacities of perception and cognition. This implies to bring
closer together knowledge, concepts and models from related scientific visualization domains, for a better un-
derstanding, interpretation and analysis of spatio-temporal phenomena on earth. We currently face and cross
several types of complexities, regarding spaces, data, models and tools. Our position here, based on past and
on-going works, as first proofs of concept, is to model a multidimensional exploration of the territory, because
integrating explorations of uses, styles, interaction and immersion capacities, until various ’points of view’ on
the represented spatio-temporal phenomenon.
1 INTRODUCTION
The amount of heterogeneous geospatial data, multi-
sensors, multi-sources, multi-scales, more or less pre-
cise, and more or less massive, motivate the users
to visualize them all together, in addition to textual
archives, iconographic collections and any possible
spatialized information (co-visualization). Addition-
ally, the users expect tools offering ways to navigate
into all those data, through space and time (naviga-
tion). For scientific purposes, some users need to de-
tect changes, breaks, and artifacts in data, to com-
pare sources and imprecision, to compare measures
in time, simulation, prediction scenarii, or learning
models. For general public purposes, characteris-
tics of a spatial issue on earth have to be explained,
graphically synthesized and should support collabo-
rative mediation. Those typical user needs require to
visualize a spatio-temporal data, phenomenon or dy-
namics from various possible points of view (multi-
dimension). Even if cartographic, geovisualization
or datavisualization tools exist, no visualization sys-
tem is now able to offer flexible multi-dimensional vi-
sualization of spatio-temporal information, based on
the navigation into geospatial ans spatialized data, to
ease the visual reasoning on complex spatio-temporal
dynamics on earth. Geovisualization is the set of
knowledge, methods and tools favoring the visualiza-
a
https://orcid.org/0000-0002-2980-2803
tion and the visual analysis of geographic spaces and
spatio-temporal phenomena, based on the user inter-
action with geographic or spatial data (MacEachren
and Kraak, 2001; Dykes et al., 2005).
We would like to emphasize that geovisualization
is most of all related to the all methodological ap-
proach and the modeled processes of both graphic
representation and rendering of, and the interaction
with, geospatio-temporal information, enhancing the
knowledge inference on geographic spaces and spa-
tial phenomena. The purpose is to ”see, perceive and
understand”, based on the user exploration of data
and graphic representations, while preserving what
could be meaningful for the users into the represented
geographic spaces and phenomena. Similarly to in-
formation visualization and data visualization, but
geospatial-oriented, geovisualization should facilitate
both the exploration of the geospatial data and the
first steps of visuo-spatial interpretation. Geovisu-
alization is not only about designing new technolo-
gies for co-localized geospatial data visualization, but
also about addressing the complexity to visualize a
spatio-temporal phenomenon interacting with the re-
lated geographic spaces. Through years, the context
has evolved from challenges already existing but that
have become more pronounced over time. More het-
erogeneous, imprecise and massive spatial and non-
spatial data are available to be combined and hy-
bridized for visualization; a diversity of users expects
to visualize complex spatio-temporal phenomena in
Christophe, S.
Geovisualization: Multidimensional Exploration of the Territory.
DOI: 10.5220/0009355703250332
In Proceedings of the 15th International Joint Conference on Computer Vision, Imaging and Computer Graphics Theory and Applications (VISIGRAPP 2020) - Volume 3: IVAPP, pages
325-332
ISBN: 978-989-758-402-2; ISSN: 2184-4321
Copyright
c
2022 by SCITEPRESS – Science and Technology Publications, Lda. All rights reserved
325

order to see, explain, analyze and understand complex
spatial dynamics and systems; finally, user interaction
and interfaces allow to investigate innovative modes
to explore data and to virtually or in an augmented
way experience geographic spaces. Geovisualization
is about bringing knowledge, concepts and models
for a better understanding, interpretation and analy-
sis of spatio-temporal phenomena on earth. This is
an interdisciplinary, and even transdisciplinary field:
geovisualization aims at specifying and integrating
new models of abstraction, representation, perception
and cognition related to geographic spaces, with the
help of and contributing to geographic information
sciences, HCI, computer graphics and cognitive sci-
ences. In this position paper, we aim at emphasizing
and revisiting essential challenges for geovisualiza-
tion, in specifying how the issue of the visualization
of spatio-temporal data could be addressed as a mul-
tidimensional exploration problem, based on our own
research approach.
2 GEOVISUALIZATION
Geovisualization integrates approaches from ”visu-
alization in scientific computing, cartography, im-
age analysis, information visualization, exploratory
data analysis, and geographic information systems
to provide theory, methods and tools for visual ex-
ploration, analysis, synthesis, and presentation of
geospatial data” (MacEachren and Kraak, 2001). It
refers both to the science and the techniques to design
and use ”visual geospatial displays to explore data
and through that exploration to generate hypotheses,
develop problem solutions and construct knowledge”
(Kraak, 2003). Since, the main trend is still to iterate
from the users needs, in order to design and to han-
dle effective geovisualization techniques (N
¨
ollenburg,
2007; Lloyd and Dykes, 2011), and to connect peo-
ple, maps and processes to acquire knowledge (Dykes
et al., 2005). The challenge of enhancing spatial anal-
ysis based on visual media is related to geovisual an-
alytics (Andrienko and Andrienko, 2005; Keim et al.,
2008; Andrienko et al., 2014; MacEachren, 2015),
that we consider to be a part and a purpose of our
’geovisualization issue’. This raises issues of inter-
related design and use, for geospatial data explo-
ration, based on but also leading to issues of percep-
tion and cognition. The main challenges for geovi-
sualization designers is to take into account the set of
the following complexities: 1- Geographic spaces and
data to handle; 2- Spatio-temporal phenomena and
models to represent; 3- Visual integration and interac-
tive or even immersive exploration of data, to design.
Geographic Spaces and Data. A geographic space
is characterized by its terrain, landscapes, natural and
artificial entities, shapes, volumes, structures and ar-
rangements, modeled into heterogeneous, imprecise
and massive spatial data, according to acquisition
methods, sources, scales, data types, etc. The descrip-
tion and analysis of geographic spaces and their in-
teraction with other dynamic systems on earth come
mainly from geography and geosciences. We face an
amount of geospatial data (vector databases, maps,
various imagery, 3D models, numeric models, point
clouds, etc.) but also non-spatial data (texts, stories,
web data, statistic data, photographs, etc.) that can be
spatialized. The handling of the suitable scale to man-
age, while preserving the spatial arrangements of the
territory, as having a proper positioning or controlled
level of uncertainty of the geolocalization of things
are at stake here. Graphically representing these ge-
ographic spaces and phenomena requires to preserve
spatial coherence of the information, related to their
geometry, topology and semantic, while preserving
their structure and their meaning. Visual perception
and spatial cognition play a great role there to drive
representation choices. Massive geospatial data bring
us also to go closer to image rendering performance,
for real time purposes, visualization of simulated data
or Lidar data, or 3D streaming. In geovisualization,
we sometimes face a kind of dichotomy between the
abstraction paradigm, coming from map design and
vectorial spatial data handling, and the photo-realism
paradigm, coming from image processing and com-
puter vision based on the acquisitions of 3D+T laser
or images on earth. This dichotomy exists also into
the various sets of knowledge and methods, coming
from map design, image processing and computer vi-
sion, to represent spatio-temporal information.
Spatio-temporal Phenomena and Models. Ad-
vances in modeling and simulation of physical, so-
cial, historical of spatio-temporal phenomena and dy-
namics need more and more visualization support, for
visuo-spatial analysis purposes. How could visualiza-
tion effectively help to support perception and inter-
pretation of data and related phenomena? Knowing
that a phenomenon could be represented by raw, pre-
dicted, simulated, learned data, another complexity
comes from acquisition sensors and input models, and
their related imprecision to be (visually) propagated.
Approaches to handle time and dynamics have been
deeply investigated through years, in order to support
visual analytics, visual reasoning, and change detec-
tion, based on innovative space-time cube (Andrienko
and Andrienko, 2005) and leading to researches in the
spatio-temporal analysis of movement, and in partic-
ular trajectories and human-based activities. 3D per-
IVAPP 2020 - 11th International Conference on Information Visualization Theory and Applications
326

spectives or simplified graphs (Hurter et al., 2009)
such as generalized space-time cubes have been pro-
posed (Bach et al., 2017) in order to explore data.
In parallel, uncertainties of data (positional and se-
mantic accuracy, logical consistency and complete-
ness), models and phenomena remain difficult to con-
vey and is still a major issue for geovisualization: vi-
sual variables have been explored and experimented
(MacEachren, 2015; Bevis et al., 2017). Color
palettes for geo-physics phenomena are still in ques-
tion to improve scientific analysis and sharing (Spekat
and Kreienkamp, 2007; Thyng et al., 2016), but also
remain questionable. The issue of quality regarding
scientific visualization, balanced with aesthetic issues
is also discussed (Hanson, 2014). Spatio-temporal
representations and animations are more and more
used, in order to serve continuous animated visualiza-
tions of long-time data, for instance on earthquakes
evolutions
1
, such as remarkable data visualizations.
Nevertheless, even if animations are very useful to
improve the global perception of a spatio-temporal
phenomenon and its general patterns, it remains diffi-
cult to detect and analyze changes, at any scales. In
addition, the beautiful and so efficient graphic repre-
sentation of warming stripes for climate data visual-
ization is particularly relevant and has a strong public
impact: nevertheless it is quite not adapted to com-
plex visual analysis of climate change, regarding dy-
namic geographic spaces and other dynamic geophys-
ical systems, even some parameters may be used to
compare, show and extract time periods and identify
some effects (Hawkins, 2018).
Visual Integration, Interaction and Immersion.
Co-visualizing data, i.e. visualizing them together
in a single visual display, implies difficulties caused
by the potential number but also the potential hetero-
geneity in source, scale, content, precision, dimen-
sion and temporality. This visual integration requires
to figure out graphic representation aspects to pre-
serve legibility when combining heterogeneous data
and sometimes numerous ones. Visual complexity
is a major stake and innovative measures and anal-
ysis have been propose to drive better geovisualiza-
tion techniques (Schnur et al., 2010; Da Silva et al.,
2011; J
´
egou and Deblonde, 2012). Because the im-
age processing approach here is not suitable to cap-
ture semiologic and cognitive complexities of geo-
visualizations, or local complexities (Touya et al.,
2016). Geovisualization strengthens and revisits the
map design process, i.e. a series of choices regarding
conceptual, semantic, geometric, graphic abstractions
of geospatial reality. Abstraction and schematization
have been addressed by information visualization for
1
https://volcano.si.axismaps.io/
cartography (Isenberg, 2013; Kim et al., 2013) until
sketchiness techniques evaluation (Boukhelifa et al.,
2012; Limberger et al., 2016). We claim here for a
closer methodological approach between the ’abstrac-
tion’ paradigm and the ’photo-realism’ paradigm, in
order to take advantages from both for the visual in-
tegration of data. Various research works propose
managing continuous transitions in a same visual-
ization, for instance between levels of abstraction,
according to the distance from the image center or
some rendered objects, to the scene depth, in ren-
dering styles or through scales (Semmo et al., 2012;
Trapp et al., 2015; Dumont et al., 2017). Multi-
plexing tools have been investigated, in order to fo-
cus on some parts of the visualization or some ob-
jects in the visualization (Pietriga et al., 2010; Pindat
et al., 2012) opening a main lead for the visualiza-
tion of several data types. Interaction is meant to fa-
vor exploration and perception of represented scenes,
leading to immersion into virtual scenes, augmenting
the real environment: numerous applications of aug-
mented and virtual reality have been investigated for
many use cases (Milgram and Kishino, 1994; Schmal-
stieg and Reitmayr, 2007; Normand et al., 2012).
Augmented and mixed realities are opportunities, for
urban design and dynamics comprehension such as
non-visual perceptions, to experiment spatial percep-
tion, interaction and cognition, supporting analysis or
enriching a multi-sensorial experience. These new
devices require adaptation for geovisualization and
visuo-spatial analysis, probably inspired by 3D geo-
visualization (Devaux et al., 2018), not to be only
gaming-oriented or movie scenarii, but use-oriented
(Jacquinod and Bonaccorsi, 2019), and targeting the
Immersive Analytics (Chandler et al., 2015).
3 MULTI-D EXPLORATION
The multidimensional characteristic of data and phe-
nomena implies to be able to go from one represen-
tation to another, from a dimension to another, from
a point of view to another, while: 1- facilitating the
exploration, 2-without loosing visual landmarks and
attention. We tackle the ’geovisualization issue’ as a
multidimensional exploration of the territory. We aim
at conceiving an interactive system, allowing to de-
sign and use visualizations, based on the exploration
of possible heterogeneous data and styles, through
space and time, supporting to observe, analyze and in-
terpret possible spatio-temporal phenomena on earth.
This ideal system should favor some responsiveness,
in order to co-design with the users, provide guidance
to find the most suitable visualization for a use con-
Geovisualization: Multidimensional Exploration of the Territory
327

text, and provide ways to explore and design possible
visualizations. These requirements need to orches-
trate the main components of this exploration, based
on the knowledge of the sets of parameters, operators
and constraints. This purpose can only be fed by the
identification of the main categories of problems to
solve, in order to formalize and integrate them into
a semi-automatic system of geovisualization, such as
the following ones: 1- the capacities to respond to
various uses; 2- the navigation into graphic represen-
tations through style exploration; 3- the exploration
of data interaction and immersion possibilities; 4- the
exploration of points of view, from the user location
to their intentions. We think that they should be ad-
dressed further and deeper, with the help of a cross-
disciplinary approach, from other visualization do-
mains.
3.1 Use Exploration
As input knowledge for geovisualization, geographic
approaches or direct observations help to identify the
users needs, such as many user studies on preferences
and task performance help to assess the efficiency and
the usability (Fabrikant and Lobben, 2009; Slocum
et al., 2001). Use contexts have to be investigated, in
order to explicit meaningful entities and structures of
geographic spaces and the phenomenon in issue (Grif-
fin et al., 2017).
Retrieving Users Needs. To make the users express
what is relevant for them, is difficult to drive on the
field, and is actually done through geographic ap-
proaches, but still remains difficult to approach semi-
automatically. For scientific purposes, if researchers
want to visually analyze the results of a simulation,
prediction or learning model, it will be relevant to
identify with them what is meaningful to actually ob-
serve, according to their use context. For general pub-
lic, it would be useful to better explain phenomena
and their underlying uncertainties. For a flash flood,
some could investigate a precise maximal extent in
time related to possible submersions, affected build-
ings during a water flood, or various prospective sce-
nari of rising water levels, with the help of the same
geovisualization system (Fig.1). Visualization could
help to show and compare realistic simulations or sce-
narios, interpret results from simulation, prediction or
learning models, or the gap between predicted and ob-
served data on earth, in order to refine a model; it
should also support the automatic detection and iden-
tification of artifacts, patterns, breaks, changes, out-
liers, weak signals, in input data and initial configu-
rations of models; but also to explore a phenomenon,
in its various dimensions, spatial, temporal but also
in the initial parameterization and/or measures. The
exploration of the spaces of initial parameters and ob-
servations of the models, to visually compare various
scenarios, and possibly to modify the computation pa-
rameterization in real time.
Improving Models of Perception and Cognition.
Concerning user-centered approaches, a convergence
of Geographic Information sciences with psychology
and cognitive sciences (Davies et al., 2015; Martin,
2008) exists for a long time ago, in order to address
what help people read and think on spaces and their
related representations. Nevertheless, it remains dif-
ficult to go out visual perception issues and to model
properly spatial perception and cognitive dimensions.
A well conducted experimentation requires the def-
inition of low level tasks in a simplified geographic
space, in order to correctly validate the hypothesis.
But in geovisualization, tasks are complex and made
in a complex geographic space, not facilitating the
specification of independent hypothesis, the design of
controlled experimentation and the reproductibility of
those experimentation. This implies to be able to re-
trieve rules and constraints coming from the use con-
texts, and to design models of perception, cognition
and use for visuo-spatial reasoning.
3.2 Style Exploration
The style is simply defined as a ”set of formal and
aesthetic characteristics of something” and ”a man-
ner to practice something, defined by a set of char-
acteristics”, in the dictionnary. Based on the defini-
tion of a pictural style, coming from linguistics and
computer graphics knowledge (Willats and Durand,
2005), we reformulate the style as all what makes
distinguishable and recognizable the way to design a
graphic representation, based on the implicit knowl-
edge of graphic rules and perhaps grammar rules,
required to generate this representation. The style
refers to a typical family of representation choices,
recognizable with the help of a set of visual salient
characteristics. The hypothesis to use styles is to fa-
cilitate the decoding of spatial information, by han-
dling the repeated experience of reading one style, re-
lated to memorization and learning. When reading
a graphic representation, a series of mechanisms of
vision, perception and cognition is triggered, based
on the visual arrangements, related to spatial arrange-
ments in the real scene and typical from representa-
tion choices of an author, an institution, a period of
time, etc. We experiment a reconciliation between
computer vision and map design, with the common
purpose of spatio-temporal analysis and visualization
of geospatial data, while combining knowledge and
IVAPP 2020 - 11th International Conference on Information Visualization Theory and Applications
328
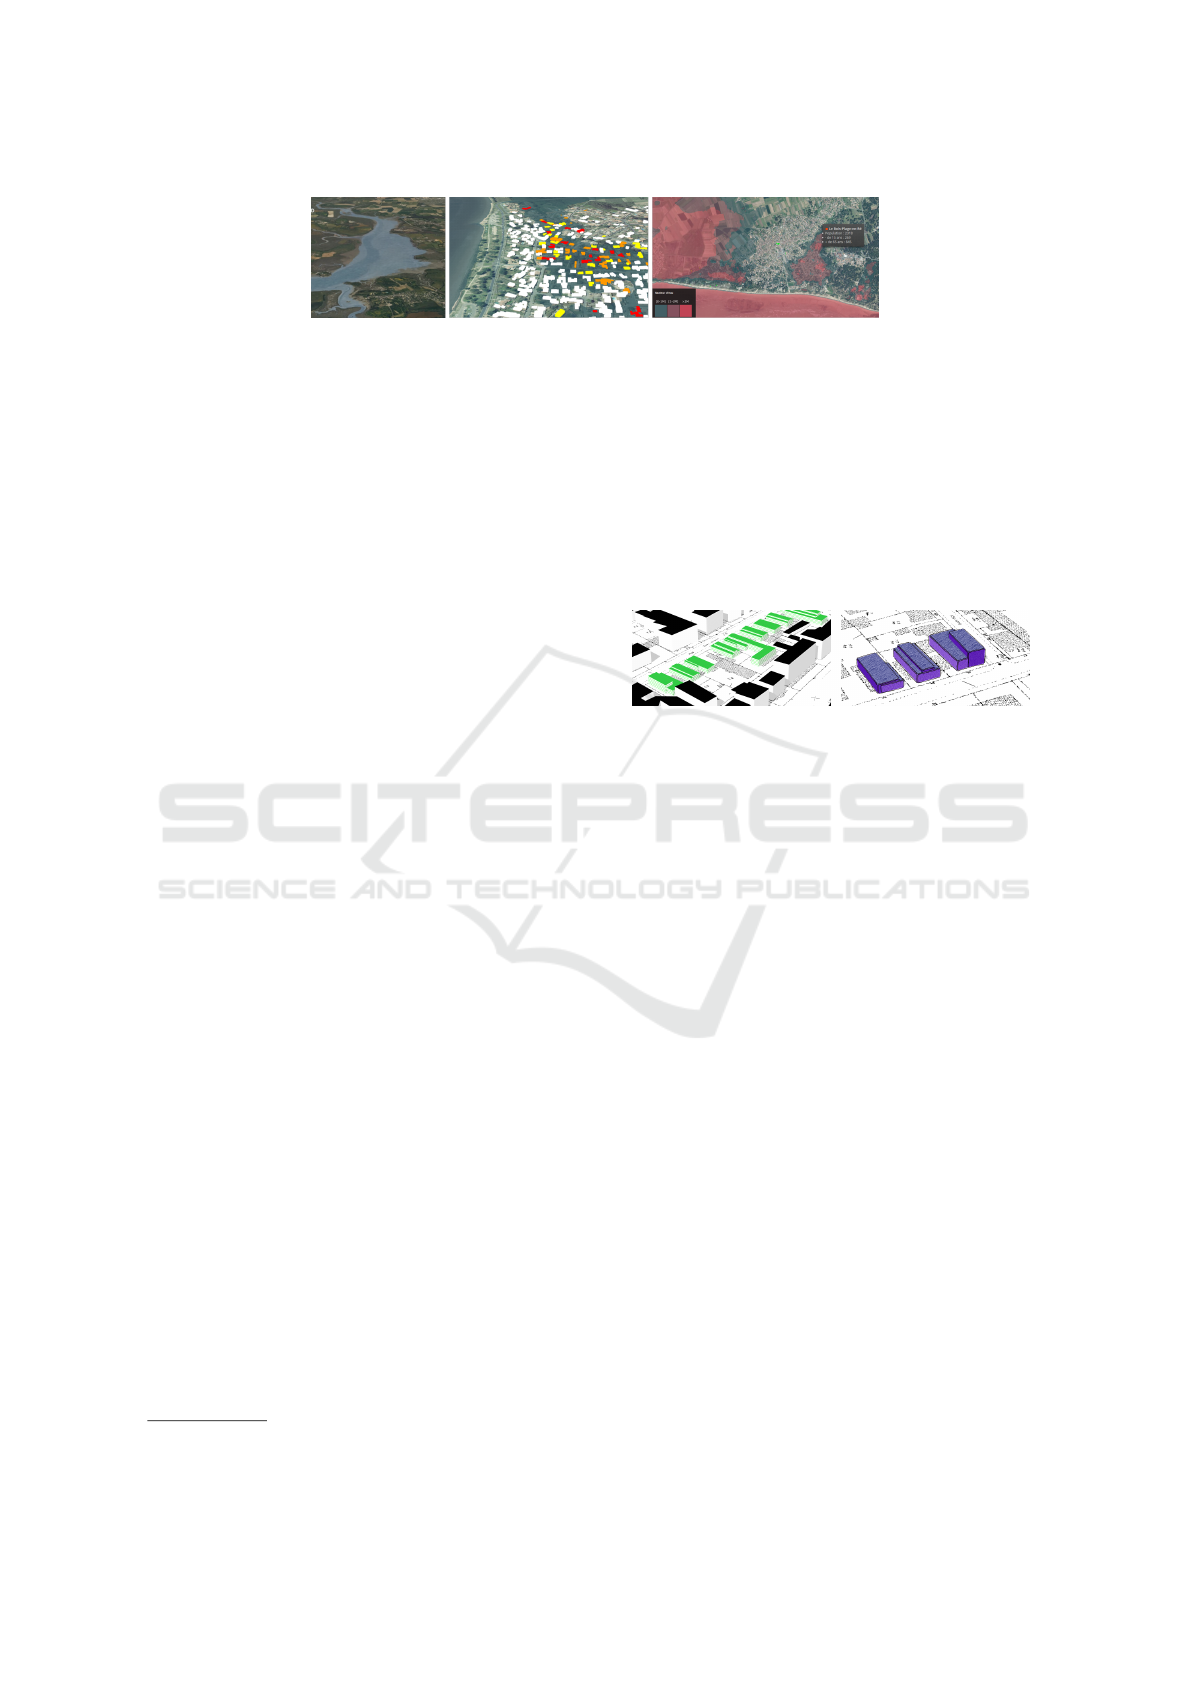
Figure 1: Flood visualizations: animated water rising in 3D (1)(Masse and Christophe, 2015); affected buildings during flash
floods (2); comparison between prospective scenarii (3) experimented in iTownsResearch
2
.
methods to get more a flexible approach of the geo-
visualization methods and tools. Combining abstract
and photo-realist styles, while bringing graphic semi-
ology (Bertin, 1967) into the 3D paradigm, and ren-
dering capacities into (carto)graphic representations,
are the main leads.
Specifying Styles for 2D, 3D, 3D+T or
3D+measure. The specification of styles could
allow leveraging the levels of visual, perceptive and
cognitive complexities potentially coming from the
phenomenon to be represented and the related data.
Capacities provided by (carto)graphic abstractions
and expressive renderings methods (Barla et al.,
2007) allowed us to specify several typical carto-
graphic styles targeting expectations to have more
expressiveness, visual effects, some kind of ”relief”
and animation, in flat surfaces and classical linear
provided by GIS systems and related rendering
engine: watercolorization, engraving, old map styles
are specified and rendered (Christophe et al., 2016).
These expressive methods are transferred to 3D, in
order to provide a set of abstract styles, from a very
simple to more sketchy one, in order to manipulate
abstract buildings, and help the users to focus on their
volume and distribution in empty spaces, and not on
possible details provided by photo-realistic textured
models (Cf. Fig.2). At the contrary, a very realistic
3D geovisualization, based on a high level of detail
will perfectly fit to virtual and/or historical visits
into the past of the city, or to represent realistically a
physical phenomenon. Hybridizing & Optimizing
Styles. Going further than transparency has led us
to mix data and styles and to provide interaction
tools allowing to control the level of hybridization
between photo-realistic and abstract styles: we
initiate a continuous transition between orthoimagery
and vector data, in order to take advantages from
expressivity and efficiency of both styles, based on
the interpolation of graphic parameters, that could be
independently controlled by the users, to design and
refine the way to drive each interpolation of parame-
ters (color palette, image textures, generated textures,
abstract patterns) (Hoarau and Christophe, 2017).
The design of optimization methods would offer to
explore the space of possible styles of representa-
2
https://itownsresearch.github.io/
tion in geovisualization, based on the interpolation
between the sets of graphic parameters of styles,
and related rendering operators. From color and
texture interpolation (Hoarau and Christophe, 2017)
to the optimization of the space of constrained color
palettes (Mellado et al., 2017), we experimented first
steps. Extending existing works on style transfer
(Gatys et al., 2016; He et al., 2017; Liao et al., 2017)
to our complex problem would be relevant to follow.
Figure 2: 3D Abstract styles(Brasebin et al., 2016).
3.3 Interaction, Immersion
Covisualization. In the context of Geographic In-
formation Systems (GIS), the ”multi-layer” paradigm
prevails, but only global transparency between layers
does not allow to explore data. Hybridization of data
and styles required data interpolation: we propose a
continuum between cartographic representation and
satellite imagery, based on color and texture inter-
polations, in order to get more photo-realism in the
abstraction, and conversely. This approach has been
pursued in a interdisciplinary approach with human-
computer interaction, about the design and experi-
mentation of multiplexing cartographic tools allow-
ing to improve co-visualization of heterogeneous data
and multi-scale navigation (Lobo et al., 2017).
Augmented Perception. We face the possibility to
enrich the user experience, with the help of 3D inter-
action and an enriched perception, not only visual, of
their environment. Our purpose here is to facilitate
the understanding of 3D models and related spatial
structures and arrangements making the urban mor-
phology. To visually analyze how a physical phe-
nomenon could interact spatially with the urban mor-
phology is at stake there, for a sea level rise or mi-
croclimatic factors, evolving into the city, in all pos-
sible dimensions. Again this issue requires to take
into account what is meaningful in the characteris-
tics of the phenomenon, but also the relevant topo-
graphic data or other data conveying meaning for vi-
Geovisualization: Multidimensional Exploration of the Territory
329
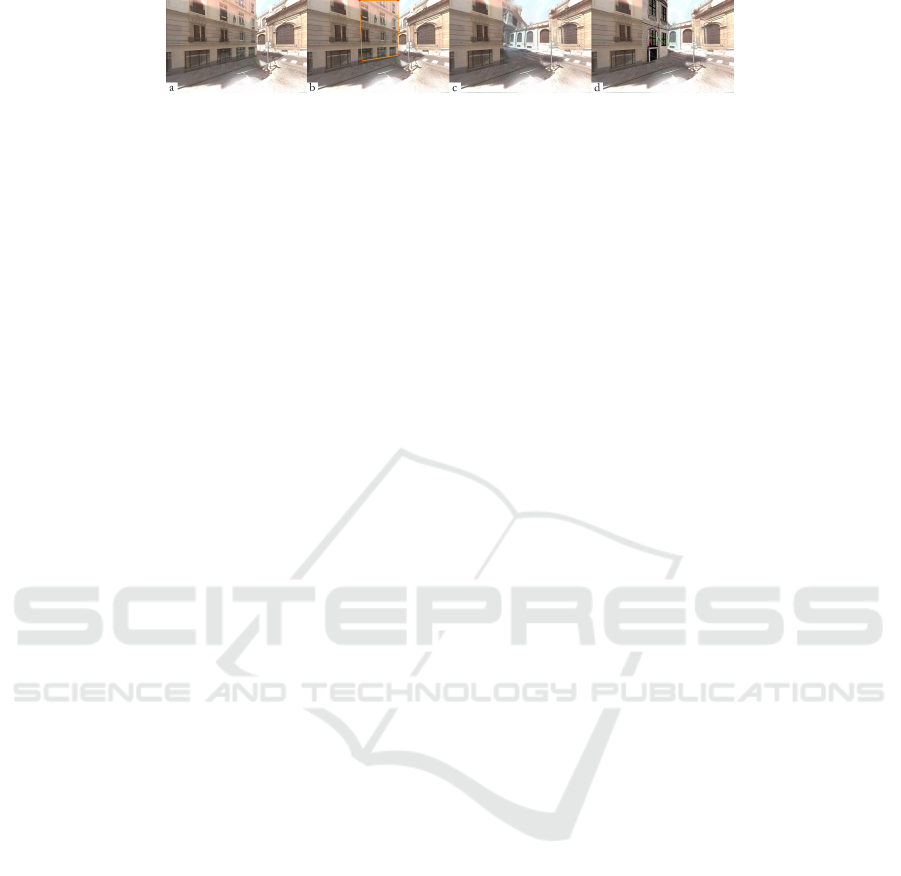
Figure 3: Urban design with augmented reality glasses: removing of and adding a building (Devaux et al., 2018).
sual analysis. In the context of urban design, we pro-
pose an extension of a classical desktop 3D geovisu-
alization into mixed reality, in order to identify the
components of the geovisualization pipeline needing
to be re-adapted or extended (rendering, stylization,
3D interaction), and new components to take into ac-
count more specifically (pose estimation, occlusions,
inpainting). This kind of application requires not only
the integration of a high quality level of the 3D model,
coming from a photogrammetric acquisition, to get
the scene captured by the augmented reality device,
but also to design intuitive interaction with the aug-
mented data, whatever the resolution of the 3D model
or the visualization scale. Various experimentations
are made – scale modification, geometric adaptation
between virtual and real scenes, style matching be-
tween added objects and existing objects in the scene
– allowing the interaction et the hybridization of real
and virtual. For urban design purpose, we design a
use case about the implantation of a new building re-
quiring to remove the previous one, with potential dif-
ferent volume, ground surface, facades textures, with
the help of glasses of mixed reality (Fig.3)(Devaux
et al., 2018). These approaches have to be pursued
and are actually experimented in various use contexts,
based on historical or climate data, to improve the vi-
sualization of urban spaces.
3.4 ’Points of View’
The multidimensional exploration of the territory is
finally an exploration of various points of view on
the territory. This notion may cover the following as-
pects, but has also to be taken in a more conceptual
way. It could be: 1- the location of the user or the
camera, through a numeric device or not; 2- the var-
ious angles or axes, from which a phenomenon can
be visualized, as elevation (street-level, oblique, ortho
views, for instance), depth, time, etc.; 3- the way to
conceptually and formally represent a phenomenon:
a measure, a probability distribution, a scalar field, a
graph, etc.; 4- the intention of the author, and the way
the author may control their message to convey, i.e. an
’intentional’ point of view; This proposition implies
to control, orchestrate the multiple possible explo-
rations, help the users to take benefit from modifying
their point of view, according to their own use con-
texts, and effectively to explore data in a multidimen-
sionnal way. This is this exploration of the diversity of
possible geovisualization designs which will bring us
closer to fit to the diversity of users and uses. To en-
rich perception until immersion, in order to be into the
geographic space, more or less virtually: this issue of
the experience, which could be multi-sensorial, asks
to be experimented in the context of spatio-temporal
phenomena related to geographic spaces.
Beyond Vision? When vision is missing or failing,
we could ask rightly if ’geovisualization’ still has a
meaning there. We argue that the ”to perceive and
to understand” is still relevant and similar challenges
remain to provide a mental representation of the ter-
ritory. This requires a complete revisit of the needed
entities meaningful for mobility, to be represented for
blind people. This extension of ’geovisualization’
motivate us to propose new cognitive model of geo-
graphic space representation, to support this spatial
perception and real mobility tasks. Complex notions
for spatial cognition, such as obstacles, empty spaces,
hazardousness, uncertainty are a huge challenge for
the better understanding of spatio-temporal informa-
tion.
4 CONCLUSION
We claim for a cross-over between domains, in or-
der to model how the visuo-spatial reasoning works,
especially regarding complex tasks, as scientific and
decision-making purposes, such as explanation and
communication for final users. To be able to inter-
face simulation, learning, or prediction models to vi-
sual analysis, will allow to facilitate and enrich the
capacities of interpretation and comparison of mod-
els, simulations and scenarios, in addition to clas-
sical approaches of spatial analysis, in order to de-
tect artifacts and changes, in space and time. We
hope that visualization could facilitate the first steps
of decoding, reasoning and learning. In particular, the
issue of the interpretability of spatio-temporal data,
from raw to simulated ones, could help to visually
analyze geophysical, climatical, socio-demographic,
historical phenomena and dynamics on earth. We
assume that challenges are still remaining in order
to reach the final goal: how geovisualization could
effectively participate to visuo-spatial reasoning un-
IVAPP 2020 - 11th International Conference on Information Visualization Theory and Applications
330

til the famous decision-making? In particular, un-
certainty and decision-making are still investigated
and experimented (Padilla et al., 2018; K
¨
ubler et al.,
2019) and we hope to be able in the future to use these
experiments to guide graphic representation choices
for a better visualization of spatio-temporal data on
earth.
REFERENCES
Andrienko, G., Fabrikant, S. I., Griffin, A. L., Dykes, J., and
Schiewe, J. (2014). Geoviz: interactive maps that help
people think. International Journal of Geographical
Information Science, 28(10):2009–2012.
Andrienko, N. and Andrienko, G. (2005). Exploratory
Analysis of Spatial and Temporal Data: A Systematic
Approach. Springer-Verlag New York, Inc., Secaucus,
NJ, USA.
Bach, B., Dragicevic, P., Archambault, D., Hurter, C.,
and Carpendale, S. (2017). A descriptive frame-
work for temporal data visualizations based on gener-
alized space-time cubes. Computer Graphics Forum,
36(6):36–61.
Barla, P., Thollot, J., and Thomas, G. (2007). Rendu ex-
pressif. In P
´
eroche, B. and Bechmann, D., editors,
Informatique graphique et rendu. Herm
`
es - Lavoisier.
Bertin, J. (1967). S
´
emiologie Graphique : les diagrammes,
les r
´
eseaux, les cartes. Paris Mouton.
Bevis, Y., Schaab, G., Rautenbach, V., and Coetzee, S.
(2017). Expert opinions on using the third dimension
to visualise wind speed uncertainty in wind farm plan-
ning. International Journal of Cartography, 3(1):61–
75.
Boukhelifa, N., Bezerianos, A., Isenberg, T., and Fekete, J.-
D. (2012). Evaluating Sketchiness as a Visual Variable
for the Depiction of Qualitative Uncertainty. IEEE
Transactions on Visualization and Computer Graph-
ics, 18(12):2769–2778.
Brasebin, M., Christophe, S., Jacquinod, F., Vinesse, A.,
and Mahon, H. (2016). 3d geovisualization and styl-
ization to manage comprehensive and participate lo-
cal urban plans. ISPRS Annals of Photogrammetry,
Remote Sensing and Spatial Information Sciences, IV-
2/W1:83–91.
Chandler, T., Cordeil, M., Czauderna, T., Dwyer, T.,
Glowacki, J., Goncu, C., Klapperstueck, M., Klein,
K., Marriott, K., Schreiber, F., and Wilson, E. (2015).
Immersive analytics. In 2015 Big Data Visual Analyt-
ics (BDVA), pages 1–8.
Christophe, S., Dum
´
enieu, B., Turbet, J., Hoarau, C., Mel-
lado, N., Ory, J., Loi, H., Masse, A., Arbelot, B.,
Vergne, R., Br
´
edif, M., Hurtut, T., Thollot, J., and
Vanderhaeghe, D. (2016). Map Style Formaliza-
tion: Rendering Techniques Extension for Cartogra-
phy. pages 59–68, Lisbonne, Portugal. The Euro-
graphics Association.
Da Silva, M. P., Courboulay, V., and Estraillier, P. (2011).
Image complexity measure based on visual attention.
In Image Processing (ICIP), 2011 18th IEEE Interna-
tional Conference on, pages 3281–3284. IEEE.
Davies, C., Fabrikant, S. I., and Hegarty, M. (2015).
Toward Empirically Verified Cartographic Displays,
page 711–730. Cambridge Handbooks in Psychology.
Cambridge University Press.
Devaux, A., Hoarau, C., Br
´
edif, M., and Christophe, S.
(2018). 3D urban geovisualization: in situ augmented
and mixed reality experiments. In International An-
nals of the Photogrammetry, Remote Sensing and Spa-
tial Information Sciences, volume IV-4, pages 41 – 48,
Delft, Netherlands.
Dumont, M., Touya, G., and Duch
ˆ
ene, C. (2017). Alter-
native transitions between existing representations in
multi-scale maps. In International Cartographic Con-
ference, Proceedings of the International Cartographic
Association, Washington, DC, United States. ICA.
Dykes, J., MacEachren, A., and Kraak, M. (2005). Ex-
ploring geovisualization, pages 3–19. Dykes, J. and
MacEachren, A.M. and Kraak, M.J., Elsevier.
Fabrikant, S. I. and Lobben, A. (2009). Special issue on
cognitive issues in geovisualization. Cartographica,
44(3).
Gatys, L., Ecker, A., and Bethge, M. (2016). A neural algo-
rithm of artistic style. Journal of Vision, 16(12):326.
Griffin, A. L., White, T., Fish, C., Tomio, B., Huang, H.,
Sluter, C. R., Bravo, J. V. M., Fabrikant, S. I., Bleisch,
S., Yamada, M., and Picanc¸o, P. (2017). Designing
across map use contexts: a research agenda. Interna-
tional Journal of Cartography, 3(sup1):90–114.
Hanson, A. J. (2014). Putting Science First: Distinguishing
Visualizations from Pretty Pictures. Computer Graph-
ics and Applications, IEEE, 34(4):63–69.
Hawkins, E. (2018). Warming stripes for 1850-
2018 using the wmo annual global temperature
dataset. Climate Lab Book. http://www.climate-lab-
book.ac.uk/2018/2018-visualisation-update/.
He, M., Liao, J., Chen, D., Yuan, L., and Sander, P. V.
(2017). Progressive color transfer with dense semantic
correspondences.
Hoarau, C. and Christophe, S. (2017). Cartographic con-
tinuum rendering based on color and texture inter-
polation to enhance photo-realism perception. IS-
PRS Journal of Photogrammetry and Remote Sensing,
127:27–38.
Hurter, C., Tissoires, B., and Conversy, S. (2009). From-
dady: Spreading aircraft trajectories across views to
support iterative queries. IEEE Transactions on Visu-
alization and Computer Graphics, 15(6):1017–1024.
Isenberg, T. (2013). Visual Abstraction and Stylisation of
Maps. The Cartographic Journal, 50(1):8–18. To ap-
pear.
Jacquinod, F. and Bonaccorsi, J. (2019). Studying social
uses of 3d geovisualizations: Lessons learned from
action-research projects in the field of flood mitiga-
tion planning. ISPRS International Journal of Geo-
Information, 8(2).
J
´
egou, L. and Deblonde, J.-P. (2012). Vers une visualisation
de la complexit
´
e de l’image cartographique. Cyber-
geo.
Geovisualization: Multidimensional Exploration of the Territory
331

K
¨
ubler, I., Richter, K.-F., and Fabrikant, S. I. (2019).
Against all odds: Multicriteria decision making with
hazard prediction maps depicting uncertainty. Annals
of the American Assoc. of Geographers, 0(0):1–23.
Keim, D., Andrienko, G., Fekete, J.-D., G
¨
org, C., Kohlham-
mer, J., and Melanc¸on, G. (2008). Visual analytics:
Definition, process, and challenges.
Kim, S., Maciejewski, R., Malik, A., Jang, Y., Ebert, D. S.,
and Isenberg, T. (2013). Bristle Maps: A Multivariate
Abstraction Technique for Geovisualization. Visual-
ization and Computer Graphics, IEEE Transactions
on, 19(9):1438–1454.
Kraak, M.-J. (2003). Geovisualization illustrated. IS-
PRS Journal of Photogrammetry and Remote Sensing,
57(5):390 – 399. Challenges in Geospatial Analysis
and Visualization.
Liao, J., Yao, Y., Yuan, L., Hua, G., and Kang, S. B. (2017).
Visual attribute transfer through deep image analogy.
ACM Transactions on Graphics, 36(4):1–15.
Limberger, D., Fielder, C., Hahn, S., Trapp, M., and
D
¨
ollner, J. (2016). Evaluation of sketchiness as a vi-
sual variable for 2.5d treemaps.
Lloyd, D. and Dykes, J. (2011). Human-centered ap-
proaches in geovisualization design: Investigating
multiple methods through a long-term case study.
IEEE Transactions on Visualization and Computer
Graphics, 17(12):2498–2507.
Lobo, M.-J., Appert, C., and Pietriga, E. (2017). Mapmo-
saic: dynamic layer compositing for interactive geo-
visualization. International Journal of Geographical
Information Science, 31(9):1818–1845.
MacEachren, A. M. (2015). Visual Analytics and Uncer-
tainty: Its Not About the Data. In Bertini, E. and
Roberts, J. C., editors, EuroVis Workshop on Visual
Analytics (EuroVA). The Eurographics Association.
MacEachren, A. M. and Kraak, M. J. (2001). Research
challenges in geovisualization. Cartography and Ge-
ographic Information Science (CaGIS), 28:3–12.
Martin, D. (2008). Doing Psychology Experiments. Thomp-
son, Wadsworth, Belmont, CA.
Masse, A. and Christophe, S. (2015). Homogeneous
geovisualization of coastal areas from heterogeneous
spatio-temporal data. International Archives of the
Photogrammetry, Remote Sensing and Spatial Infor-
mation Sciences, XL-3/W3:509–516.
Mellado, N., Vanderhaeghe, D., Hoarau, C., Christophe,
S., Br
´
edif, M., and Barthe, L. (2017). Constrained
Palette-Space Exploration. ACM Transactions on
Graphics, 36(4):60.
Milgram, P. and Kishino, F. (1994). A Taxonomy of Mixed
Reality Visual Displays. IEICE Transactions on In-
formation Systems, E77-D(12).
N
¨
ollenburg, M. (2007). Geographic Visualization. Kerren,
A. and Ebert A. and Meyer, J., Lecture Notes in Com-
puter Science, vol 4417. Springer, Berlin, Heidelberg.
Normand, J.-M., Servi
`
eres, M., and Moreau, G. (2012). A
new typology of augmented reality applications. In
Proceedings of the 3rd Augmented Human Interna-
tional Conference, AH ’12, pages 18:1–18:8, New
York, NY, USA. ACM.
Padilla, L., Creem-Regehr, S., Hegarty, M., and Stefanucci,
J. (2018). Decision making with visualizations: a
cognitive framework across disciplines. Cognitive Re-
search: Principles and Implications, 3.
Pietriga, E., Bau, O., and Appert, C. (2010).
Representation-independent in-place magnifica-
tion with sigma lenses. IEEE transactions on
visualization and computer graphics, 16:455–67.
Pindat, C., Pietriga, E., Chapuis, O., and Puech, C. (2012).
JellyLens: content-aware adaptive lenses. In Pro-
ceedings of the 25th annual ACM symposium on User
interface software and technology, UIST ’12, pages
261–270, New York, NY, USA. ACM.
Schmalstieg, D. and Reitmayr, G. (2007). Augmented Re-
ality as a Medium for Cartography, chapter 19, pages
267–294. 2nd edition.
Schnur, S., Bektas¸, K., Salahi, M., and C¸
¨
oltekin, A. (2010).
A comparison of measured and perceived visual com-
plexity for dynamic web maps. In GIScience 2010:
sixth International Conference on Geographic Infor-
mation Science, Zurich, Switzerland, 14 September
2010 - 17 September 2010.
Semmo, A., Trapp, M., Kyprianidis, J. E., and D
¨
ollner, J.
(2012). Interactive Visualization of Generalized Vir-
tual 3D City Models using Level-of-Abstraction Tran-
sitions. Computer Graphics Forum, 31(3).
Slocum, T. A., Blok, C., Jiang, B., Koussoulakou, A.,
Montello, D. R., Fuhrmann, S., and Hedley, N. R.
(2001). Cognitive and usability issues in geovisualiza-
tion. Cartography and Geographic Information Sci-
ence, 28:61–75.
Spekat, A. and Kreienkamp, F. (2007). Somewhere over
the rainbow advantages and pitfalls of colourful visu-
alizations in geosciences. Advances in Science and
Research, 1(1):15–21.
Thyng, K., Greene, C., Hetland, R., Zimmerle, H., and
Dimarco, S. (2016). True colors of oceanography:
Guidelines for effective and accurate colormap selec-
tion. Oceanography, 29:9–13.
Touya, G., Christophe, S., and Hoarau, C. (2016). Clut-
ter and map legibility in automated cartography: A
research agenda. Cartographica: The International
Journal for Geographic Information and Geovisual-
ization, 51(3).
Trapp, M., Semmo, A., and D
¨
ollner, J. (2015). Interactive
Rendering and Stylization of Transportation Networks
Using Distance Fields. In Proceedings of the 10th In-
ternational Conference on Computer Graphics The-
ory and Applications (GRAPP 2015), pages 207–219.
Willats, J. and Durand, F. (2005). Defining pictorial style:
Lessons from linguistics and computer graphics. Ax-
iomathes, 15(3):319–351.
IVAPP 2020 - 11th International Conference on Information Visualization Theory and Applications
332
