
Dropout through Extended Association Rule Netwoks:
A Complementary View
Maicon Dall’Agnol
1
, Leandro Rondado de Souza
1
, Renan de Padua
2
,
Veronica Oliveira de Carvalho
1 a
and Solange Oliveira Rezende
2 b
1
Universidade Estadual Paulista (Unesp), Instituto de Geoci
ˆ
encias e Ci
ˆ
encias Exatas, Rio Claro, Brazil
2
Universidade de S
˜
ao Paulo (USP), Instituto de Ci
ˆ
encias Matem
´
aticas e de Computac¸
˜
ao, S
˜
ao Carlos, Brazil
Keywords:
Dropout, Association Rules, Network, C4.5.
Abstract:
Dropout is a critical problem that has been studied by data mining methods. The most widely used algorithm
in this context is C4.5. However, the understanding of the reasons why a student dropout is a result of its
representation. As C4.5 is a greedy algorithm, it is difficult to visualize, for example, items that are dominants
and determinants with respect to a specific class. An alternative is to use association rules (ARs), since
they exploit the search space more broadly. However, in the dropout context, few works use them. (Padua
et al., 2018) proposed an approach, named ExARN, that structures, prunes and analyzes a set of ARs to build
candidate hypotheses. Considering the above, the goal of this work is to treat the dropout problem through
ExARN as it provides a complementary view to what is commonly used in the literature, i.e., classification
through C4.5. As contributions we have: (a) complementary views are important and, therefore, should be
used more often when the focus is to understand the domain, not only classify; (b) the use of ARs through
ExARN may reveal interesting correlations that may help to understand the problem of dropping out.
1 INTRODUCTION
Dropout is a critical problem affecting institutions
around the world. Much work has been done to un-
derstand the factors that lead students to quit their
studies. Data mining is one of the ways we have
to understand this problem, as seen in (Gustian and
Hundayani, 2017; Pertiwi et al., 2017; Pereira and
Zambrano, 2017). According to (Delen, 2011) there
are two approaches that can be used to deal with the
dropout problem: survey-based and data-driven (ana-
lytic). In the survey-based, theoretical models, such
as the one developed by Tinto (Tinto, 1993), are de-
veloped. In the data-driven the institutional data are
analyzed by analytic methods as the one here.
Among the works that use data mining, C4.5
(specifically the J48 implementation) is the most
widely used algorithm (see Section 2). The algorithm
focuses on improving accuracy to make good predic-
tions to, for example, determine whether or not a par-
ticular student will drop out. As a secondary result,
due to the symbolic representation adopted by the al-
a
https://orcid.org/0000-0003-1741-1618
b
https://orcid.org/0000-0002-5233-7639
gorithm, the decision maker can visualize some fac-
tors that influence dropout. However, the model ex-
plains its decision and not the dataset itself. The tree
obtained by the algorithm is constructed in a greedy
manner, i.e., once an attribute is chosen to be the root
the process continues. Therefore, it is difficult to vi-
sualize, for example, items that are dominants in the
dataset and determinants with respect to a specific
class. An item in this case is an “attribute=value” pair.
Dominant items are those that correlate with more
than one class and determinants those that correlate
exclusively with a particular class, directly impacting
its occurrence.
An alternative is to use association rules (ARs).
ARs are good solutions for finding correlations be-
tween items as well as between items and classes, be-
cause association algorithms exploit the search space
more broadly. Besides, according to (Datta and Men-
gel, 2015) ARs offer the possibility of including lower
ranked features, i.e., items not so frequent, in the
rules. However, in the dropout context, few works
use them (Al-shargabi and Nusari, 2010; Datta and
Mengel, 2015; Hegazi et al., 2016; Gopalakrishnan
et al., 2017) (see Section 2). Nevertheless, a major
problem related to the association task is the num-
Dall’Agnol, M., Rondado de Souza, L., de Padua, R., Oliveira de Carvalho, V. and Rezende, S.
Dropout through Extended Association Rule Netwoks: A Complementary View.
DOI: 10.5220/0009354300890096
In Proceedings of the 12th International Conference on Computer Supported Education (CSEDU 2020) - Volume 1, pages 89-96
ISBN: 978-989-758-417-6
Copyright
c
2020 by SCITEPRESS – Science and Technology Publications, Lda. All rights reserved
89

ber of rules that are obtained. Much work has been
done in the post-processing area to solve this prob-
lem, helping the user to find out from the extracted
patterns those that are relevant to him. Among them
is the Extended Association Rule Network (ExARN).
Proposed by (Padua et al., 2018), ExARN structures,
prunes and analyzes a set of ARs to build candidate
hypotheses. ExARN combines the flexibility of ARs
with a visualization through graphs that allows a bet-
ter understanding of the domain. Therefore, ExARN
focuses on presenting statistically significant correla-
tions that exist among items and, unlike C4.5, has as
a secondary result prediction. These complementary
views provide an interesting way to understand the
domain. That way, ExARN can be used as a com-
plementary view of the models generated by C4.5 (or
other symbolic algorithms).
Considering the above, the goal of this work is
to treat the dropout problem with a solution, in this
case, through ExARN, that provides a complemen-
tary view to what is commonly used in the literature,
i.e., classification through C4.5. Therefore, as con-
tributions of this work, we have: (a) complementary
views are important and, therefore, should be used
more often when the focus is to understand the do-
main, not only classify (a gap identified in the lit-
erature (see Section 2)); (b) the use of association
mining through ExARN may reveal interesting cor-
relations that may help to understand the problem of
dropping out. The ExARN approach was applied in a
dataset obtained from a Brazilian institution, named
Centro Paulo Souza (CPS), an autarchy of the S
˜
ao
Paulo State Government. The institution administers
223 High Technical Schools (Etecs) and 73 Faculties
of Technology (Fatecs). Etecs in Brazil offers tech-
nical courses for students who are in high school or
for people who have already finished high school and
want to upgrade their knowledge to find a new or bet-
ter job.
This work is structured as follows: Section 2
presents some concepts, a literature review and dis-
cusses related works. Section 3 describes the ExARN
approach, which is followed by experiments (Sec-
tion 4), results and discussion (Section 5). Sec-
tion 6 concludes the paper with conclusions and fu-
ture works.
2 REVIEW AND RELATED
WORKS
Dropout is a critical problem affecting institutions
around the world. Much work has been done to under-
stand the factors that lead students to quit their stud-
ies. Data mining is one of the ways we have to un-
derstand this problem, as seen in (Gustian and Hun-
dayani, 2017; Pertiwi et al., 2017; Pereira and Zam-
brano, 2017). There is no consensus on the definition
of dropout (Manh
˜
aes et al., 2014; M
´
arquez-Vera et al.,
2016), but in this paper it is considered as the students
who interrupt the course for any reason (course trans-
fer, registration locking, etc.) and will not end their
studies with their cohorts.
A review was conducted to identify the tech-
niques (classification, regression, clustering, asso-
ciation, etc.) and the algorithms that have been
used to study the dropout problem from a data
mining perspective. To do so, papers were re-
trieved exclusively from the following digital li-
braries: Scopus, Compendex, ISI Web of Science,
IEEE Xplore, ACM Digital Library, ScienceDirect
and SpringerLink. In all of them the search string
was applied on titles, abstracts and keywords. For
SpringerLink, which searches the entire document,
processing was performed to select from the returned
papers only those that contained the search string
words in titles, abstracts and keywords. The period
covered 10 years, from 01/01/2008 to 31/12/2018.
2019 has not been considered as it is in progress. The
search string was built to address the topics “dropout”
and “data mining” as follows: ”({desertion} OR
{attrition} OR {withdrawal} OR {withdraw} OR
{evasion} OR {dropout} OR {dropouts} OR {drop-
out} OR {drop-outs} OR {drop out} OR {drop
outs}) AND ({student} OR {students} OR {school}
OR {academic} OR {education}) AND ({data min-
ing} OR {machine learning}) NOT ({distance} OR
{online} OR {on-line})”. The first part focuses on
the dropout problem, the second restricts the search to
the school context, the third to papers that uses data
mining solutions and the last excludes papers that ad-
dresses dropout in the distance context. The focus was
on face-to-face learning, as all institutions store data
about their students. The search string was set for
each digital library.
Some steps were used to select the relevant papers
from the returned ones (N=486 (Scopus:159; Com-
pendex:115; Web of Science:109; IEEE:56; ACM:12;
Science Direct:26; SpringerLink:9)): (a) removal of
duplicate papers using StArt tool (N=210); (b) review
of titles and abstracts to apply the inclusion and ex-
clusion criteria – papers meeting the exclusion crite-
ria were removed and papers meeting the inclusion
criteria were selected for the next step (N=116); (c)
full review of papers – papers meeting the exclu-
sion criteria were removed and papers meeting the
inclusion criteria were kept (N=54). The number of
papers obtained in each step is shown in brackets.
CSEDU 2020 - 12th International Conference on Computer Supported Education
90

The 54 selected papers, available at http://bit.ly/
dropoutetec2019, were used to extract the informa-
tion. Inclusion criterion was: (a) the paper discusses
the face-to-face dropout problem using data mining
solutions. Exclusion criteria were: (a) the paper is out
of scope: it doesn’t address the face-to-face dropout
problem and doesn’t use data mining solutions; (b)
the paper doesn’t present an abstract; (c) the paper
only presents an abstract; (d) the paper is a copy or an
older version of another paper still considered; (e) the
paper is not a primary study (such as keynotes, books,
technical reports, etc.); (f) the paper is a secondary
study; (g) it was not possible to access the paper; (h)
the paper is not written in English.
As many algorithms appeared in the selected pa-
pers (54), we grouped them by similarity, as done,
for example, in Weka, named here as algorithm fam-
ily. The following families appeared with the fol-
lowing occurrences (from highest to lowest): De-
cision Tree: 31.58%; Ensemble: 15.79%; Regres-
sion: 11.00%; Bayesian: 9.57%; Rule-Based: 9.57%;
Neural Network: 7.66%; Support Vector Machine:
5.74%; Instance-Based: 3.83%; Clustering: 2.87%;
Association: 1.91%; Sequential Pattern: 0.48%. As
seen, the most used family is Decision Tree, followed
by Ensemble and Regression.
In relation to the Decision Tree family, the fol-
lowing algorithms (those at 31.58%) appeared with
the following occurrences (from highest to lowest):
J48/C4.5: 30.30%; Decision Tree: 24.24%; Simple-
Cart/Cart: 10.61%; C5.0: 7.58%; CHAID: 4.55%;
RamdonTree: 4.55%; ADTree: 4.55%; Rpart/Cart:
3.03%; REPTree: 3.03%; ID3: 3.03%; CTree:
1.52%; ImprovedID3: 1.52%; Quest: 1.52%. As
seen, C4.5 is the most widely used algorithm of this
family, followed by Decision Tree and Cart. In some
papers the authors do not mention the name of the
decision tree algorithm used. The Decision Tree la-
bel (24.24%) includes these cases. Regarding Ensem-
ble family, Random Forest is the most used algorithm
(39.39%). Note that Random Forest is based on De-
cision Trees. Regarding Regression family, Logistic
Regression is the most used algorithm (78.26%). De-
tails of the algorithms belonging to each family can
be seen at http://bit.ly/dropoutetec2019.
As seen, only 1.91% of the works (4 out of a total
of 209 algorithms occurrences) used association rules,
as classification is the most used. In all of them, as-
sociation is used in conjunction with other techniques
to improve the interpretation of the patterns and the
understanding of the dropout problem. The idea pre-
sented in this paper is the same.
In (Gopalakrishnan et al., 2017) the authors pro-
pose a solution that uses many approaches, namely:
(a) flowchart and bivariate visualization; (b) feature
ranking; (c) classification; (d) association. The idea is
that decision makers have exploitative possibilities to
aid their understanding of dropout. The approaches
do not depend on each other as the user can choose
which ones to use. Since authors do not use white-box
algorithms, they make the association module avail-
able. The authors state that, in addition to classifying,
it is necessary to understand the patterns of students
who drop out of school. In the association module
rules are generated from closed itemsets and, then, fil-
tered to retain those whose consequents have a class
label. Then, these rules are again filtered by 3 ob-
jective measures. The rules are then presented to the
user. To improve the interpretation of rules, the au-
thors provide an analysis named “inverse rule” and
one named “contrast rule”. The “inverse rule” pro-
vides an analysis that for each rule A = v
i
⇒ C it is
possible to observe the inverse rule, i.e., A = v
i
⇒ ¬C.
The idea is to explore the relation of features with
each class. The “contrast rule” provides an analysis
that for each rule A = v
i
⇒ C it is possible to observe
the variation of the values of A in relation to the class
expressed in C, i.e., A = v
j
⇒ C, A = v
k
⇒ C, etc. The
idea is to verify the relation of the possible values of
a given feature with the class expressed in C. Finally,
the authors also allow extraction of frequent itemsets
into specific subgroups. It is important to mention
that the ExARN, presented here, allows a direct vi-
sualization of the features that relate to each class and
whether they are dominant or determinant. Therefore,
the proposal presented here could be incorporated into
this work.
In (Datta and Mengel, 2015) the authors propose
a hybrid solution to obtain a rule set to understand the
dropout problem. Initially, the authors split the data
through a clustering process using K-means. Then, a
decision tree is generated for each group. All trees
contain few levels (are shallow). For that, the authors
use a recursive partition algorithm with locked fea-
tures – once used, a feature cannot be reused. That
way, each leaf node contains a set of instances. In
the last step Apriori is executed on each leaf node.
Features already used in the tree are no longer con-
sidered here. In the end, the rules are joined back to
the decision tree features to perform the prediction.
The authors state that (a) “clustering” was performed
to improve accuracy, (b) “tree” was used to avoid ob-
taining a large number of association rules, as well
as to avoid only rules containing frequent values, (c)
“association” for more flexibility in rule generation,
allowing the generation of rules containing infrequent
values.
In (Al-shargabi and Nusari, 2010) the authors pro-
Dropout through Extended Association Rule Netwoks: A Complementary View
91

pose a hybrid solution, composed by the following
steps: clustering by K-means, association by Apriori,
and classification by ID3 e J48. However, the pro-
cess flow is not very well explained. It is understood,
from the text, that data is initially clustered to select
specific subsets. For each subset Apriori is applied
to understand each group. Finally, considering only
the features that appeared in the obtained association
rules, the classification algorithms are applied to ob-
tain a final rule set to be used in future predictions.
In this case, association is used as a mean to perform
feature selection. It is important to mention that the
ExARN, presented here, could also be used to explore
the relevant features of each class by identifying dom-
inant and determinant items.
In (Hegazi et al., 2016) the focus is to present an
approach to integrate data mining techniques with the
databases available in the university systems. The au-
thors discuss the approach and mention that it must
be able to provide different algorithms to perform
dropout analysis. For that, the authors show a case
study in which two classification algorithms (neural
networks and decision trees) and an association one
are provided.
3 EXTENDED ASSOCIATION
RULE NETWORK (ExARN)
An association rule expresses a relation between
items that occur in a given dataset. The relations are
of type A ⇒ C, where A represents the antecedent, C
the consequent and A ∩ C = ∅. A rule occurs with
a support sup and a confidence con f . Support indi-
cates the frequency of the pattern while confidence
the probability C occurs given that A occurred. A and
C are itemsets, a subset of a set of items I that appear
in the dataset. An item, in this paper, is a pair “at-
tribute=value”, since we are dealing with relational
tables.
There are many algorithms that can be used to
extract a set of association rules. However, a major
problem related to the association task is the num-
ber of rules obtained. Much work has been done in
the post-processing area to solve this problem, help-
ing the user to discover, among all extracted patterns,
those that are relevant to him. Among them is the
ExARN.
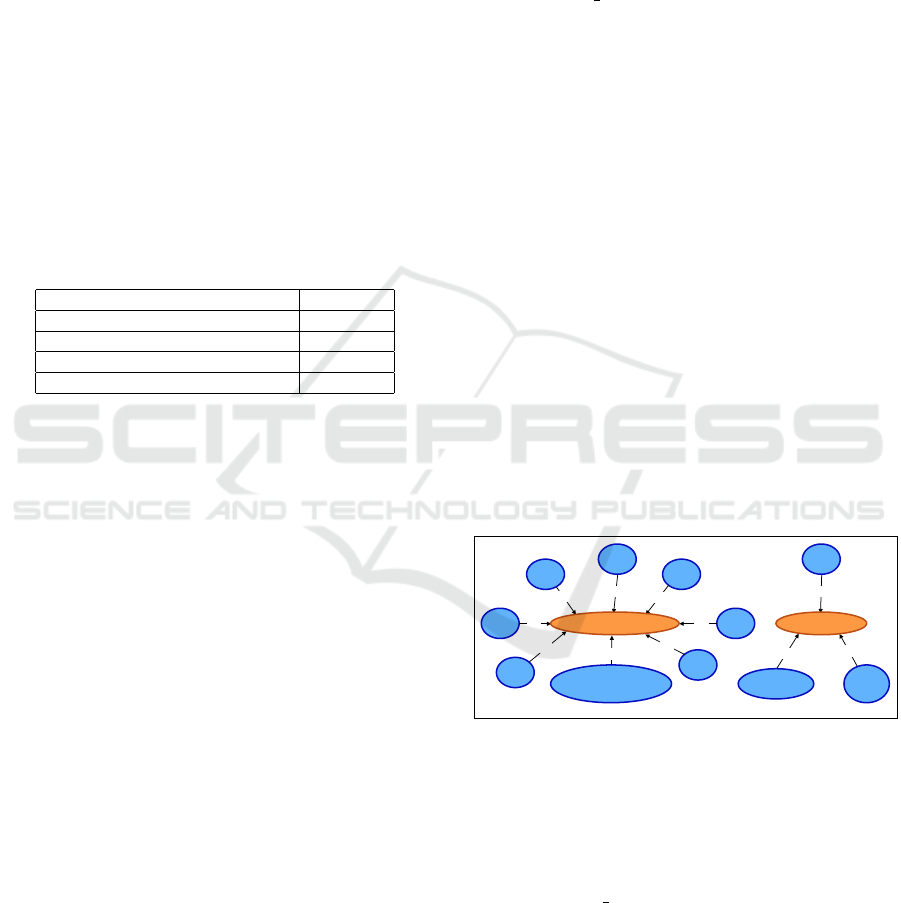
Proposed by (Padua et al., 2018) the Extedend As-
sociation Rule Network (ExARN) aims to structure
and prune a set of association rules to allow a better
understanding of the domain. The ExARN allows the
user to visualize through a graph, such as Figure 1, the
correlations that exist between a set of items of inter-
est and the other items in the dataset. Items of interest
are grouped into a set named objective set. This set
may contain, for example, class labels (dropout and
non-dropout). The graph is built backwards, starting
with the items contained in the objective set in order
to understand and visualize the other items that im-
pact them. In this case, the user has no interest in
classifying anything, but in understanding what are
the features, for example, that affect a student’s deci-
sion whether or not to drop out. Therefore, ExARN is
conceptually different from classification algorithms,
which construct the model greedily, looking only at
classes, ignoring all other correlations present in the
dataset.
B
A
X
Y
Z
D
ND
0.45
0.5
0.33
0.25
1.0
0.55
0.75
L1L2 L0
Figure 1: Example of an ExARN considering the items D
and ND as objective set. Edge weights represent the rules’
confidence.
Algorithm 1: ExARN Algorithm.
Input: R: an association rule set (each rule r
i
∈ R has
size 2 (| r
i
|= 2) and is in the form a
i
⇒ c
i
); Z: an
objective set (| Z |>= 2)
Output: N: an association rule network
1: R
0
= {r
i
∈ R | c
i
∈ Z}
2: N.items = ∅
3: repeat
4: N = Add.N(R
0
)
5: N.items = N.items ∪ Z ∪ {a
i
∈ R
0
} {to avoid
cycles}
6: Z = {a
i
∈ R
0
}
7: R
0
= {r
i
∈ R | c
i
∈ Z,a
i
/∈ N.items}
8: until (R
0
6= ∅)
Algorithm 1 presents the steps for building an
ExARN. Basically, the idea of the algorithm is as fol-
lows: select all the rules that have as consequent the
items belonging to the objective set to be modeled
in the graph. After that, items belonging to the an-
tecedents of the rules already modeled are considered
to form the objective set. The process continues until
there are no more rules to model. However, some re-
strictions must be met: (a) given an item x, it can only
be connected to an item y if Level(y) = Level(x) - 1
– therefore, the connection should be directed from
x (higher level) to y (lower level) – items belonging
to the “original” objective set, i.e., those specified by
the user, are always at level 0; (b) each item should
be modeled only once throughout the network. Con-
CSEDU 2020 - 12th International Conference on Computer Supported Education
92

sidering constraints (a) and (b), it can be ensured that
the resulting network will have no cycle (will be a
directed acyclic graph) and all connections will flow
to the “original” objective set. As a consequence, the
network can be used to construct hypotheses based on
correlations between dataset items and items the user
wants to understand (“original” objective set). To vi-
sualize the strength of the correlation the rule’s confi-
dence is used as the edge weight.
To better explain Algorithm 1 consider R = {X ⇒
D; Y ⇒ D; Y ⇒ ND; Z ⇒ ND; A ⇒ Y ; A ⇒ Z; B ⇒
X; D ⇒ X } and Z = {D,ND} as the input sets. In
line 1 the set R
0
receives all rules r
i
∈ R that contain
as consequent the items in Z. In example R
0
= {X ⇒
D; Y ⇒ D; Y ⇒ ND; Z ⇒ ND}. After that, the al-
gorithm starts a loop to build the graph (lines 2 to 7).
In line 3 the rules in R
0
are added to the network re-
specting constraint (a). As mentioned, items belong-
ing to the “original” objective set are always at level
0 (L0). This step results in levels 0 and 1 of Figure 1
(L0 and L1). In line 4 N.items stores the items already
modeled on the network to avoid cycles to meet con-
straint (b). In example N.items = {D,ND,X,Y,Z}. In
line 5 Z receives a new set of items: those in the an-
tecedent of the rules in R
0
. In example Z = {X,Y , Z}.
In line 6 the algorithm selects the new items to be
modeled in the network: the rules r
i
∈ R that con-
tain as consequent the new items in Z, but do not con-
tain antecedent items that were already modeled to
meet constraint (b). In example R
0
= {A ⇒ Y ; A ⇒
Z; B ⇒ X}. Note that the rule D ⇒ X is not consid-
ered as D is already modeled on the network. Return-
ing to line 3 these rules are modeled leading to Fig-
ure 1. At this point N.items = {D,ND,X ,Y, Z,A,B},
Z = {A, B} and R
0
= ∅. Therefore the algorithm stops
at line 7 and the network shown in Figure 1 is pre-
sented.
Looking at Figure 1, it can be seen that Y may be
a dominant item in the dataset, as it correlates with D
and ND. Therefore, as a hypothesis, this item may not
be a good item to describe them. On the other hand, X
correlates exclusively with D and Z with ND. X and
Z may be determinant items in the dataset, leading to
the hypothesis that they directly affect, respectively,
D and ND. As seen, ExARN can: (a) be used to build
hypotheses because, by explaining the correlation fo-
cused on a particular set of items, it can describe how
target items relate to the others; (b) determine domi-
nant and determinant items in the dataset – dominant
items are those that correlate with many items in the
objective set and determinants are those that correlate
exclusively with a particular item of interest.
4 EXPERIMENTAL EVALUATION
Experiments focused on showing by inspection that
complementary views are important and how ExARN
can enable a broader exploration of data, giving the
user a fuller understanding of it. For this, ExARN’s
ability to explain the domain in relation to C4.5 was
analyzed, as it is the most widely used algorithm (see
section 2) to classify and explain datasets in the pre-
sented context. It is important to note that C4.5 fo-
cuses on improving accuracy to make good predic-
tions, with interpretability being a secondary result,
while ExARN on presenting statistically significant
correlations that exist among items, with prediction
being a secondary result.
As mentioned in Section 1, the data used were
extracted from Centro Paulo Souza (CPS), especially
from some courses at one of the Etecs units. As the
highest dropout rates occur in the first semester, the
following features were considered:
• Demography (1): African Descent [Yes, No];
Civil Status [Single, Married, Other]; Sex [Male,
Female];
• Socioeconomic (2): Q01 (Schooling), Q09 (Paid)
and Q10 (Minimum Wage) [A to G]; Q02 (Study
Type) and Q03 (Study Modality) [A to D]; Q04
(Other Study Simultaneous), Q05 (Works in) and
Q07 (Work Time) [A to E]; Q06 (Years Worked),
Q11 (Skin Color) and Q12 (Study Motivation) [A
to F]; Q08 (Live With) [A to C]; Q13 (Internet)
[A to B];
• Previous Knowledge (3): F1, F2, F3, F4 and F5
(Hits on Knowledge Areas) [Range-1 to Range-
4]; Position (Entrance Type) [First Call, Remain-
ing];
• Performance (4): Hits (Number of Question
Hits) and Grade (Final Performance) [Range-1 to
Range-4];
• Class: Dropout, Non-Dropout.
In CPS any student who interrupts the course for
any reason (course transfer, registration locking, etc.)
is considered a dropout student. For this reason, there
are some features, regarding dropout students, which
have many missing values, such as the grades taken by
each student in each course. Thus, the features con-
sidered are related to demography and socioeconomic
aspects (categories (1) and (2)), previous knowledge
in some areas (math, science, etc.) (category (3)) and
performance obtained in a test named “Vestibulinho”,
used to select candidates to enter in CPS (category
(4)). Therefore, 25 features were used.
Table 1 shows dropout rates for some courses at
one of the Etecs units. As seen, 4 courses could
Dropout through Extended Association Rule Netwoks: A Complementary View
93
be considered in the experiments. However, due to
space constraints, as it is not possible to discuss the
results obtained in each course, only the Administra-
tion course was considered. After a preprocessing
step, the dataset related to this course, regarding the
first semester, contains 151 students, with 31 dropouts
(20.5%) and 120 non-dropouts (79.5%). This is the
second course with the highest dropout rate. Com-
puting, which is the first, was not considered be-
cause C4.5 gets a model for it. In Administration,
as C4.5 does not get a model, two experiments were
performed, one with undersampling, to balance the
dataset, and one as it was. Note that the dropout prob-
lem typically generates unbalanced datasets. In Ad-
ministration, the unbalanced ratio is 1:4. With under-
sampling it was used a ratio of 1:2.
Table 1: Dropout rates for some courses at one of the Etecs
units (D-1st: first semester dropout). In front of the course
name, in brackets, is the number of cohorts considered,
along with the range of years in which they were extracted.
Course D-1st (%)
Computing (4: 2014 to 2017) 20.9%
Administration (4: 2015 to 2018) 20.5%
Pharmacy (5: 2014 to 2018) 17.8%
Legal Service (5: 2014 to 2018) 16.5%
Regarding C4.5, experiments were performed us-
ing its Weka implementation (J48) with its default pa-
rameters. Undersampling was also done in Weka us-
ing “filters.supervised.instance.SpreadSubSample”.
Accuracy, Recall, Precision, F-Measure were com-
puted using 10-fold cross-validation. Regarding
ExARN, the rules were extract using arules package
available at https://cran.r-project.org/web/
packages/arules/index.html. For the original
Administration dataset, i.e., the one without un-
dersampling, support was set to 0.01% (2 or more
transactions) and confidence to 50%. In the under-
sampling dataset, support was set to 0.02% (2 or more
transactions) and confidence to 50%. A common
measure used to filter rules, keeping only the most
interesting, is Lift. It is a measure that evaluates the
degree of dependence between the antecedent and
consequent items. The higher its value the better the
rule. Positive dependencies are always greater than
1. Therefore, after rule generation, only those with
Lift>=1.25 were kept. This was done to get a more
“clearer” graph, i.e., without many items.
5 RESULTS AND DISCUSSION
The discussion is made in two parts. One that com-
pares the results obtained in C4.5 and ExARN in Ad-
ministration dataset, as described in Section 4, with-
out undersampling, and the other the results obtained
with undersampling.
Results without Undersampling. Due to the unbal-
anced ratio of the dataset (4:1), C4.5 was unable to
generate a model capable of splitting the class labels.
As the “model” predicts based on the majority class
(Output: NON DROPOUT (151/31)), it achieves an
accuracy of 79.47%, which leads to a good perfor-
mance relative to the non-dropout class, with a pre-
cision (P) of 0.795, a Recall (R) of 1.0 and a F1 (F-
measure) of 0.886, but a poor performance regarding
the dropout class, incorrectly predicting all instances.
Therefore, an alternative and/or complementary view
is required.
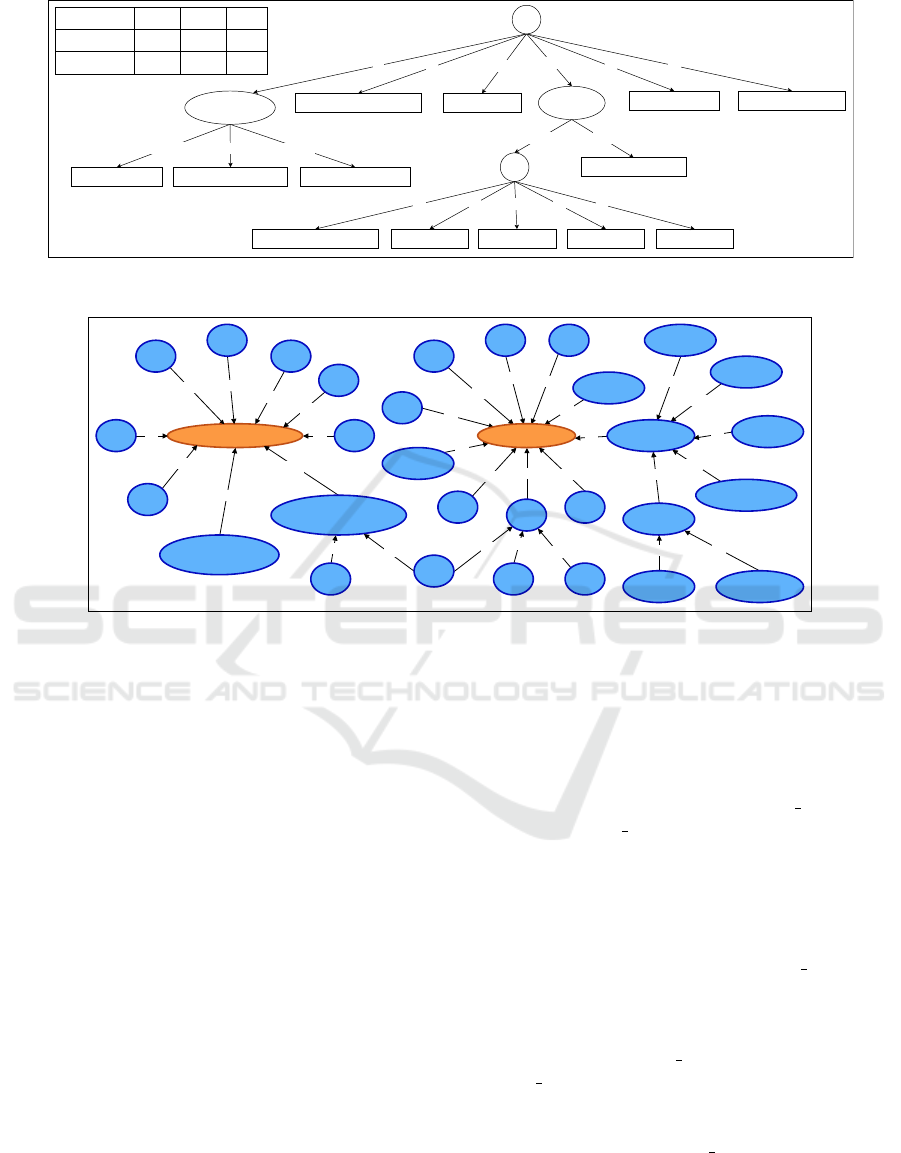
Since ARs do a broader search in the search
space, it is possible to observe some patterns re-
lated to each class in the obtained ExARN (Figure 2).
It can be noted, for example, that 3 items corre-
late with the dropout class, “Q10=A”, “Q04=A” and
“F5=RANGE-4”. These 3 rules cover 7 of the 31 in-
stances related to the dropout class (22.58%), while
the other 8 cover 37 of the 120 instances of the non-
dropout class (30.83%), which is a better result. How-
ever, it is important to mention that ExARN, unlike
a classifier, is not intended to classify, i.e, the set of
rules regarding each class does not generate a clas-
sifier. The set is used to identify and understand the
factors that may affect each of the objective items, in
this case, the classes (dropout, non-dropout).
0.5
Q10=A
0.67
F5=RANGE-4
0.75
Q04=A
CLASS=DROPOUT
Q11=D
Q10=G
Q01=E
Q02=D Q01=H
Q12=F
Q04=D
CIVIL_STATUS=OTHER
1.0
1.0
1.0
1.0
1.0
1.0
1.0
1.0
CLASS=NON_DROPOUT
Figure 2: ExARN results in Administration dataset without
undersampling.
Regarding the previous item, due to the charac-
teristics of the ARs, it may occur that a given item
is related to both classes. For example, the rules
Q04 = A ⇒ CLASS = DROPOUT and Q04 = A ⇒
CLASS = NON DROPOUT were obtained. How-
ever, the dropout rule has a Lift=3.65, while the non-
dropout a Lift=0.31. The difference between the val-
ues is considerable. Therefore, using the Lift to prune
the rules, before constructing the graph, makes it easy
to see that the item “Q04=A” is much more corre-
lated with the dropout class. This is easily viewed
through the network, which presents the item’s corre-
CSEDU 2020 - 12th International Conference on Computer Supported Education
94
=F
=E
=B
=A
=C
=D
Q04
=C
Q11
=SINGLE
=MARRIED =OTHER
CIVIL_STATUS
=YES =NO
AFRI_DESCNON_DROPOUT (52/12) DROPOUT (1)
DROPOUT (4/1) NON_DROPOUT (3)
DROPOUT (16/5) NON_DROPOUT (6/1) NON_DROPOUT (1)
NON_DROPOUT (5)
NON_DROPOUT (2) DROPOUT (1) DROPOUT (2) DROPOUT (0) DROPOUT (0)
=A
=B
=D =E
P R F1
0.344 0.355 0.349
0.832 0.825 0.828
DROPOUT
NON_DROPOUT
Figure 3: C4.5 results in Administration dataset with undersampling.
Q13=B
CLASS=NON_DROPOUT
0.83
1.0
Q01=E
1.0
Q04=D
1.0
Q02=D
1.0
Q11=D
1.0
CIVIL_STATUS=OTHER
1.0
Q01=H
1.0
Q10=G
0.83
CIVIL_STATUS=MARRIED
1.0
Q06=C
0.6
0.6
Q05=D
0.52
Q04=F
0.6
Q06=D
0.8
Q03=C
0.75
Q04=A
1.0
F3=RANGE-4
0.5
Q03=B
0.5
Q09=A
0.67
Q01=G
0.5
Q10=A
1.0
F5=RANGE-4
0.77
F1=RANGE-3
0.56
F5=RANGE-3
0.5
HITS=RANGE-3
1.0
F4=RANGE-3
0.83
GRADE=RANGE-3
0.5
F2=RANGE-3
1.0
HITS=RANGE-4
1.0
F1=RANGE-4
0.67
Q05=C
CLASS=DROPOUT
Figure 4: ExARN results in Administration dataset with undersampling.
lation with only one of the classes, with a confidence
of 75% (0.75), being a determinant item of it. This
idea is explored in (Gopalakrishnan et al., 2017), de-
scribed in Section 2, as “inverse rule”. However, in
this case, through the ExARN, the analysis is straight-
forward, since if the item appears related to only one
of the classes it is because it has a higher correlation
with it.
In this case, ExARN’s contribution to C4.5 is to
raise hypotheses about each of the classes, as C4.5
predicts based on the majority class. Therefore, the
ExARN can be of great help in unbalanced datasets.
Besides, even with items that correlate with more than
one class, such as “Q04”, it is easier to see, due to Lift
pruning, the items that correlate most with each class,
making it easier to understand the problem.
Results with Undersampling. To compare C4.5 re-
sults (Figure 3) with ExARN (Figure 4), the dataset
was balanced with undersampling considering a ra-
tio of 1:2. In this case, the model shown in Figure 3
is obtained with an accuracy of 72.85%. However, a
poor model with respect to the dropout class is still
obtained, as seen by precision (P), Recall (R) and F1
(F-measure) shown in the figure. Therefore, comple-
mentary views are needed, which identify interesting
patterns, as described bellow.
It is noted from the obtained results, as mentioned
in Section 1, that C4.5 is a greedy algorithm, i.e., once
the root is selected the process does not go back. This
can lead to specific rules that cover few instances,
such as rule Q04 = F AND C I V IL STATUS =
OT HER ⇒ NON DROPOUT , which covers only
one example. Another example is the rule Q04 = B ⇒
DROPOUT . Regarding the feature chosen as root, it
can be observed that the item “Q04=F”, in ExARN,
is directly related to the dropout class, and indirect
to the non-dropout class through the item “Q05=D”,
which correlates with the item “CIVIL STATUS =
MARRIED”. Therefore, it can be observed that
the item “Q04=F” is more correlated with the
dropout class, being the non-dropout class more re-
lated to the items “CIVIL STATUS=MARRIED” and
“CIVIL STATUS=OTHER”, regardless of the item
“Q04”. This information complements that pre-
sented in the tree. Also note that in ExARN the
items “Q04=F” and “CIVIL STATUS=MARRIED”
are influenced by the item “Q05=D”, being interest-
ing to explore this correlation. The items “Q04=A”
e “Q04=D”, associated with the dropout and non-
dropout classes, respectively, occur in both represen-
Dropout through Extended Association Rule Netwoks: A Complementary View
95

tations. Finally, correlations with low Lift values do
not appear in the graph, such as the rule Q04 = E ⇒
NON DROPOUT with Lift=1.15, that is outputted in
the tree.
Note that ExARN provides a lot of additional in-
formation regarding classes. For example, in relation
to the dropout class, it may be noted that other items
can be influencing it, such as “Q10=A”, “Q05=C”,
“Q03=B”, etc. The rules related to these items have a
good Lift value (>=1.25), indicating that they should
be explored. The same is true for the non-dropout
class.
Unlike the previous case (without undersam-
pling), the complementary view that ExARN offers
in relation to that expressed in C4.5 is clear. Note that
this view is important because of the classifier’s poor
performance in predicting the dropout class, even bal-
ancing the dataset. Finally, it is interesting to note that
dominant items did not appear on the graphs, which
means that, in a sense, the classes are separable.
6 CONCLUSIONS
This work presented the ExARN approach to treat the
dropout problem as a complementary view to what
is commonly used in the literature, i.e., classification
through C4.5. For this, experiments were performed
with data from one of the Etec’s courses. ExARN was
found to be an interesting approach to understand the
factors that lead a student to dropout. In addition, it is
a good alternative for unbalanced datasets.
It is important to note that the C4.5 focuses on im-
proving accuracy to make good predictions, with in-
terpretability being a secondary result, while ExARN
on presenting statistically significant correlations that
exist among items, with prediction being a secondary
result. Therefore, it can be noted that it is interest-
ing to treat the problem with different views, to help
the user to better understand the problem. This is a
gap identified in the literature, described in Section 2,
since only few works combine techniques and use hy-
brid solutions. Thus, efforts should be made to pro-
pose solutions following this idea. Multiple views are
needed when the focus is to understand the domain,
not only classify.
As future work we intend to propose a hybrid so-
lution to the dropout problem, mainly because it is
an important and unbalanced problem. As an indirect
result, an effort must be done in Etecs to store more
information about students to try to better map their
profile.
ACKNOWLEDGEMENTS
We wish to thank CAPES and FAPESP (2019/04923-
2) for the financial aid.
REFERENCES
Al-shargabi, A. A. and Nusari, A. N. (2010). Discovering
vital patterns from UST students data by applying data
mining techniques. In 2nd International Conference
on Computer and Automation Engineering (ICCAE),
volume 2, pages 547–551.
Datta, S. and Mengel, S. (2015). Multi-stage decision
method to generate rules for student retention. Journal
of Computing Sciences in Colleges, 31(2):65–71.
Delen, D. (2011). Predicting student attrition with data min-
ing methods. Journal of College Student Retention:
Research, Theory & Practice, 13(1):17–35.
Gopalakrishnan, A., Kased, R., Yang, H., Love, M. B.,
Graterol, C., and Shada, A. (2017). A multifaceted
data mining approach to understanding what factors
lead college students to persist and graduate. In Com-
puting Conference, pages 372–381.
Gustian, D. and Hundayani, R. D. (2017). Combination of
AHP method with C4.5 in the level classification level
out students. In International Conference on Comput-
ing, Engineering, and Design (ICCED), page 6p.
Hegazi, M. O., Alhawarat, M., and Hilal, A. (2016). An
approach for integrating data mining with Saudi Uni-
versities database systems: Case study. International
Journal of Advanced Computer Science and Applica-
tions, 7(6):213–218.
Manh
˜
aes, L. M. B., Cruz, S. M. S., and Zimbr
˜
ao, G. (2014).
WAVE: An architecture for predicting dropout in un-
dergraduate courses using EDM. In Proceedings of
the 29th Annual ACM Symposium on Applied Com-
puting (SAC), pages 243–247.
M
´
arquez-Vera, C., Cano, A., Romero, C., Noaman, A.
Y. M., Mousa Fardoun, H., and Ventura, S. (2016).
Early dropout prediction using data mining: A case
study with high school students. Expert Systems: The
Journal of Knowledge Engineering, 33(1):107–124.
Padua, R., Calcada, D. B., Carvalho, V. O., and Rezende,
S. O. (2018). Exploring the data using Extended As-
sociation Rule Network. In Brazilian Conference on
Intelligent Systems (BRACIS), pages 330–335.
Pereira, R. T. and Zambrano, J. C. (2017). Application of
decision trees for detection of student dropout profiles.
In 16th IEEE International Conference on Machine
Learning and Applications (ICMLA), pages 528–531.
Pertiwi, A. G., Widyaningtyas, T., and Pujianto, U. (2017).
Classification of province based on dropout rate us-
ing C4.5 algorithm. In International Conference on
Sustainable Information Engineering and Technology
(SIET), pages 410–413.
Tinto, V. (1993). Leaving College: Rethinking the Causes
and Cures of Student Attrition. University of Chicago
Press.
CSEDU 2020 - 12th International Conference on Computer Supported Education
96
