
The Comparison of 3D and 2D Measurement Techniques Used for the
Analysis of Vehicle Deformation
Pavlína Moravcová
1,2 a
, Kateřina Bucsuházy
1,2 b
, Robert Zůvala
2c
, Martin Bilík
1d
and Albert Bradáč
1e
1
Institute of Forensic Engineering, Brno University of Technology, Czech Republic
2
Transport Research Centre, Brno, Czech Republic
Keywords: Vehicle, Deformation, 2D, 3D, Accident Analysis, Laser Scan.
Abstract: As one of the main assumptions for the accident analysis has been detailed information about vehicle
deformation. The precise deformation depth allows to quantify deformation energy and related impact speed.
The aim of this paper has been the comparison of two selected methods used for the determination of
deformation depth. For the purpose of this paper were selected top-view photography as basic and cheap
method and 3D scanning as modern and advanced method. Different vehicles and 2 basic types of damage -
frontal and side impact - were chosen for the analysis. Also, the different range of vehicle deformation depth
were selected. On the basis of obtained results is possible to determine the applicability of these methods,
their advantages and limitations.
1 INTRODUCTION
Vehicle damage analysis (the vehicle deformation
respectively) has been one of the main assumptions
and inputs for the subsequent accident analysis (speed
calculation, determination of impact configuration,
etc.). The accident reconstruction based on energy
conservation principle was described by e.g.
(Campbell, 1974 or McHenry, 1986). In the Czech
Republic, the accident documentation and subsequent
accident analysis is conducted separately. The
documentation is usually carried out by Police
immediately after the accident occurrence at the
accident place. For the accident technical cause
determination (which usually involves vehicle speed
calculation) is usually required forensic expert. The
accuracy of the accident analysis is dependent on the
accuracy of the input data.
For the deformation measurement could be used a
variety of methods – the simplest is manual
measurement using measurement tape, deformation
jigs or grids (Brown, 1987). A detailed measurement
methodology using deformation jigs has been
a
https://orcid.org/0000-0002-9005-703X
b
https://orcid.org/ 0000-0003-1247-6148
c
https://orcid.org/ 0000-0003-2038-7292
d
https://orcid.org/ 0000-0003-3796-4658
e
https://orcid.org/ 0000-0001-7587-1474
published by e.g. Tumbas. For the deformation
measurement could be also used measurement from
photographs (especially top-view photo) as the low-
cost method for accident documentation. However,
photographs are sometimes unable to capture the
extent of damage. It is sometimes necessary to
combine top-view photo with photographs from
different angles, because some of the deformation can
be hidden under the hood (Boddorff, 1990). As the
modern methods are for documentation of vehicle
deformation used e.g. geodetic total stations,
quadrocopter, photogrammetry and especially 3D
scanning.
For some types of vehicle damage, only the 2D
representation (e.g. photography) is sufficient, some
types of vehicle deformation require detailed 3D
imaging (scanners, photogrammetry, etc.) (Massa,
Barrete; 1998). The accuracy of selected methods for
accident documentation was studied by a number of
previous studies. Comeau (1996) compared the
manual measurement with total station measurement.
The accuracy has been significantly influenced by
initial settings, especially accuracy of the manual
Moravcová, P., Bucsuházy, K., Z˚uvala, R., Bilík, M. and Bradá
ˇ
c, A.
The Comparison of 3D and 2D Measurement Techniques Used for the Analysis of Vehicle Deformation.
DOI: 10.5220/0009353601950202
In Proceedings of the 6th International Conference on Vehicle Technology and Intelligent Transport Systems (VEHITS 2020), pages 195-202
ISBN: 978-989-758-419-0
Copyright
c
2020 by SCITEPRESS – Science and Technology Publications, Lda. All rights reserved
195
measurement has been influenced by precision of the
investigator. The maximum deviation between
manual measurement and total station was 3 cm in the
maximum deformation region. The top view
photography was used by Boddorff (Boddorf, 1990),
the average measurement deviation ranged from 6 to
18 %. Significant differences could be influenced e.g.
by the hood of the vehicle which overlaps some of the
damaged measured parts. Also, the three-dimensional
imaging as photogrammetry and its accuracy has been
studied e.g. by (Tumbas, 1994, Fenton and Kerr,
1997; Neale, 2004). Using high resolution digital
images in conjunction with control points and
constraints from three-dimensional data has proven to
be an effective way to reconstruct vehicle damage
(Buck, 2007;
K
arczewsk, 2019). Nowadays,
especially high-resolution laser scanning is used for
the vehicle damage documentation (Callahan, 2012;
Kang, 2017). Laser scanning has been also widely
used for traffic accident documentation (Kamnik,
2020) or 3D human body analysis. Laser scanning
allows to detect traces which are unrecognizable at
the accident scene. Subsequent analysis also allows to
analyse traces from different perspective (Harrington,
2018). In terms of both financial and time
requirements, only photographs are still available in
most cases. The aim of this study has been the
comparison of two selected measurement methods –
2D (top-view photographs) and 3D (laser scanners)
and determine the applicability of these methods in
different types of impacts (frontal and side impacts).
2 METHODS
For the purpose of this study was selected two
methods: photography (top-view) as the widely used,
simplest and cheapest method and 3D laser scanning
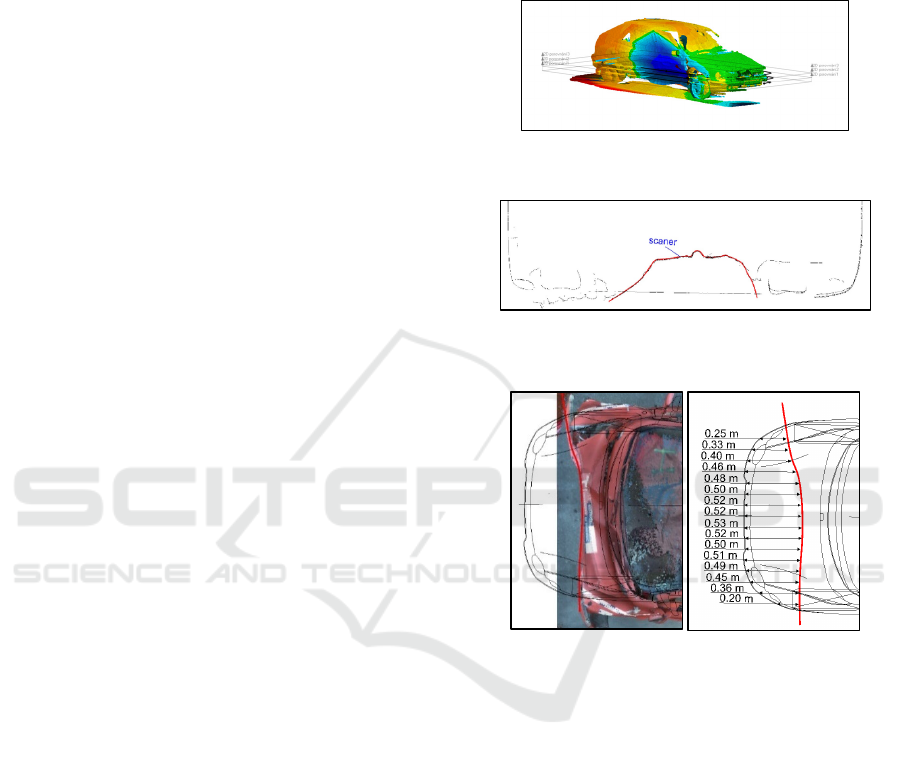
as one of the most modern method. The vehicle
deformation analysis using 3D scanning has been
performed by comparison of the damaged vehicle
scan with the similar undamaged vehicle model
(figure 2). 3D view allows to select the maximum
area of the vehicle damage (figure 1). The
measurement from the 3D scanning was realized
using 2D cut in the level of the maximum deformation
depth. As the software tool for the analysis of vehicle
scans were used Geomagic Control.
For the measurement of the deformation depth
using the top-view photography were used the photo
of damage vehicle and undamaged vehicle model
from the software Autoview (figure 3).
Predefined measurement points were defined on
each of the vehicles. The measurement points were
distributed equally by every 10 cm. The predefined
points allowed direct point-by-point comparison of
both used methods. The number of measured points
on each vehicle varied depending on the deformation
magnitude.
Figure 1: Analysis of 3D scans at maximum deformation
depth.
Figure 2: Analysis of 3D scans at maximum deformation
depth.
Figure 3: Analysis of photography – top-view.
For the analysis of the methods accuracy were
used 3 frontal and 3 side impacts. Selected vehicles
have not identical characteristics as e.g. vehicle body
stiffness, there has been not common feature.
Vehicles were selected on the basis of their
deformation in order to compare selected methods
over a wide range of deformation depth values.
3 RESULTS
3.1 Frontal Impacts
Figure 4, 5, 6, 7, 8, 9 show the obtained results – the
deformation depth in predefined measurement points
on the vehicle front. Figure 4 shows the deformation
depth measurement using the top-view photography
(left) and 3D scan (right) of the Skoda Karoq vehicle
VEHITS 2020 - 6th International Conference on Vehicle Technology and Intelligent Transport Systems
196
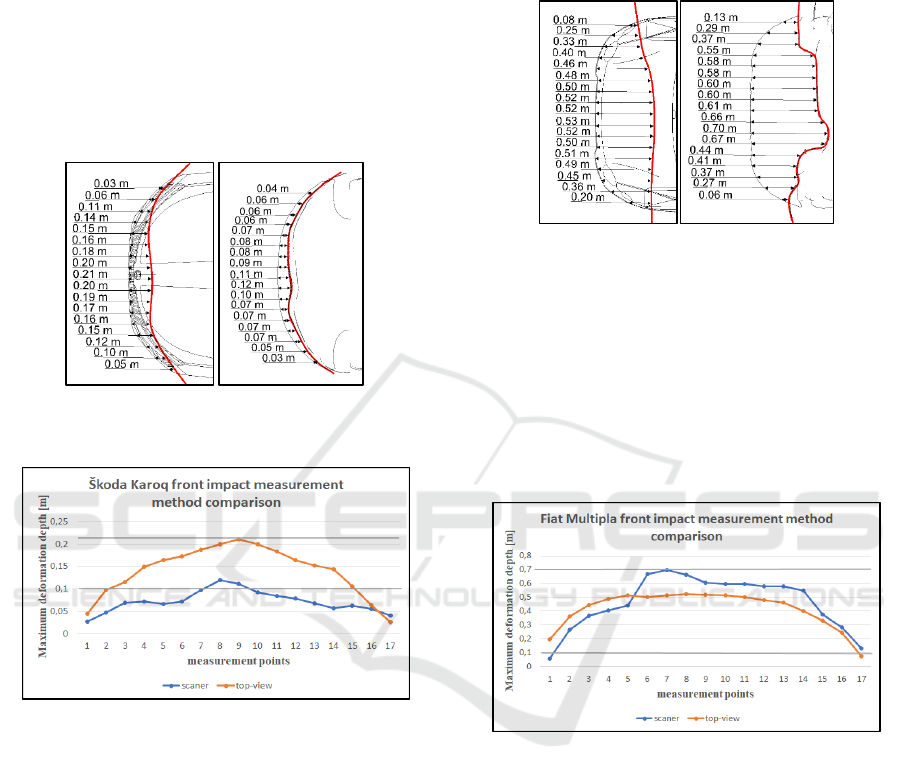
(F1). The vehicle front has been damaged over the
almost entire width - the front bumper, bonnet,
longitudinal beams including damage of the vehicle
deformation elements. The maximum deformation
depth determined using the top-view photography
was 21 cm, minimum about 3 cm. After a three-
dimensional analysis of the maximum damage area, a
2D cut was made at the height of 55 cm. The
maximum deformation depth determined using the
scan was 12 cm, minimum similarly as using top-
view photo about 3 cm.
Figure 4: Skoda Karoq frontal impact – top-view (left) vs.
scanner (right).
Figure 5: Skoda Karoq front impact measurement method
comparison.
Comparison of the measured deformation depth
value using the two selected methods demonstrates a
considerable difference of the obtained data.
Differences of the deformation depth could be
influenced mainly by the quality of the top-view
photography – e.g. taking photography at the wrong
angle which can subsequently distort the deformation
analysis.
Figure 6 shows full-width deformation of the Fiat
Multipla frontal part (F2). Compared to the previous
case study, the deformation magnitude was larger –
the front beams at the both sides of vehicle were
damaged.
The maximum deformation depth determined
using the top-view photography was 53 cm, minimum
about 2 cm. After a three-dimensional analysis of the
maximum damage area, a 2D cut was made at the
height of 50 cm. The maximum deformation depth
determined using the vehicle scans was 70 cm,
minimum about 6 cm.
Figure 6: Fiat Multipla frontal impact – top-view (left) vs.
scanner (right).
While in the previous case, the deformation depth
values were small and the comparison of the selected
methods showed significant differences, in this case
the comparison of the selected methods shows only
small differences. Larger differences of these
individual methods have been caused by the covering
of the deformation with the vehicle bonnet or other
vehicle parts (bumper, etc.).
Figure 7: Fiat frontal impact measurement method
comparison.
The following frontal collision of the Skoda
Felicia (hereinafter referred to as F3) is the most
prominent of the presented collisions. There was a
complete destruction of the front side of the vehicle,
including the front cross member, the left side beam
and significantly damaged front axle.
In case of measuring the deformation depth using
the top-view (Figure 8), the maximum deformation is
1,13 m and minimum is 13 cm. With the help of three-
dimensional analysis, the cut was made in a 50 cm
height, with a maximum deformation about 1,27 m
and minimum about 4 cm.
The Comparison of 3D and 2D Measurement Techniques Used for the Analysis of Vehicle Deformation
197
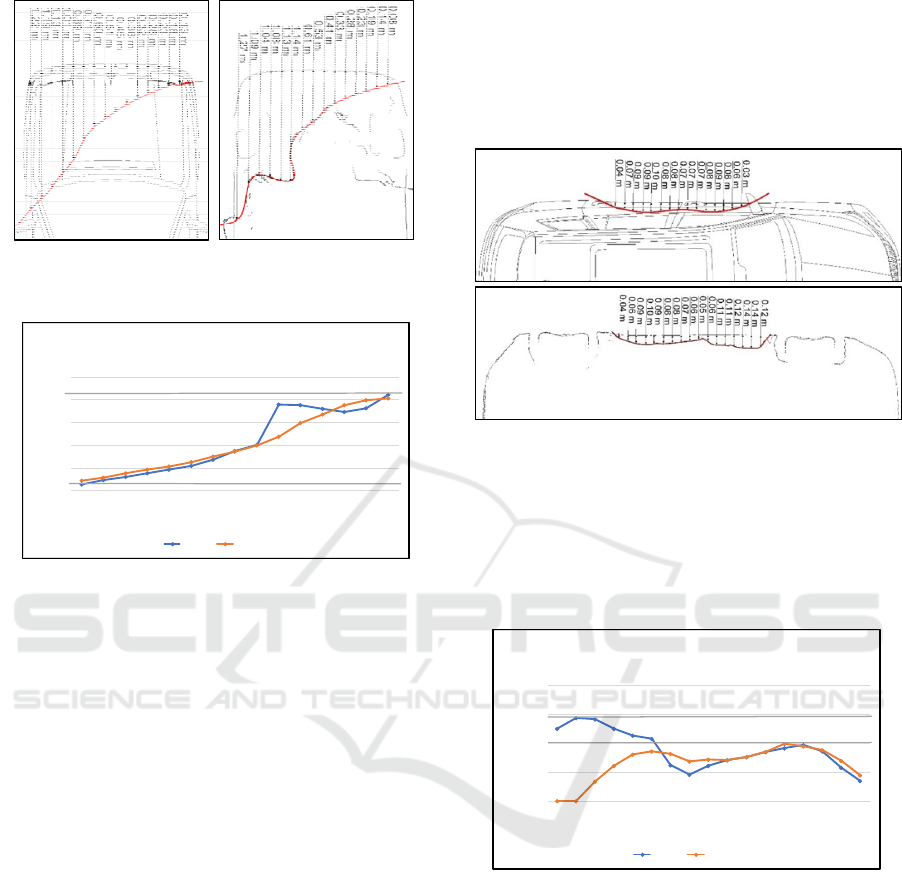
Figure 8: Skoda Felicia frontal impact – top-view (left) vs.
scanner (right).
Figure 9: Skoda Felicia front impact measurement method
comparison.
The graph (figure 9) shows us that even if such a
significant deformation of frontal vehicle part occurs,
the deviations are quite minimal. Deviations in
measurement in this case occurs due to overlap of the
deformation by the windscreen. In case of using
combination of methods (e.g. top-view photography
and photographs from different angles using of
levelling meter), this deviation could be completely
eliminated.
3.2 Side Impacts
The problematics of deformation measurements in
the side collisions is very actual. For the comparison
of selected methods were chosen three collision with
different character of deformation. Figures 10, 11, 12,
13, 14, 14 show the results for the measurement
points of the vehicles side.
First case shows side impact of a Skoda Kodiaq
(hereinafter referred to as S1). The deformation
occurs on the left side of the vehicle, between the A
and C pillars. The left front and rear doors were
damaged and the B pillar was slightly deformed.
Figure 10 (up) shows the measurement of the
deformation depth using the top-view, where the
maximum deformation was about 10 cm and the
minimum was about 4 cm. In three-dimensional
analysis, the maximum deformation section was
measured at a height of 55 cm from the ground
(Figure 10 - down). The maximum deformation of
that section was about 14 cm and the minimum about
4 cm.
Figure 10: Skoda Kodiaq side impact – top-view (up) vs.
scanner (down).
In the graph (figure 11) below could be observed
that in case of deformation up to 10 cm the deviations
are not significant, but above 10 cm the deviation is
already visible, even if it is not a significant
deformation.
Figure 11: Skoda Kodiaq side impact measurement method
comparison.
Another example of a side impact is presented in
the following figure. This is the side impact of the
Voyager Chrysler (S2). The deformation produced by
this impact was already greater than in the previous
example. The deformation depth of the S2 collision
using the top-view is shown in Figure 12, where the
maximum deformation was about 16 cm and the
minimum about 2 cm. In a three-dimensional
analysis, the maximum deformation section was at a
height of 60 cm (Figure 12 - down). The maximum
deformation was about 27 cm and the minimum about
3 cm.
0
0,3
0,6
0,9
1,2
1,5
123456789101112131415
Maximum deformation depth [m]
measurement points
SkodaFeliciafrontimpactmeasurementmethod
comparison
scaner top‐view
0
0,05
0,1
0,15
0,2
1234567891011121314151617
Maximum deformation depth [m]
measurement points
SkodaKodiaqsideimpactmeasurement
methodcomparison
scaner top‐view
VEHITS 2020 - 6th International Conference on Vehicle Technology and Intelligent Transport Systems
198
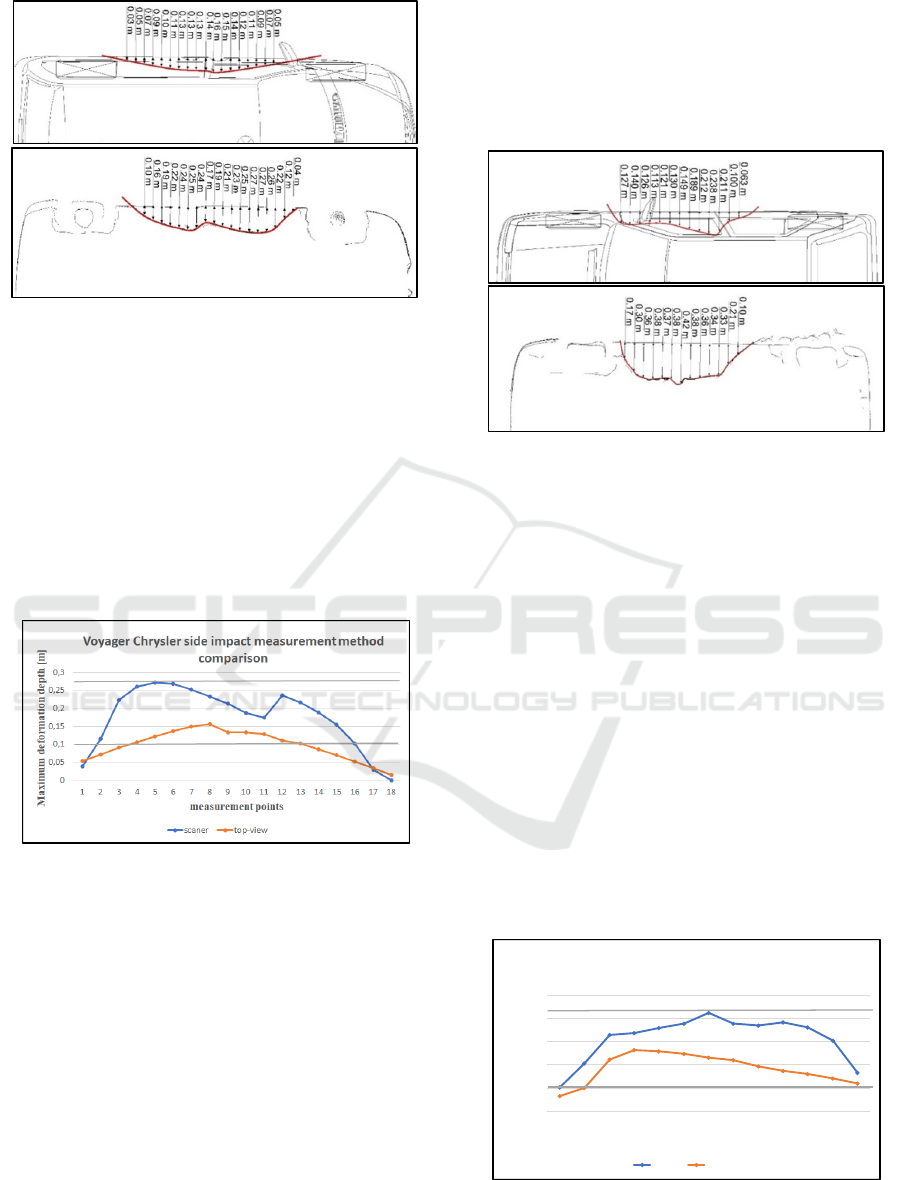
Figure 12: Chrysler Voyager side impact – top-view (up)
vs. scanner (down).
The following graph (figure 13) shows similarly
as in previous case study not significant deviation in
case of deformation up to 10 cm. A significant change
occurs in the case of more extent side deformation,
such a large deformation may not be apparent from
the photograph. As can be seen e.g. in case of
maximum deformation. When using a scanner,
maximum deformation was measured about 27 cm.
Using the top-view photograph at the same point
there was the depth of deformation only about 12 cm.
Figure 13: Voyager Chrysler side impact measurement
method comparison.
The last example of a side impact is the Skoda
Felicia (hereinafter referred to as S3). The
deformation of the S3 impact can be quantified as the
most significant of the side impact measurement
series. Almost the entire right side of the vehicle has
been damaged. The apparent deformation was
between the right A and C pillars and both vehicle
doors were dented inside the vehicle. Furthermore,
the right B pillar and the right doorsill (at the B pillar
level) were broken.
When subtracing the deformations of the S3
impact using the top-view of the photograph (Figure
14 - up), the maximum deformation was about 26 cm
and the minimum of 6 cm. The three-dimensional
analysis was again performed at the maximum
deformation level and subsequently confirms that the
impact was really striking (the greatest). The cut was
measured at a height of 50 cm above the ground, the
maximum deformation is was around 42 cm and a
minimum about 10 cm.
Figure 14: Skoda Felicia side impact – top-view (up) vs.
scanner (down).
The case of side impact of S3 and the subsequent
comparison of the two measurement methods shows
that in the case of significant deformation, there are
significant deviations between these methods as its
shown in the graph below. Similarly as during
analysis of F3 impact, this deviation can be
eliminated by combination of top-view photography
with another method of deformation measurement
(e.g. levelling rod, meter, crush jigs, etc.). Case S3
also illustrate limitation of using this methodology for
analysis of deformation from 3D scanner. Using only
one 2D cut in the maximum deformation level can
lead to inaccuracy in local maximum – e.g. in point 7
of S3 is the level of deformation higher in comparison
with the other points. The maximum value could be
caused e.g. by local crack. To achieve precise values
and eliminate local errors would be more appropriate
to use average of multiple sections (2D cuts).
Figure 15: Skoda Felicia side impact measurement method
comparison.
0
0,1
0,2
0,3
0,4
0,5
1 2 3 4 5 6 7 8 9 10111213
Ma ximum deformation depth [m]
measurement points
SkodaFeliciasideim pactmeasurementmethod
comparison
scaner top‐view
The Comparison of 3D and 2D Measurement Techniques Used for the Analysis of Vehicle Deformation
199
3.3 Comparison of Selected Methods
Accuracy
The deformation depth at the measured points was
subsequently evaluated and plotted. From the graphs
below, it is evident that in lateral impacts (Figure 16),
the depth of deformation up to 10 cm is within a slight
but acceptable tolerance. As the depth of deformation
increases, so does the deviation from the ideal
tendency. In some cases, it is up to 50% deviation,
especially in the area of maximum deformation depth.
There are several limitations of top-view
photography. The accuracy of the obtained data is
significantly influenced by the quality of
photography, very important influence has been also
the angle of taken photo. In cases where deformation
interferes to the vehicle interior, the top-view
photography method is not applicable for
deformation analysis. Therefore, when evaluating
these types of deformation, a combination of
measurement methods must be considered to achieve
higher measurement accuracy.
Figure 16: Side impact measurement differences
comparison.
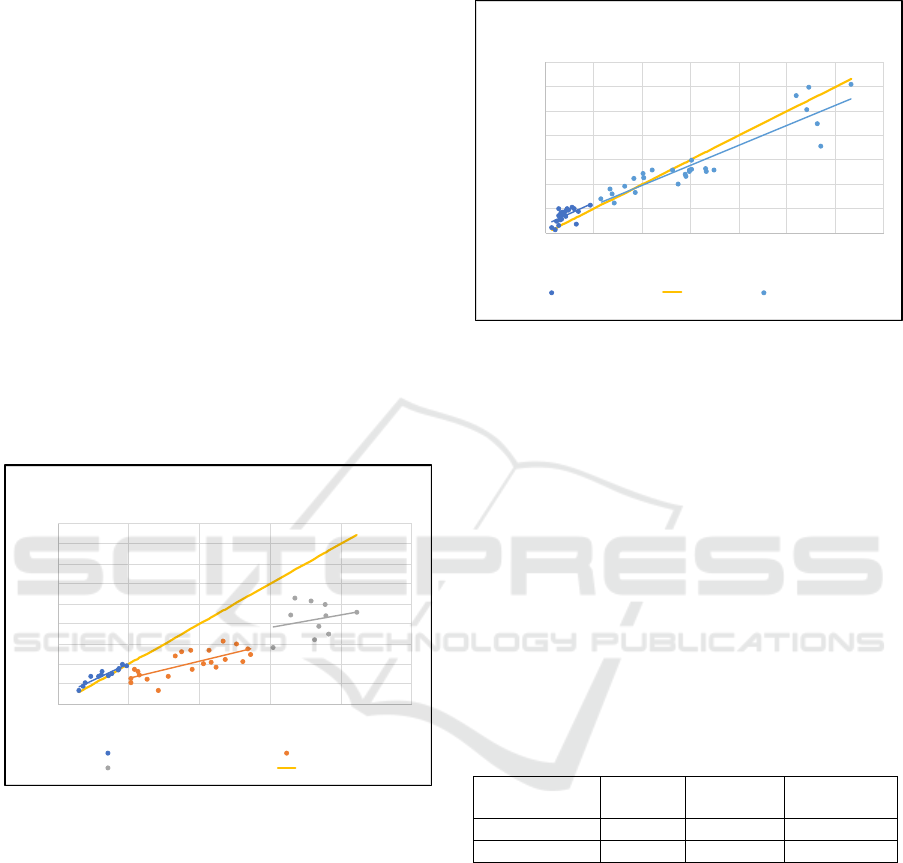
In the case of frontal impact and subsequent
comparison of the measurement methods, the
deviation is significantly lower compared to the side
impact. With increasing depth of deformation, the
deviation is higher but not as significant as in side
impacts. But even here it is necessary to consider the
so-called hidden deformations, which may not be
obvious at first sight. These are, for example,
deformations occurring at lower velocities, where
elastic deformation is largely occurring plastic
deformation is “hidden”. The elasticity of the material
has an overall effect on the measurement of the
deformation depth (regardless of the type of used
method), the measured values will be lower compared
to the real vehicle damage.
Figure 17: Frontal impact measurement differences
comparison.
The basic statistical parameters were analysed to
compare the methods of measuring the deformation
depth. The deviation of the vehicle frontal
deformation measurement is given in the table below
(Table 1). The average deviation of the measurement
increases with the depth of the deformation and
ranges up to about 10 cm. The maximum deviation is
around 43 cm, this significant deviation being found
at F3 (see figures 8 and 9), in this case the
deformation depth was covered by the windshield of
the vehicle by using the top-view method. As
mentioned above, this inaccuracy can be eliminated
by using multiple methods.
Table 1: Frontal impact measurement deviation
comparison.
deviation Mean [cm]
Minimum
[cm]
Maximum
[cm]
to 10 c
m
7,1 0,8 14,2
from 11 c
m
9,4 1,1 42,6
In case of lateral deformation (Table 2), the
measurement deviation increases substantially. The
average deviation up to 10 cm of the deformation
depth is about 1 cm, above 11 cm this deviation
increased. Increasing deviation is evident in all
measurement cases (S1, S2 and S3). Above 31 cm,
the average deviation is about 15 cm and maximum
up to 21 cm. This is the case of S3 (see Figure 15),
where a significant deformation of the vehicle interior
occurred, therefore it was not possible to identify the
real deformation extent using only the top-view
photography.
R²=0,8826
R²=0,5419
R²=0,0597
0
0,05
0,1
0,15
0,2
0,25
0,3
0,35
0,4
0,45
0 0,10,20,30,40,5
To p-Vie w [m]
Scaner [m]
Sideimpactmeasurementdiff erences
comparison
upto10cm 11‐30cm
31cmandmore idealstate
R²=0,3518
R²=0,8413
0
0,2
0,4
0,6
0,8
1
1,2
1,4
0 0,2 0,4 0,6 0,8 1 1,2 1,4
To p-Vi e w [m]
Scaner [m]
Frontal impactmeasurementd iffer ences
comparison
upto20cm ideal 21cmandmore
VEHITS 2020 - 6th International Conference on Vehicle Technology and Intelligent Transport Systems
200
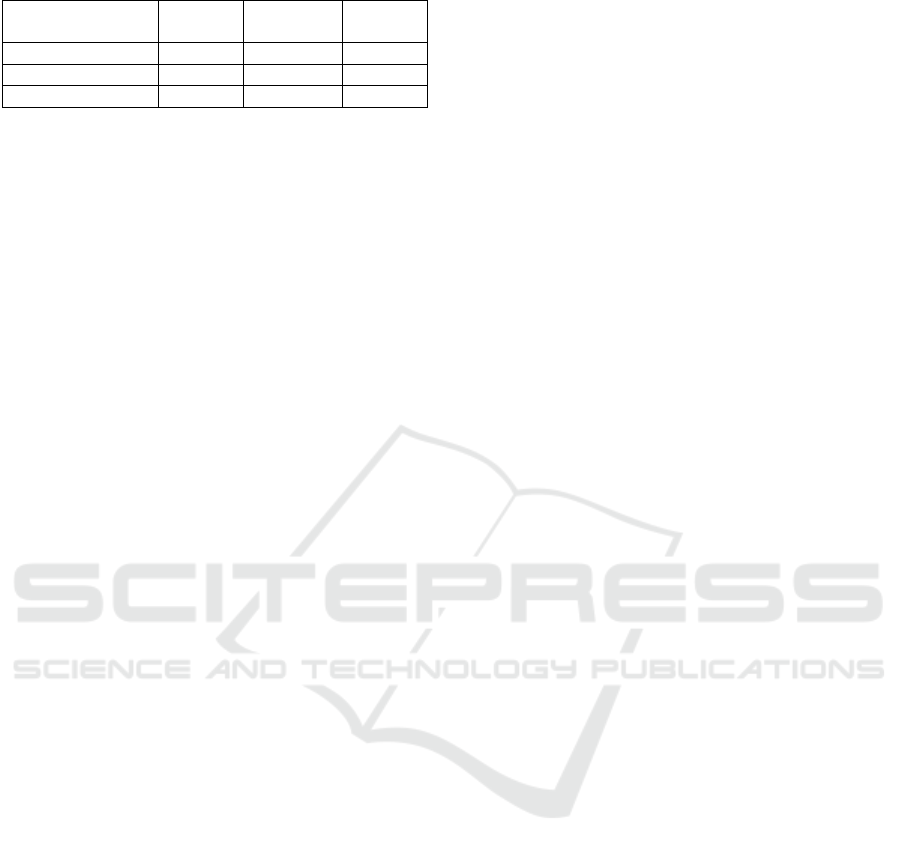
Table 2: Side impact measurement deviation comparison.
deviation Mean [cm]
Minimum
[cm]
Maximum
[cm]
to 10 c
m
0,8 0,0 2,2
from 11 to 30 cm 8,5 2,2 15,5
from 31 c
m
15,1 7,1 20,8
4 DISCUSSION
The aim of this study was to compare selected
methods (top-view photography as basic and cheap
method and 3D scanning as modern and advanced
method) with respect to the achieved accuracy of
deformation depth values as one of the basic
parameters for the analysis of the accident. Similar
methodology was used by Randles (2010) for the
comparison of the photogrammetry and hands-on
measurement. Different vehicles and 2 basic types of
damage - front and side impact - were chosen for the
analysis. Also, the different range of vehicle
deformation depth were selected. Differences of the
deformation depth measurement using scanning and
top-view photography were illustrated by Figure 16
and Figure 17.
Obtained results illustrate not significant
differences between the selected methods used for the
analysis of frontal impact. Inaccuracy could be
caused if the vehicle deformation has been covered by
some of the vehicle parts (e.g. bonnet, bumper). This
is however limitation of most of the used methods.
Similar results have been proved also by some of the
previous studies – e.g. (Boddorff, 1990). As stated by
Comeau or Boddorf (Comeau, 1996; Boddorff,
1990), more accurate results could be achieved by
understanding of the methods for accident
reconstruction and documentation limitation. These
conclusions illustrate the importance of these type of
studies.
The highest deviations of the obtained results
were related to the analysis of side impact. The usage
of top-view photography has been very limited in
case of side impact. While there are no significant
deviations in the case of minor damage (up to 10 cm),
bigger deformation depth (from 20 cm) shows
significant inaccuracies when using top-view
photography. It is therefore necessary to use a
combination of several methods in such cases. The
use of modern methods such as 3D scanning allows
to achieve accurate results. The biggest disadvantage
of three-dimensional methods has been the high
purchase price and especially in case of
photogrammetry the lack of time at the accident
scene. (Massa a Barrette, 1998; Terpstra 2019).
Three-dimensional methods could serve not only for
the analysis of vehicle damage but also can provide a
comprehensive view of the whole accident site.
(Coleman 2015; Callahan, 2012; Terpstra 2019).
The aim of the follow-up studies will be the
comparison of some of the other commonly used
methods for the deformation depth determination
(photogrammetry, total geodetic station, crash jigs,
etc.). The methods will be evaluated with respect to
the achieved accuracy, but also in relation to the type
of vehicle damage or the extent of vehicle
deformation respectively. Most of the previous
studies used for the analysis of the methods accuracy
simulated accident scenario (e.g. Randles, 2010;
Gaffney, 2015; Castaneda, 2012). As one of the main
advantages of the study could be mentioned that not
only the deformation of the vehicles damaged during
crash tests or simulated accident scenarios were
analysed, but also the real accidents. Working on the
scene of real accidents has certain specifics compared
to crash tests - especially time pressure due to road
closure and related congestion, the accident
participant presence on spot, etc. These factors could
significantly affect the achieved accuracy and thus
distort the obtained results. In the future work, the
comprehensive assessment will be carried out with
the aim to create the methodology for vehicle
deformation documentation with respect to the extent
and type of the vehicle damage.
5 CONCLUSIONS
With increase of the traffic intensity also the number
of accidents increases. The traffic accident
occurrence is associated with society-wide losses not
only directly from the accident itself but also in
relation to the congestion due to the road closures at
the accident sites. The duration of the accident site
documentation as well as vehicle deformation
documentation has been important parameter. The
time pressure during accident documentation may
subsequently resulted to the insufficient
documentation of the accident site and vehicles as
well as the overall data quality (Topolšek 2013). The
financial demand of the acquisition and data storage
requirements are also necessary to take into account.
The aim of this article was to determine the
applicability of selected methods depending on their
accuracy in relation to the various types of collisions
and extent of vehicle damage. On the basis of the
selected results could be established that for the
frontal impacts is mostly sufficient to use
conventional methods. These methods are also
The Comparison of 3D and 2D Measurement Techniques Used for the Analysis of Vehicle Deformation
201

suitable for small deformation (up to 10 centimetres).
For the purpose of the side impacts and large
deformation depth it is necessary to use modern
documentation methods (e.g. scanner) or at least the
combination of several methods.
ACKNOWLEDGEMENTS
This article was produced with the financial support
of the Ministry of Transport within the programme of
long-term conceptual development of research
institutions on the research infrastructure acquired
from the Operation Programme Research and
Development for Innovations (CZ.1.05/2.1.00/
03.0064).
REFERENCES
Brach, M., & Brach, R. M. (1998). Crush Energy and Planar
Impact Mechanics for Accident Reconstruction. SAE
Technical Paper Series. doi:10.4271/980025
Campbell, K. L. (1974). Energy Basis for Collision
Severity. SAE Technical Paper
Series. doi:10.4271/740565
McHenry, R. R., & McHenry, B. G. (1986). A Revised
Damage Analysis Procedure for the CRASH Computer
Program. SAE Technical Paper Series.
doi:10.4271/861894
Brown, D. R., Wiechel, J. F., Stansifer, R. L., & Guenther,
D. A. (1987). Practical Application of Vehicle Speed
Determination from Crush Measurements. SAE
Technical Paper Series. doi:10.4271/870498
Tumbas, N. S., & Smith, R. A. (1988). Measuring Protocol
for Quantifying Vehicle Damage from an Energy Basis
Point of View. SAE Technical Paper
Series. doi:10.4271/880072
Boddorff, T. C. and Jones, I. S., “Simple Overhead
Photography Techniques for Vehicle Accident
Reconstruction,” SAE Technical Paper 900370, 1990.
Comeau, J.-L., Dalmotas, D. J., German, A., Monk, B., &
Trépanier, D. (1996). Crush Measurement for Side
Impacts Using a Total Station. SAE Technical Paper
Series. doi:10.4271/960100
Massa, D. J., & Barrette, R. W. (1998). Using Three-
Dimensional Digitization to Model a Vehicle. SAE
Technical Paper Series. doi:10.4271/980377
Terpstra, T., Dickinson, J., Hashemian, A., and Fenton, S.,
"Reconstruction of 3D Accident Sites Using USGS
LiDAR, Aerial Images, and Photogrammetry," SAE
Technical Paper 2019-01-0423, 2019
Coleman, C., Tandy, D., Colborn, J., & Ault, N. (2015).
Applying Camera Matching Methods to Laser Scanned
Three Dimensional Scene Data with Comparisons to
Other Methods. SAE Technical Paper Series.
doi:10.4271/2015-01-141
Tumbas, Nicholas, S., Kinney, J., Rolly, Smith, C.,
Gregory, C., “Photogrammetry and Accident
Reconstruction: Experimental Results,” SAE 940925,
1994
Fenton, Stephen, Kerr, Richard, “Accident Scene
Diagramming Using New Photogrammetric
Technique”, SAE 970944, 1997
Neale, W. T. C., Fenton, S., McFadden, S., & Rose, N. A.
(2004). A Video Tracking Photogrammetry Technique
to Survey Roadways for Accident Reconstruction. SAE
Technical Paper Series. doi:10.4271/2004-01-1221
Callahan, M., LeBlanc, B., Vreeland, R., and Bretting, G.,
"Close-Range Photogrammetry with Laser Scan Point
Clouds," SAE Technical Paper 2012-01-0607, 2012
Randles, B., JoneS, B., Welcher, J., Szabo, T. et al., "The
Accuracy of Photogrammetry vs. Hands-on
Measurement Techniques used in Accident
Reconstruction," SAE Technical Paper 2010-01-0065,
2010
Gaffney, T., Winter, B., Elston, A., Sandvik, A. et al.,
"Method for Estimating Vehicle-Specific Frontal
Stiffness Values in the Absence of an Applicable Crash
Test Using Methodically-Distilled Data from the
NHTSA Crash Database (Phase 1)," SAE Technical
Paper 2015-01-0027, 2015, doi:10.4271/2015-01-0027
Harrington, S., & Lebak, G. (2018). The Placement of
Digitized Objects in a Point Cloud as a
Photogrammetric Technique. SAE International
Journal of Transportation Safety, 6(2). doi:10.4271/09-
06-02-0007
Karczewski, M.. Influence of 3D scanner parameters on
accuracy evaluation of vehicle element deformation. In:
AIP Conference Proceedings, 2019, 2078(1). DOI:
10.1063/1.5092015.
Kang, H. J. a I. Han. 3-Dimensional Scanning/Modeling for
Analysis of Vehicle Collision Accidents. Transactions
of the Korean Society of Automotive Engineers. 2017,
(25), pp. 541-547. DOI: 10.7467/KSAE.2017.25.5.541.
Buck, U., Naether, S., Braun, M., Bolliger, S., Friederich,
H., Jackowski, C., … Thali, M. J. (2007). Application
of 3D documentation and geometric reconstruction
methods in traffic accident analysis: With high
resolution surface scanning, radiological MSCT/MRI
scanning and real data based animation. Forensic
Science International, 170(1), 20–28.
doi:10.1016/j.forsciint.2006.08.024
Kamnik, R., Nekrep Perc, M., & Topolšek, D. (2020).
Using the scanners and drone for comparison of point
cloud accuracy at traffic accident analysis. Accident
Analysis & Prevention, 135, 105391.
doi:10.1016/j.aap.2019.105391
VEHITS 2020 - 6th International Conference on Vehicle Technology and Intelligent Transport Systems
202
