
Variability Evaluation of CNNs using Cross-validation on Viruses Images
Andr
´
e R. de Geus
1
, Andr
´
e R. Backes and Jefferson R. Souza
School of Computer Science, Federal University of Uberl
ˆ
andia, Av. Jo
˜
ao Naves de
´
Avila, 2121, Uberl
ˆ
andia, MG, Brazil
Keywords:
Convolutional Neural Network, Cross-validation, Virus Classification.
Abstract:
Virus description and recognition is an essential issue in medicine. It helps researchers to study virus attributes
such as its morphology, chemical compositions, and modes of replication. Although it can be performed
through visual inspection, it is a task highly dependent on a qualified expert. Therefore, the automation of this
task has received great attention over the past few years. In this study, we applied transfer learning from pre-
trained deep neural networks for virus species classification. Given that many image datasets do not specify a
fixed training and test sets, and to avoid any bias, we evaluated the impact of a cross-validation scheme on the
classification accuracy. The experimental results achieved up to 89% of classification accuracy, outperforming
previous studies by 2.8% of accuracy.
1 INTRODUCTION
Machine Learning (ML), a subset of Artificial Intel-
ligence (AI), has revolutionized many research fields
since the mid-1950s. It was responsible for the ad-
vent of Artificial Neural Networks and, more recently,
Deep Learning (DL) methods. These latter are cur-
rently state-of-the-art in many problems that can be
tackled via machine learning, in particular, classifi-
cation problems. One of the most popular DL meth-
ods in computer vision is the Convolutional Neural
Network (CNN). These networks are characterized
by being composed basically of convolutional layers,
which processes the inputs considering local receptive
fields. The main application of CNNs is to process
visual information since the convolution enables us to
filter images considering its two-dimensional spatial
structure (Ponti et al., 2017). Research works on CNN
have enabled us to process images (whether aerial,
macroscopic or microscopic) which previously could
not be processed.
Virus description and recognition is an essential
issue in medicine. It helps researchers to study virus
attributes such as its morphology, chemical compo-
sitions, and modes of replication. Due to its impor-
tance, and the fact that this is a task highly depen-
dent on a qualified expert, it has received great atten-
tion in recent years. In (Proenc¸a et al., 2013), tex-
ture descriptors are used to automate the segmenta-
tion of polyomavirus particles. The authors in (dos
Santos et al., 2015) describe how to build an ensem-
ble of different texture analysis methods to classify
virus images acquired via Transmission Electron Mi-
croscopy (TEM) (Biel and Madeley, 2001). In (Wen
et al., 2016), the authors combined PCA filters and the
Completed Local Binary Patterns (CLBP) method to
extract texture descriptors from virus images for clas-
sification purposes. Similarly, Dijkstra’s algorithm is
used to extract a texture signature to classify viruses
in (Ghidoni et al., 2014).
Due to the importance of TEM virus images,
this study proposes the use of transfer learning from
four pre-trained deep neural networks (SqueezeNet,
ResNet, InceptionV3, and DenseNet) for virus im-
age classification. Moreover, given that the evaluated
virus dataset does not specify a training and testing
sets, and to avoid any bias, we also propose to eval-
uate the impact of a cross-validation scheme on the
classification accuracy.
The remaining of this paper is organized as fol-
lows: in Section 2, we present a review of the CNN
and the CNN models used in this work. Section 3 de-
scribes the dataset used to evaluate the different CNN
models. In Section 4, we describe the experimental
setup, while Section 5 discuss the results obtained by
each CNN model. Section 6 concludes the paper.
2 CONVOLUTIONAL NEURAL
NETWORK (CNNs)
Convolutional Neural Network (CNN) is a class of
deep learning models whose goal is to learn and to
626
R. de Geus, A., Backes, A. and Souza, J.
Variability Evaluation of CNNs using Cross-validation on Viruses Images.
DOI: 10.5220/0009352106260632
In Proceedings of the 15th International Joint Conference on Computer Vision, Imaging and Computer Graphics Theory and Applications (VISIGRAPP 2020) - Volume 4: VISAPP, pages
626-632
ISBN: 978-989-758-402-2; ISSN: 2184-4321
Copyright
c
2022 by SCITEPRESS – Science and Technology Publications, Lda. All rights reserved

extract semantic features for image classification and
segmentation (Huang et al., 2017; He et al., 2016;
Szegedy et al., 2016; Krizhevsky et al., 2012). A
CNN is a bio-inspired network that uses the concept
of receptive fields to explore spatial correlations in the
image, so that it is capable of transforming and of re-
ducing image information, thus obtaining a meaning-
ful representation of its content.
Any CNN has its main structure defined by three
types of layers: convolutional, pooling, and fully con-
nected layer. The convolutional layer uses the convo-
lution operation to emulate a receptive field and its re-
sponse to a visual stimulus. The convolutional layer is
the primary layer of CNN since it acts as an attribute
detector in the image. Pooling layers help to re-
duce the dimensionality of the image as also the CNN
sensitivity to image distortions and shifting. A few
fully connected layers, followed by a softmax layer
(Krizhevsky et al., 2012), are located at the end of
CNN, and they are used for classification, outputting
the most probably class for a given image.
Due to the difficult to model, train, and test
different network models, large computing compa-
nies (such as Google and Microsoft) have developed
CNNs models and trained them in large image data
sets. These pre-trained networks can be used to learn
generic features of new datasets, while we fine-tune
the output of the network to this new problem. In this
work, we used InceptionV3, ResNet, SqueezeNet,
and DenseNet models pre-trained on the 2012 Ima-
geNet image data set, which contains 1000 classes:
• InceptionV3: Google’s research team proposed
this network model, and it introduces the incep-
tion module as an approach to reduce the compu-
tational load of CNNs while maintaining its per-
formance (Szegedy et al., 2016). The inception
module is based on factorizing and asymmetric
convolutions, in which the main goal is to re-
duce the number of connections/parameters of the
network without decreasing its efficiency. Incep-
tionV3 is a large CNN containing 23.8 millions of
parameters.
• ResNet: Microsoft Research (He et al., 2016)
proposed this network model, and it uses resid-
ual learning to improve network accuracy. ResNet
learns residues by using a scheme of skip connec-
tion to propagate information over layers. As a re-
sult, this scheme enables us to create deeper net-
works as it minimizes the problem of vanishing
gradients. Depending on its structure, the num-
ber of layers in ResNet can range from 18 to 152
layers, and up to 100.11 millions of parameters.
• DenseNet: different from other CNN models,
DenseNet (Huang et al., 2017) is considered a
small network is having 8 millions of parameters.
Similar to ResNet, it uses the concept of residue
connections as building blocks of its model. How-
ever, DenseNet proposes to concatenate the previ-
ous layers instead of using a summation. Addi-
tionally, DenseNet presents more group connec-
tions than other networks, so that feature maps of
all predecessor layers are used as input to all sub-
sequent layers.
• SqueezeNet: this model (Iandola et al., 2016)
was designed to be a smaller network model, but
still capable of achieving results similar to bigger
models. It introduces the concept of Fire mod-
ules with squeeze convolution layers (only 1 × 1
filters), that are fed to an expanded layer. This
model results in a network with 50× fewer pa-
rameters than AlexNet, and ideal for application
in hardware with limited memory.
Table 1 shows the number of parameters, input
size and number of convolutions of each network
model evaluated.
Table 1: CNN models specifications.
CNN # of Input # of
model parameters size conv.
DenseNet 8.0M 224 × 224 120
ResNet 25.6M 224 × 224 104
InceptionV3 23.8M 299 × 299 197
SqueezeNet 1.2M 224 × 224 24
3 IMAGE DATASET
To study the variability of CNN when subjected to
a cross-validation scheme, we opted to use an im-
age dataset presenting high inter-class and low intra-
class similarity, as it poses an additional challenge
for classification tasks. To accomplish, that we used
the virus dataset available at www.cb.uu.se/
∼
gustaf/
virustexture/. Further details on how the images were
obtained can be found in (Kylberg et al., 2012).
This dataset contains 1500 Transmission Electron
Microscopy (TEM) images. These images represent
15 different types of viruses: Adenovirus, Astrovirus,
CCHF, Cowpox, Dengue, Ebola, Influenza, Lassa,
Marburg, Norovirus, Orf, Papilloma, Rift Valley, Ro-
tavirus, WestNile. Each virus type is represented by
100 images of 41 × 41 pixels size. Although this
database is available in 8-bits and 16-bits formats,
we used only the 8-bits format in our experiments to
avoid normalization problems during the training of
the CNN.
Variability Evaluation of CNNs using Cross-validation on Viruses Images
627
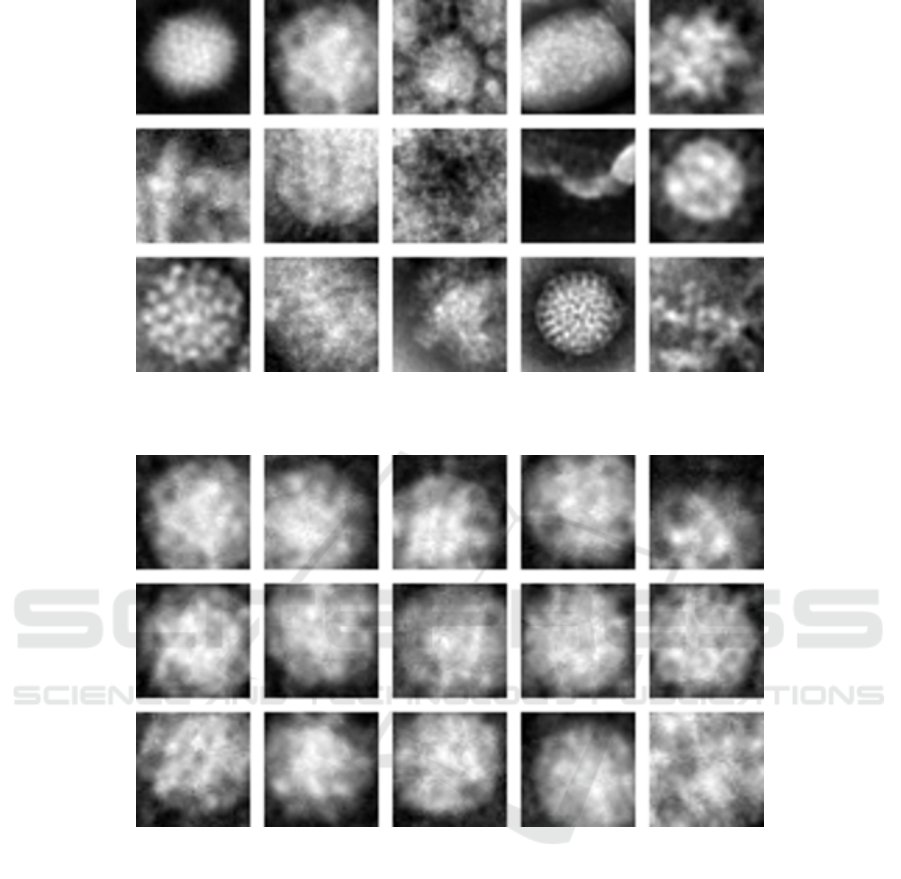
Figure 1: The virus database. from top left to right bottom: Adenovirus, Astrovirus, CCHF, Cowpox, Dengue, Ebola,
Influenza, Lassa, Marburg, Norovirus, Orf, Papilloma, Rift Valley, Rotavirus and WestNile (Source: paper (Kylberg et al.,
2011) and www.cb.uu.se/
∼
gustaf/virustexture/).
Figure 2: Examples of variation within a class (Source: paper (Kylberg et al., 2011) and www.cb.uu.se/gustaf/virustexture/).
Figure 1 shows one example of each virus type,
while Figure 2 shows an example of variation within
the class of a single virus type.
4 EXPERIMENTS
In our experiments, we aimed to investigate the use of
different CNN models in a virus classification prob-
lem and to evaluate the variability of these networks
when subjected to a cross-validation scheme. Given
that most of the image datasets do not specify a fixed
train and test sets, we propose to train the networks
with the k-fold method to better estimate their accu-
racy.
To properly train all network models and to avoid
any bias, we must ensure that the different models are
trained using the same subset of samples. To accom-
plish that, we split the dataset into 10 disjoint sets
(k = 10) so that the same subset of samples would
be used to train each network.
During the experiments, we used the pre-trained
2012 ImageNet weights for all CNN models, and we
fine-tuned the network output (fully connected lay-
ers) to our problem. According to (Yosinski et al.,
2014), the use of low-level features learned in larger
datasets achieves better results when compared to fea-
tures learned using a network trained from scratch in
a smaller dataset. ImageNet data set contains approx-
imately 1.2 million images divided into 1000 classes.
As shown in Table 1, each CNN model has a fixed
input layer structure, so that the images in the Virus
VISAPP 2020 - 15th International Conference on Computer Vision Theory and Applications
628
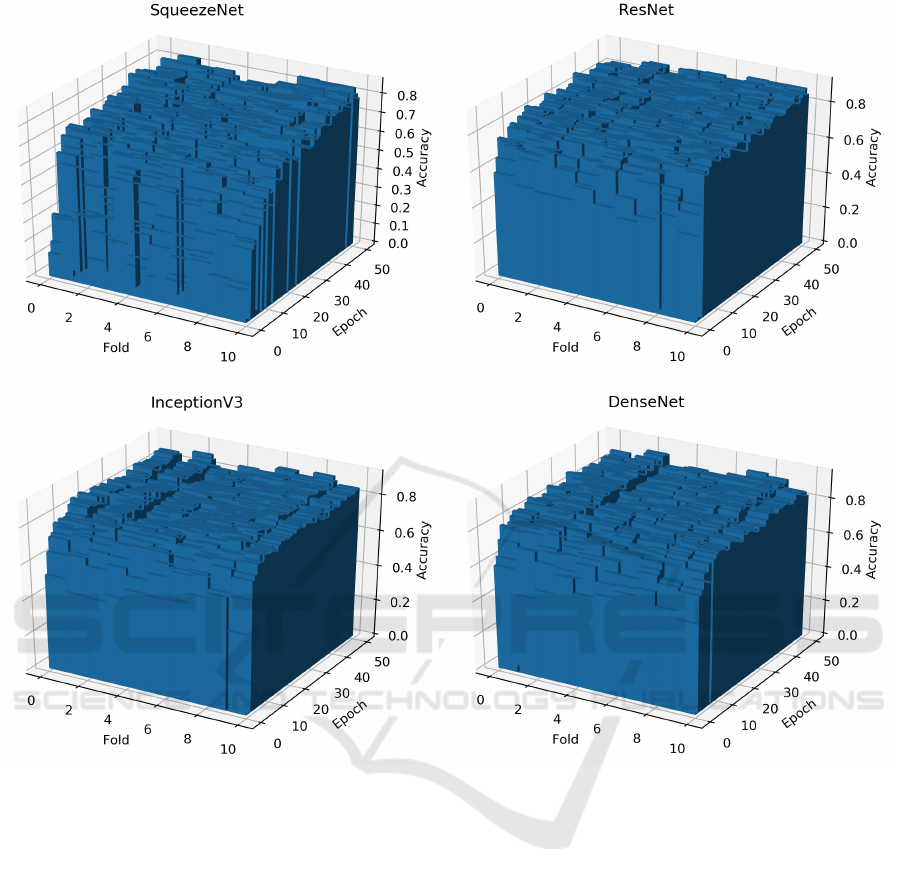
Figure 3: The bar plots of the accuracy over epochs and folds for each model.
dataset were resized accordingly. We also defined a
data augmentation scheme to be used on the training
set to enlarge the image dataset artificially. Data aug-
mentation enables us to properly train a network by
generating new samples of a given image under differ-
ent variations, thus helping to avoid overfitting (Saj-
jadi et al., 2016). For each training image, we per-
formed random rotations of one degree between -15
◦
and 15
◦
in each image of the training set.
In the training process, the optimization of the
weight parameters is done using Stochastic Gradi-
ent Descent (SGD) algorithm with a low learning
rate of 1e
−
3. As pointed in (Bengio, 2012), us-
ing SGD rather than adaptive learning rate optimizers
(i.e., Adam optimizer) prevents the magnitude of the
learning rate stays small and not wreck the previously
learned features. For the training process, we used the
cross-entropy loss function.
5 RESULTS AND DISCUSSION
Figure 3 shows the evolution of the accuracy on the
test set of each network model during its training. In
Table 2, we present the mean and the standard devi-
ation accuracy of the network models evaluated af-
ter 50 epochs training. For a given network model,
it is possible to notice that it exists a small varia-
tion of the accuracy among the folds. Even though
the network model presents a high average accuracy
and very small standard deviation, there are subsets
of images that are more difficult to test than others.
This is expected as the dataset used in the experiments
presents low intra-class similarity, as shown in Figure
2.
Even though this variation among folds is present,
the high accuracy indicates that the feature maps
learned by the network model are robust. As a re-
Variability Evaluation of CNNs using Cross-validation on Viruses Images
629
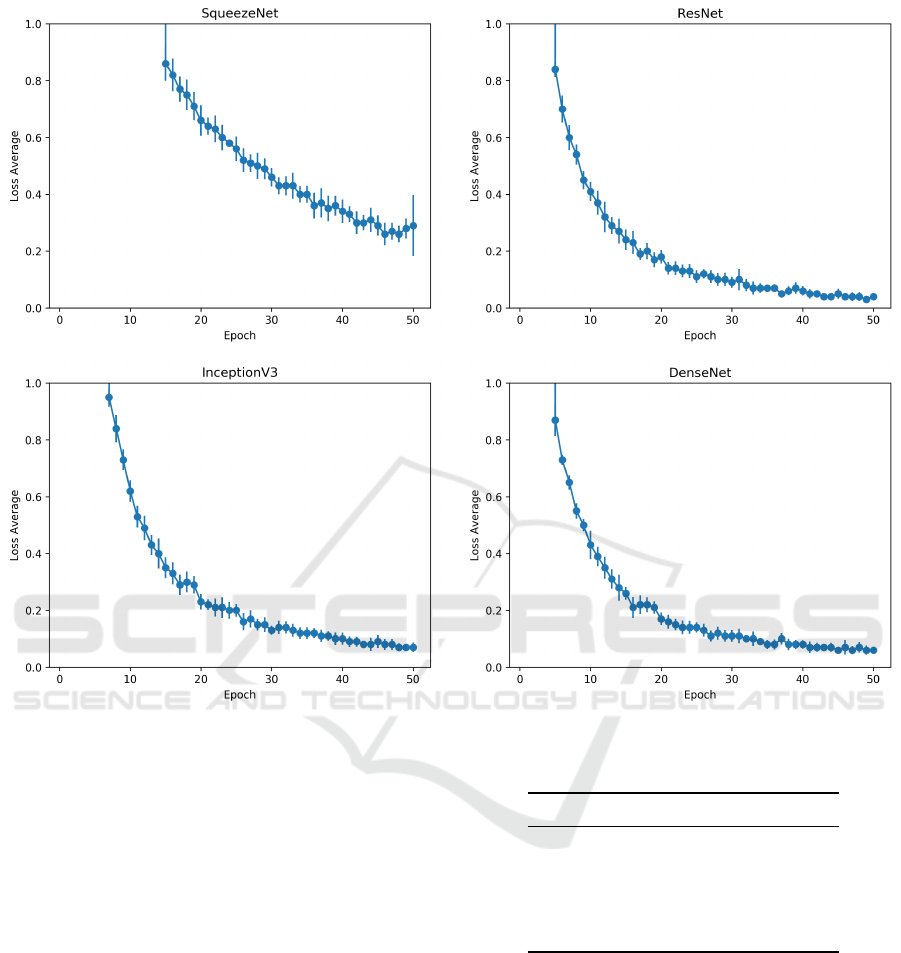
Figure 4: The plots of the loss average and standard deviation of the folds over epochs for each model.
sult, these features are capable of identifying the virus
class, although the many distortions present in the im-
ages (e.g., translation and occlusion of parts of the
virus), thus surpassing the low intra-class similarity
problem of the images.
Another essential point to take notice is the lower
accuracy presented by SqueezeNet in Table 2. This
CNN model showed the lowest accuracy, which is
0.0460 lower than InceptionV3 (0.872). To investi-
gate its poor performance, Figure 4 presents the evo-
lution of the loss function of each network model dur-
ing their training. After 50 epochs, we notice that
except for the SqueezeNet, all other CNN models
present a loss function close to zero and a very small
variation among folds.
According to Table 1, SqueezeNet is the CNN
model with the lowest amount of convolutional filters.
Although it seems counterintuitive, SqueezeNet de-
mands a larger number of epochs to train its reduced
model to achieve a result similar to deeper networks,
as shown in Figure 5. An explanation for such perfor-
Table 2: Average accuracy of the CNN models.
CNN model Epochs Accuracy
DenseNet 50 0.890±0.023
ResNet 50 0,886±0.020
InceptionV3 50 0.872±0.028
SqueezeNet 50 0.826±0.024
SqueezeNet 100 0.865±0.017
mance may lie in the structure of SqueezeNet, which
uses few pooling layers to achieve a big feature map.
Pooling layers help to reduce the dimensionality of
the image and the CNN sensitivity to image distor-
tions and shifting, problems that are present in the
virus dataset. When using 100 epochs to train this
model (Table 2), we are able to reduce its average loss
function. However, there is still a significant variance
among the folds. As a result, we are able to improve
its average accuracy from 0.826 to 0.865, but still, the
lowest accuracy value among all CNNs evaluated.
Finally, we compared our results with other works
VISAPP 2020 - 15th International Conference on Computer Vision Theory and Applications
630
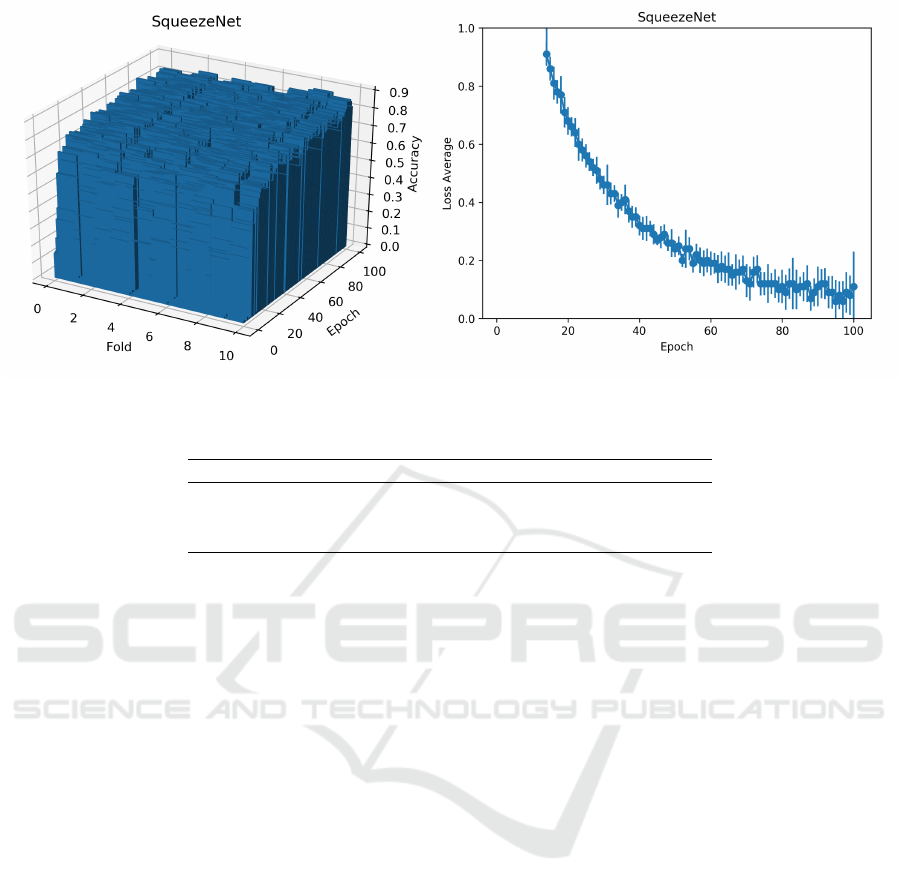
Figure 5: The plots of the loss average and standard deviation of the folds over epochs for SqueezeNet using 100 epochs.
Table 3: Comparison of mean accuracies of some texture analysis methods applied to the virus database.
Methods Mean accuracy
DenseNet 0.890±0.023
Highest accuracy in (dos Santos et al., 2015) 0.8570
Highest accuracy in (Wen et al., 2016) 0.862 ± 0.020
that addressed the same problem. Our best result
(obtained by DenseNet) is able to surpass the high-
est accuracies of two texture-based approaches, and
it presents an accuracy of 0.028 higher than the best
method compared (dos Santos et al., 2015). This re-
sult demonstrates the effectiveness of Deep Learning
methods in image problems that show high within-
class and low intra-class similarity.
6 CONCLUSIONS
In this paper, we addressed the problem of TEM
virus image classification using CNN models. We
evaluated four CNN models (InceptionV3, ResNet,
SqueezeNet, and DenseNet) pre-trained on the 2012
ImageNet image data set, and our goal was to cor-
rectly classify the 15 different types of viruses im-
ages in the dataset. We also evaluated the impact of
a cross-validation scheme on the classification accu-
racy, since the dataset does not define training and test
sets.
The results showed that the best accuracy is
achieved using the DenseNet CNN model, a result
that surpasses the success rates of two recent works
that addressed the same problem. Additionally, this
result is insensitive to the training set used during the
execution of the k-fold cross-validation scheme. Al-
though its accuracy is only slightly superior to Resnet,
DenseNet converges faster, and it presents compli-
ance of data on the test accuracy, thus indicating
DenseNet as a relevant CNN to be used to discrim-
inate virus images.
ACKNOWLEDGEMENTS
The authors would like to acknowledge the Federal
University of Uberl
ˆ
andia, FAPEMIG (Minas Gerais
Research Foundation) under Grant #APQ-03437-15,
CNPq (National Council for Scientific and Techno-
logical Development) under Grant #400699/2016-8,
#302416/2015-3 and #301715/2018-1, and PROPP-
UFU. This study was financed in part by the
Coordenac¸
˜
ao de Aperfeic¸oamento de Pessoal de
N
´
ıvel Superior - Brazil (CAPES) - Finance Code 001.
REFERENCES
Bengio, Y. (2012). Practical recommendations for gradient-
based training of deep architectures. Neural Net-
works: Tricks of the Trade. Lecture Notes in Computer
Science, vol 7700.
Biel, S. S. and Madeley, D. (2001). Diagnostic virology -
the need for electron microscopy: a discussion paper.
Journal of Clinical Virology, 22(1):1 – 9.
dos Santos, F. L. C., Paci, M., Nanni, L., Brahnam, S., and
Hyttinen, J. (2015). Computer vision for virus image
Variability Evaluation of CNNs using Cross-validation on Viruses Images
631

classification. Biosystems Engineering, 138:11 – 22.
Innovations in Medicine and Healthcare.
Ghidoni, S., Nanni, L., Brahnam, S., and Menegatti, E.
(2014). Texture descriptors based on Dijkstra’s al-
gorithm for medical image analysis. In Innovation
in Medicine and Healthcare 2014, Proceedings of the
second KES International Conference on Innovation
in Medicine and Healthcares, InMed 2014, 9-11 July
2014, San Sebastian, Spain, pages 74–82.
He, K., Zhang, X., Ren, S., and Sun, J. (2016). Deep resid-
ual learning for image recognition. In 2016 IEEE Con-
ference on Computer Vision and Pattern Recognition
(CVPR), pages 770–778.
Huang, G., Liu, Z., v. d. Maaten, L., and Weinberger, K. Q.
(2017). Densely connected convolutional networks. In
2017 IEEE Conference on Computer Vision and Pat-
tern Recognition (CVPR), pages 2261–2269.
Iandola, F. N., Han, S., Moskewicz, M. W., Ashraf, K.,
Dally, W. J., and Keutzer, K. (2016). Squeezenet:
Alexnet-level accuracy with 50x fewer parameters and
<0.5mb model size. arXiv:1602.07360.
Krizhevsky, A., Sutskever, I., and Hinton, G. E. (2012).
Imagenet classification with deep convolutional neu-
ral networks. In Proceedings of the 25th Interna-
tional Conference on Neural Information Processing
Systems - Volume 1, pages 1097–1105.
Kylberg, G., Uppstr
¨
om, M., Hedlund, K.-O., Borgefors, G.,
and Sintorn, I.-M. (2012). Segmentation of virus par-
ticle candidates in transmission electron microscopy
images. Journal of Microscopy, 245(2):140–147.
Kylberg, G., Uppstr
¨
om, M., and Sintorn, I.-M. (2011).
Virus texture analysis using local binary patterns and
radial density profiles. In San Martin, C. and Kim, S.-
W., editors, Progress in Pattern Recognition, Image
Analysis, Computer Vision, and Applications, pages
573–580, Berlin, Heidelberg. Springer Berlin Heidel-
berg.
Ponti, M. A., Ribeiro, L. S. F., Nazare, T. S., Bui, T.,
and Collomosse, J. (2017). Everything you wanted
to know about deep learning for computer vision but
were afraid to ask. In SIBGRAPI, pages 17–41.
Proenc¸a, M. C., Nunes, J. F., and de Matos, A. P. (2013).
Texture indicators for segmentation of polyomavirus
particles in transmission electron microscopy images.
Microscopy and Microanalysis, 19(5):1170–1182.
Sajjadi, M., Javanmardi, M., and Tasdizen, T. (2016). Reg-
ularization with stochastic transformations and per-
turbations for deep semi-supervised learning. In
Proceedings of the 30th International Conference on
Neural Information Processing Systems, pages 1171–
1179.
Szegedy, C., Vanhoucke, V., Ioffe, S., Shlens, J., and Wojna,
Z. (2016). Rethinking the inception architecture for
computer vision. In 2016 IEEE Conference on Com-
puter Vision and Pattern Recognition (CVPR), pages
2818–2826.
Wen, Z., Li, Z., Peng, Y., and Ying, S. (2016). Virus im-
age classification using multi-scale completed local
binary pattern features extracted from filtered images
by multi-scale principal component analysis. Pattern
Recognition Letters, 79:25 – 30.
Yosinski, J., Clune, J., Bengio, Y., and Lipson, H. (2014).
How transferable are features in deep neural net-
works? In Proceedings of the 27th International Con-
ference on Neural Information Processing Systems -
Volume 2, NIPS’14, pages 3320–3328, Cambridge,
MA, USA. MIT Press.
VISAPP 2020 - 15th International Conference on Computer Vision Theory and Applications
632
