
Stocks Prices Prediction with Long Short-term Memory
Zinnet Duygu Akşehir
1a
, Erdal Kılıç
1b
, Sedat Akleylek
1c
, Mesut Döngül
2d
and Burak Coşkun
2e
1
Department of Computer Engineering, Faculty of Engineering, Ondokuz Mayıs University, Samsun, Turkey
2
Rönesans Holding, Ankara, Turkey
Keywords: Prediction, Stocks Prices, Long Short-term Memory.
Abstract: It is a difficult problem to predict the one-day next closing price of stocks since there are many factors
affecting stock prices. In this study, by using data from November 29, 2010 to November 27, 2019 and stocks
for the closing price of the next day are predicted. The long short-term memory method, a type of recurrent
neural networks, is preferred to develop the prediction model. The set of input variables created for the
proposed model consists of stock price data, 29 technicals and four basic indicators. After the set of input
variables is created, the one-day next closing prices of AKBNK and GARAN stocks are developed the model
to predict. The model's prediction performance is evaluated with Root Mean Square Error(RMSE) metric.
This value is calculated as 0.482 and 0.242 for GARAN and AKBNK stocks respectively. According to the
results, the predictions realized with the set of input variables produced are sufficiently successful.
1 INTRODUCTION
While the predictability of stock returns is of great
importance for investors, it has become the most
researched and curious subject by researchers.
Determining stock prices is a very difficult problem.
This situation can be associated with high uncertainty
and mobility in prices. Moreover, many variables
such as political events, general economic situation,
movements in other stock exchanges and investors'
expectations affect price movements.
When the stock market and stock index
forecasting studies are surveyed, it is seen that
artificial intelligence and data mining techniques are
at the forefront. It is observed that artificial neural
network (ANN) methods are used more frequently
than other methods. In addition to these methods,
studies have shown that deep learning methods are
also used. Studies are usually in the direction of
estimating the value of the stock market index.
For example, Akel and Bayramoğlu using data
from 4 January 1999 to 28 February 2001 date,
a
https://orcid.org/0000-0002-6834-6847
b
https://orcid.org/0000-0003-1585-0991
c
https://orcid.org/0000-0001-7005-6489
d
https://orcid.org/0000-0002-2479-6475
e
https://orcid.org/0000-0001-7175-1109
estimated the IMKB 100 ındex by the ANN method.
Input variables of the network; USD / TL exchange
rate, ISE trading volume, central bank exchange
reserves, central bank one-month deposit interest rate,
and gold exchange are determined (Akel and
Bayramoğlu, 2008).
Karaatlı et al. used regression and artificial neural
network models to estimate the IMKB100 index
value. They used data from January 1960 to
December 2002 date and determined as the period of
analysis and the data were dealt with monthly. In the
study, input variables for forecasting models were
treasury bill rate, gold price, inflation rate, industrial
production index, savings deposit interest rate,
exchange rate, and time variables. When the models
were compared, the regression model has seen to be
more successful than the artificial neural network
model (Karaatlı et al., 2005).
Using data from 2 July 2001 to 13 July 2006 date,
Kutlu and Badur, who using different input variables
in their models, tried to estimate the IMKB 100 index
with the artificial neural networks approach. In the
study, the previous day's index, US dollar, overnight
Ak¸sehir, Z., Kılıç, E., Akleylek, S., Döngül, M. and Co¸skun, B.
Stocks Prices Prediction with Long Short-term Memory.
DOI: 10.5220/0009351602210226
In Proceedings of the 5th International Conference on Internet of Things, Big Data and Security (IoTBDS 2020), pages 221-226
ISBN: 978-989-758-426-8
Copyright
c
2020 by SCITEPRESS – Science and Technology Publications, Lda. All rights reserved
221

interest rate values, and the previous day's stock
market index values of France, Germany, UK,
S&P500, Brazil, and Japan were used as input
variables. Three different models were created using
these variables.
The first model, which was composed of the
previous day's index value, US dollar, and overnight
interest rate variables, produced more successful
results (Kutlu and Badur, 2009).
Diler attempted to predict the direction of the
IMKB 100 index the next day with the Ann method
in his study. Input variables of the model determine
as 10-day simple moving average, 5 and 10-day
weighted moving average, 10-day momentum, a
stochastic indicator (K%), relative strength index
(RSI), MACD (12 and 26-day exponential averages).
The success rate of the model calculated as 60.81%
(Diler, 2003).
Altay and Satman tried to estimate the IMKB 30
index with ANN and regression methods. They
tackled the data they used in the model on a daily and
monthly basis. When the models compared, it
appeared that the regression model is more successful
for both cases. It also stated that the ANN model
generally correctly predicted the direction of the
IMKB 30 index (Altay and Satman, 2005).
Sui et al. attempted to predict the direction of the
Shanghai stock market with support vector machines
(SVM). In the forecast model, they tried to estimate
the stock market direction of the day based on the
previous day's price. Alexander filter, relative
strength index, money flow index, Bollinger bands,
Chaikin oscillator, moving average
convergence/divergence, stochastic K%,
accumulation/distribution oscillator, and Williams’ R
technical indicators used as input variables in the
study. The prediction study with these technical
indicators achieved a 54.25% success rate (Sui et al.,
2007).
Inthachot et al. attempted to estimate the Thai
stock exchange index with ANN and SVM methods.
He used ten technical indicators for this forecast
model. When the performance of the two models
evaluated, it is seen that the model created by the
ANN method was more successful (Inthachot et al.,
2015).
Gündüz et al. attempted to estimate the daily
movement directions of three shares in Borsa Istanbul
with convolutional neural networks. In the model
they created, data between January 2011 and
December 2015 used. Two different sets of input
variables used for the model created. There are daily
opening, closing, highest and lowest values of stocks
in the first input variable set. In the second input
variable set, there are technical indicators calculated
from gold and dollar price data. When the second
dataset is added to the model created with the first
dataset, it was seen to improve the classification
performance of the model (Gündüz et al., 2017).
Parmar et al. attempted to predict the future value
of stocks of a company with regression and long short
term memory (LSTM) methods. The input variables
of the models consist of the open, close, low, high and
volume values of the stock. The input variables of the
models consist of approximately nine lakh records
consisting of the open, close, high, low, and volume
values of the stock. When the models compared, the
model created with the LSTM method was found to
be more successful than regression-based model
(Parmar et al., 2018).
Hossain et al. proposed a novel hybrid model
based on deep learning for stock forecasting. The
dataset used in the model consists of 66 years of
S&P500 index values (date, open, close and volume).
The proposed hybrid network has achieved 0.00098
MSE for this dataset (Hossain et al., 2018).
Pang et al. attempted to predict the Shanghai A-
Share Composite index and price of the Sinopec stock
via LSTM with embedded layer (ELSTM). This layer
used to reduce the data dimension. The created model
has achieved 0.017 MSE for Shanghai A-Share
Composite index while achieved 0.0019 MSE for
Sinopec stock (Pang et al., 2018).
Given the domestic and international stock market
index studies examined above, we found that stock
price data generally was chosen as the input dataset.
We have created a slightly different set of data from
these studies. This dataset we created; consists of
stock price data (including the opening price, the
highest price, the lowest price, the closing price and
the volume), 29 technical indicators calculated from
these price data, and 5 basic indicators. In this study,
we tried to estimate the closing price of two stocks
within the IMKB100 by using the LSTM method with
this data set we created.
The rest of this study is organized as follows: In
Section II, information about the dataset used in the
developed model is given. The LSTM method used in
the application is detailed in Section III. We describe
our experimental results in Section IV. The last
section consists of the conclusion and future works.
2 PREPARATION OF DATASET
This section provides information about how the
dataset created for the prediction model.
IoTBDS 2020 - 5th International Conference on Internet of Things, Big Data and Security
222
2.1 Feature Selection
Determining the attributes to be used in the prediction
model is one of the most important parts of the study.
As a result of the researches, stock price values, basic
and technical indicators were used to determine the
closing next day price of two stocks within the IMKB
100. The stock price data includes the open, close,
high, low, and volume values of these stocks. Also in
the input dataset, there are 29 technical indicators
calculated from these price data of the stock. In
addition to these attributes, there are also 5 basic
indicators: S&P 500, USD / TL parity, brent oil,
MSCI Turkey ETF, and BIST100 closing values. The
size of this dataset created as a matrix is 2265x39.
Technical analysis indicators use price and
transaction data to determine trends and analyze
formations. And with the help of some mathematical
calculations, he tries to express price movements by
a numerical value. Technical analysis indicators are
examined in 4 sub-headings: momentum, volume,
trend, and volatility indicators (Çetinyokuş, 2002). In
this study, the technical indicators to be used in the
model were determined as follows: 4 volume
(Chaikin Money Flow, On Balance Volume, etc.), 7
volatility (Average True Range, Bollinger Band,
Kelter Channel Central, etc.), 6 momentum (Relative
Strength Index, Stochastic Oscillator, Money Flow
Index, etc.), and 12 trend (Mass Index, Aroon
Indicator, Commodity Channel Index, Exponential
Moving Average, etc.) indicators.
2.2 Creation of the Dataset
The stock price data used in the study obtain from
Borsa Istanbul. The values of basic indicators obtain
from the stooq.com website.
3 METHODOLOGY
A Recurrent Neural Network (RNN) is a type of
neural network whose inputs are sequences of data
ranges from text, image to time series. RNN
architectures provide successful results in time-based
problems due to their ability to connect with the past
and interpret. But in the case of establishing a
connection with the distant past, it's hard to keep that
much information in its memory and use it (Elman,
1990). As a solution to this memory problem of RNN
and the 'vanishing gradient problem,' Hochreiter and
Schmidhuber proposed the Long Short Term Memory
(LSTM) units in 1997 (
Hochreiter and Schmidhuber,
1997). LSTM is a variant of RNNs and can learn long-
term dependencies. In this way, it produces new
outputs based on what it has learned in the past.
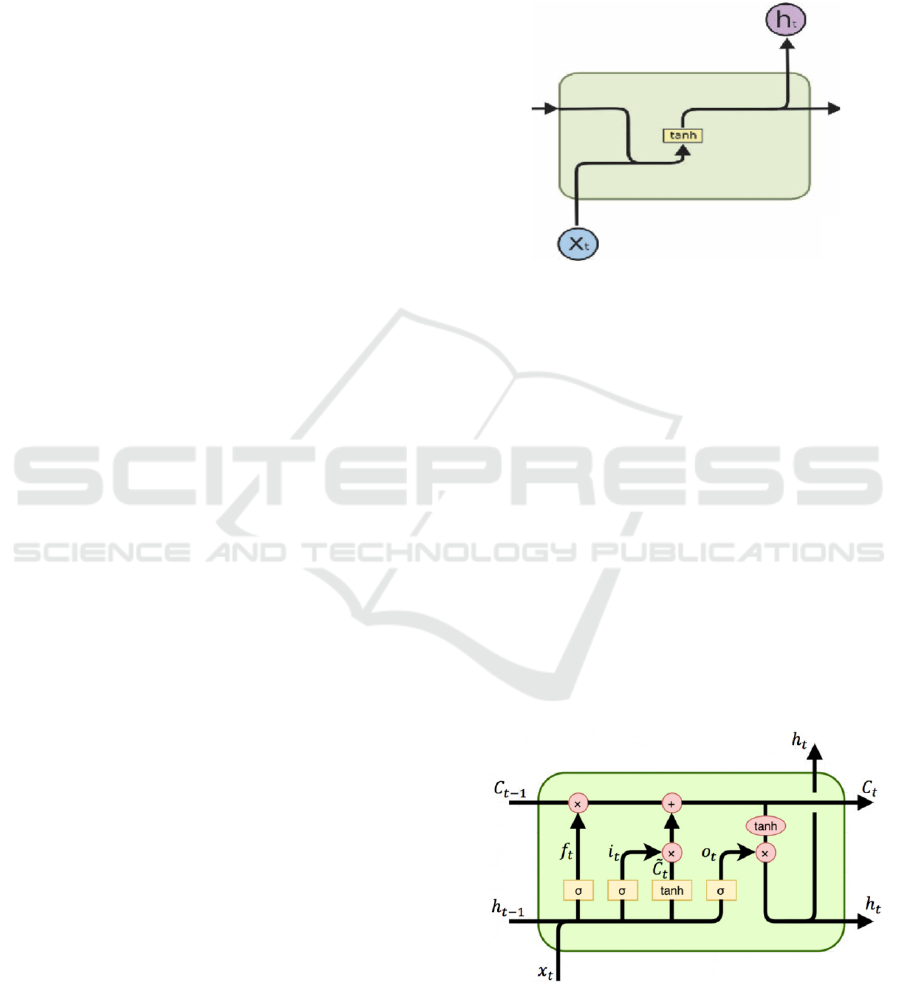
While traditional RNNs have a single tangent
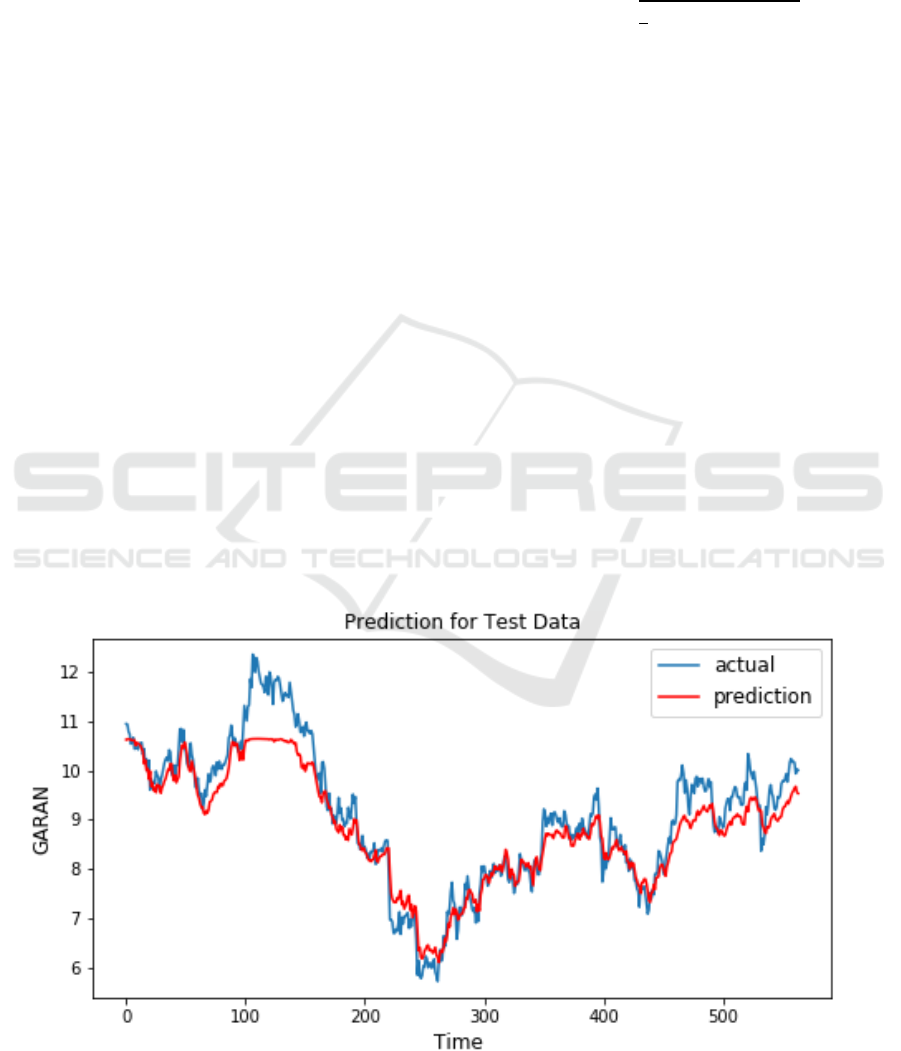
layer (see Fig. 1), the LSTM has four different layers:
input gate, output gate, forget gate, and the memory
cell.
Figure 1: The traditional RNN unit.
The LSTM transaction equations are given as fallow
(Hochreiter and Schmidhuber, 1997):
=
.
ℎ
,
+
(1)
=
(
.
ℎ
,
+
)
(2)
=(
.
ℎ
,
+
) (3)
Č
=tanh
(
.
ℎ
,
+
)
(4)
=
⊙
+
⊙Č
(5)
ℎ
=
⊙tanh
(
)
(6)
From the above equations, for an input vector () the LSTM
unit at time step :
is an input gate,
is a forget gate,
is an output gate,
is a memory cell, ℎ
is hidden state,
is weight matris, is bias vector, and activation
function. The default conections among these units are
presented Figure 2.
Figure 2: LSTM unit.
Stocks Prices Prediction with Long Short-term Memory
223
4 EXPERIMENTAL RESULTS
With the LSTM model we created within the scope of
the study, we evaluated closing price of AKBNK and
GARAN stocks of the next day. In this study, we
determined the analysis period from November 29,
2010 - November 27, 2019, and we handled the data
daily.
We used the AKBNK and GARAN stocks price
data (open, high, low, and close), 29 technicals, and 5
basic indicators as the input variable of the model we
developed.
The details of the model we developed are as
follows:
For the training set, we take the first 75% of
the data, and for testing, we chose the rest of
the data.
Input data segmentation is made by 9 width
sliding window. That is, each input variable
having 9 days of observation.
Our model consists of five LSTM layers and
one dense layer. The output sizes of the
LSTM layers are 256, 128, 64, 32, and 16,
respectively.
We added a dropout layer between the
LSTM layers to prevent the model from
over-fitting.
The activation function of the LSTM layers
is 'hard sigmoid' while the activation
function of the dense layer is 'hyperbolic
tangent'.
We've set the number of epochs to 150, the
batch size is 32.
We also benefited from the Root Mean Square
Error (RMSE) metric indicated with (7) when
evaluating the performance of the model.
=
∑
(
−
)
(7)
In the above equation, shows the number of
data, is predicted value, and is actual value.
According to this metric, the RMSE value's close to
zero shows that the created prediction model is
successful.
After all these model parameters were set, we
went through to the training stage of the model. After
the training of the model was completed, we
performed the prediction on the test data. The graphs
of the actual closing prices of GARAN and AKBNK
stocks and the values predict during the test is given
in Figure 3 and Figure 4 respectively.
Graphics shown in blue in Figure 3 and Figure 4
shows the actual closing price, while the graph in red
indicates the predicted values.
When the figures are examined, the two curves
generally overlap. However, successful forecasts
could not be produced in cases where the stock price
dipped or peaked.
Also, the RMSE values of the model created for
GARAN and AKBNK stocks calculated as 0.282 and
0.482 respectively. These values indicates that the
created prediction model is successful.
Figure 3: GARAN stock prediction and actual closing price during the test.
IoTBDS 2020 - 5th International Conference on Internet of Things, Big Data and Security
224
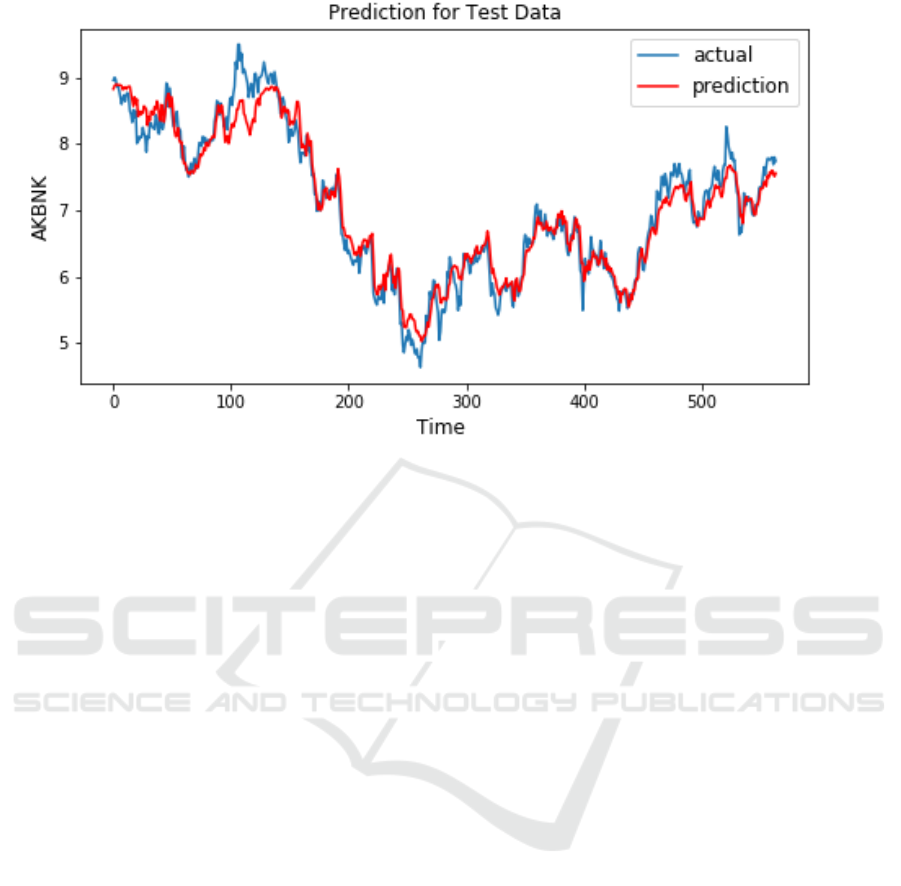
Figure 4: AKBNK stock prediction and actual closing price during the test.
5 CONCLUSIONS AND FUTURE
WORK
When we examined the results, we found that the
LSTM model, created with the selected basic and
technical indicators, realized successful predictions.
Also, we found that the price direction correctly
predicted even though the price value could not be
predicted correctly when the stock price reached the
bottom and peak.
We have identified future studies as make
improvements for these situations where the stock
price is not closely predicted.
ACKNOWLEDGEMENTS
This work was supported by Rönesans Holding.
REFERENCES
Akel, V., Bayramoğlu, M. F., 2008. Kriz Dönemlerinde
Yapay Sinir Ağları ile Finansal Öngörüde bulunma:
İMKB 100 Endeksi Örneği. International Symposium
on International Capital Flows and Emerging Markets,
pp. 24-28.
Altay, E., Satman, M. H., 2005. Stock Market Forecasting:
Artificial Neural Network and Linear Regression
Comparison in An Emerging Market. Journal of
Financial Management and Analysis, 18(2), pp. 18-33.
Çetinyokuş, T., Gökçen, H., 2002. Borsada Göstergelerle
Teknik Analiz için Bir Karar Destek Sistemi. Gazi
Üniversitesi Mühendislik-Mimarlık Fakültesi Dergisi,
17(1).
Diler, A. İ., 2003. İMKB Ulusal-100 Endeksinin Yönünün
Yapay Sinir Ağları Hatayı Geriye Yayma Yöntemi ile
Tahmin Edilmesi. İMKB Dergisi, 7(25- 26), pp. 66-82.
Elman, J. L., 1990. Finding structure in time. Cognitive
science, 14(2), pp. 179-211.
Gunduz, H., Cataltepe, Z., Yaslan, Y., 2017. Stock Market
Direction Prediction Using Deep Neural Networks.
In 2017 25th Signal Processing and Communications
Applications Conference (SIU), pp. 1-4. IEEE.
Hochreiter, S., Schmidhuber, J., 1997. Long Short-Term
Memory. Neural computation, 9(8), pp. 1735-1780.
Hossain, M. A., Karim, R., Thulasiram, R., Bruce, N. D.,
Wang, Y., 2018. Hybrid Deep Learning Model for
Stock Price Prediction. In 2018 IEEE Symposium
Series on Computational Intelligence (SSCI), (pp.
1837-1844. IEEE.
Inthachot, M., Boonjing, V., Intakosum, S, 2015. Predicting
SET50 Index Trend Using Artificial Neural Network
and Support Vector Machine. In International
Conference on Industrial, Engineering and Other
Applications of Applied Intelligent Systems, pp. 404-
414. Springer.
Karaatlı, M., Güngör, İ., Demir, Y., Kalaycı, Ş., 2005. Hisse
Senedi Fiyat Hareketlerinin Yapay Sinir Ağları
Yöntemi ile Tahmin Edilmesi. Yönetim ve Ekonomi
Araştırmaları Dergisi, 3(3), pp. 38-48.
Kutlu, B., Badur, B., 2009. Yapay Sinir Ağları ile Borsa
Endeksi Tahmini. Yönetim, 20(63), pp. 25-40.
Pang, X., Zhou, Y., Wang, P., Lin, W., Chang, V., 2018.
Stock Market Prediction based on Deep Long Short
Term Memory Neural Network. In Proceedings of the
Stocks Prices Prediction with Long Short-term Memory
225

3rd International Conference on Complexity, Future
Information Systems and Risk (COMPLEXIS 2018), pp.
102-108.
Parmar, I., Agarwal, N., Saxena, S., Arora, R., Gupta, S.,
Dhiman, H., Chouhan, L., 2018. Stock Market
Prediction Using Machine Learning. In 2018 First
International Conference on Secure Cyber Computing
and Communication (ICSCCC), pp. 574-576. IEEE.
Sui, X., Hu, Q., Yu, D., Xie, Z., Qi, Z. A., 2007. Hybrid
Method for Forecasting Stock Market Trend Using
Soft-Thresholding De-noise Model and SVM. Springer
Verlag Berlin Heidelberg, pp. 387-394.
IoTBDS 2020 - 5th International Conference on Internet of Things, Big Data and Security
226
