
Framework of Software Design Patterns for Energy-Aware Embedded
Systems
Marco Schaarschmidt
1 a
, Michael Uelschen
1 b
, Elke Pulverm
¨
uller
2
and Clemens Westerkamp
1
1
Faculty of Engineering and Computer Science, University of Applied Sciences Osnabr
¨
uck, Germany
2
Software Engineering Research Group, University of Osnabr
¨
uck, Germany
Keywords:
Embedded Software Engineering, Embedded Systems, Software Design Pattern, Energy Efficiency, Power
Consumption, Internet of Things.
Abstract:
With the increasing size and complexity of embedded systems, the impact of software on energy consumption
is becoming more important. Previous research focused mainly on energy optimization at the hardware level.
However, little research has been carried out regarding energy optimization at the software design level. This
paper focuses on the software design level and addresses the gap between software and hardware design for
embedded systems. This is achieved by proposing a framework for software design patterns, which takes
aspects of power consumption and time behavior of the hardware level into account. We evaluate the expres-
siveness of the framework by applying it to well-known and novel design patterns. Furthermore, we introduce
a dimensionless numerical efficiency factor to make possible energy savings quantifiable.
1 INTRODUCTION
Due to advances in high-performance hardware and
new fields of applications, such as Internet of Things
(IoT) and Industrial Internet of Things (IIoT), the im-
portance of embedded systems is increasing. An em-
bedded system consists of a combination of hardware
and software components that interact with the sur-
rounding environment to achieve a specific task. Re-
quirements such as the access to energy resources,
power consumption and real-time behavior are be-
coming more important. At the same time, the com-
plexity of tasks accomplished by embedded systems
is constantly increasing, which results in a more pow-
erful and complex software. The program control
flow and algorithms as well as the used hardware
components have a direct influence on the energy
efficiency of the system as one of the most critical
Non-Functional Requirements (NFR). For a battery-
operated system, the energy consumption is a chal-
lenging problem and often the bottleneck of a sys-
tem (Banerjee et al., 2016). Developers often have
a good understanding of the software application and
the hardware platform. However, when it comes to
power consumption and energy efficiency, they have
a
https://orcid.org/0000-0001-8260-5326
b
https://orcid.org/0000-0002-0841-6954
mostly limited knowledge and are often unsure of
how an application consumes energy and unaware of
best practices that reduce power consumption caused
by the application (Pang et al., 2016). Develop-
ing energy-efficient software encompasses many parts
of software development. This includes not only
the optimized use of programming languages and
object-oriented programming (e.g. inheritance, poly-
morphism) but also the interaction between software
modules and hardware components (e.g. processor,
sensors). Significant energy savings can be achieved
during the software design and architecture phase
(Tan et al., 2003). The authors also mentioned that it
is easier and less expensive to optimize the software
design of an embedded system in early stages rather
than trying to optimize the final application. In the
context of software development, software patterns
are solutions for recurring problems and can be used
to overcome the complexity of applications. How-
ever, to the best of our knowledge, there is only lim-
ited work towards design patterns, which directly de-
scribe the effect on power consumption of a system.
To address the gap between the definition of software
design patterns and Energy-Aware hardware designs,
the following contributions are presented in this pa-
per:
• With respect to energy efficiency as a NFR, we
are addressing the gap between software and hard-
62
Schaarschmidt, M., Uelschen, M., Pulvermüller, E. and Westerkamp, C.
Framework of Software Design Patterns for Energy-Aware Embedded Systems.
DOI: 10.5220/0009351000620073
In Proceedings of the 15th International Conference on Evaluation of Novel Approaches to Software Engineering (ENASE 2020), pages 62-73
ISBN: 978-989-758-421-3
Copyright
c
2020 by SCITEPRESS – Science and Technology Publications, Lda. All rights reserved

ware design by including power consumption and
timing behavior aspects of the underlying hard-
ware layer in the definition of software design pat-
terns.
• We describe a framework for Energy-Aware soft-
ware design patterns based on a proposal in (Ar-
moush, 2010).
• As part of the framework, we define the energy
balance EB
P
and the efficiency factor η
P
for each
Pattern P. EB
P
represents the difference between
the ability to save energy and additional energy
consumption. η
P
describes a quantitative estima-
tion of the efficiency of energy savings.
• To demonstrate the expressiveness of the frame-
work, we provide a catalog of Energy-Aware de-
sign patterns. These are enhanced by a uniform
description of temporal power consumption and
computing power characteristics, which helps de-
velopers to improve the energy efficiency of ap-
plications.
The remainder of this paper is organized as follows:
Section 2 describes research related to our approach.
An overview of power consumption analysis with a
power model description and software addressable
factors are presented in section 3. Section 4 contains
our proposed notation framework. Section 5 applies
our framework by presenting four Energy-Aware de-
sign patterns. A conclusion is provided in section 6.
2 RELATED WORK
Design patterns are a popular technique to document
proven best practices for recurring problems. The
work of (Gamma et al., 1994) (also known as Gang
of Four (GoF)) has become a widely accepted guid-
ance and includes common best practices for object-
oriented software development. The authors describe
pattern solutions for different types of problems in-
cluding structural and behavioral problems. Further-
more, the proposed representation includes fields ad-
dressing the context, structure and implementation.
The main drawback in common representation e.g.
(Douglass, 2011) is the lack of fields for NFRs, such
as energy efficiency or time behavior. (Armoush,
2010) extended those representations to consider the
NFRs in the pattern description. Their approach fo-
cuses strongly on aspects of safety-critical applica-
tions. Even if both hardware and software have to
fulfill NFRs, design patterns are strictly divided into
software- and hardware-based patterns. In case of en-
ergy efficiency, such a separation cannot be sustained
due to the close relationship between software and
hardware on this NFR. While this paper focuses on
Energy-Aware design patterns, other NFRs, like the
timing behavior of energy-efficient applications, have
also been studied (Iyenghar and Pulvermueller, 2018).
Several authors consider the challenge of ana-
lyzing and improving energy efficiency in the pro-
cess of software development and for design pat-
terns. In (Litke et al., 2007) the authors explore
the power consumption and performance before and
after design patterns, such as Factory Method, Ob-
server or Adapter, are applied to an embedded sys-
tem. Other studies investigate the impact of design
patterns and object-oriented programming on energy
consumption. (Maleki et al., 2017) compare the im-
pact on power consumption for GoF design patterns.
(Feitosa et al., 2017) propose alternative pattern so-
lutions for GoF design patterns with a lower energy
consumption. (Noureddine and Rajan, 2015) improve
energy efficiency by optimizing design patterns auto-
matically at compile time. The described approaches
perform optimizations at the source code level and
on specific aspects of programming languages (e.g.
memory management, compiler optimization).
As shown in (Abdulsalam et al., 2014), changing
the programming languages and compiler settings can
heavily influence the performance as well as the en-
ergy efficiency of the software. Furthermore, (Bunse
and H
¨
opfner, 2008) mentioned, that an optimization
during compile time is often inefficient because an
optimal use of existing resources cannot really be pre-
dicted. This is especially the case for embedded sys-
tems in the IoT domain since the software is often
event-based and the behavior of the system depends
strongly on the environment in which the system is
employed. Additionally, all the optimizations regard-
ing programming languages and compilers are target-
ing the efficiency of the used processor. Since the
processor of an IoT device is not the main energy con-
sumer (Urard and Vu
ˇ
cini
´
c, 2017), a more general ap-
proach is required. In (Reinfurt et al., 2017a; Reinfurt
et al., 2017b), a pattern framework as well as differ-
ent patterns for IoT devices on a more abstract level
were proposed. By postulating patterns which address
energy supply and energy harvesting approaches, the
authors took conditions of the environment and en-
ergy efficiency into account. The work is aimed at
complete IoT ecosystems (e.g. server systems and in-
frastructure) and only slightly addresses the behavior
of individual IoT nodes. However, to the best of our
knowledge, there is no approach that takes the close
connection between the software and hardware layer
for the definition of software design patterns into ac-
count.
Framework of Software Design Patterns for Energy-Aware Embedded Systems
63

3 POWER CONSUMPTION
This chapter contains a definition of energy consump-
tion and power models for embedded systems. It
also describes the influence of an application on the
power consumption P. Energy efficiency analysis and
esp. power consumption optimizations are challeng-
ing tasks. (Patterson and Hennessy, 2014) define a so-
called Power Wall for processors describing the cor-
relation between clock rate and the consumed power
Until the year 2004, both power consumption and
clock rate of devices have increased significantly and
stagnated since. A practical power limit was reached
making a further reduction of power loss nearly im-
possible. The development of multi-core processors
was the next logical step. Consequently, the software
design became more dynamic and flexible, but also
more complex and more difficult to optimize. Fur-
thermore, energy efficiency cannot be analyzed in iso-
lation, because of its impact on other requirements of
the system. Modern embedded systems tend to have a
high complexity along with an increasing number of
different components like sensors and radio modules.
The total power consumption E
tot
of a system for a
given interval [0, T] is defined as:
E
tot
=
T
Z
0
P(t) dt (1)
To consider all components of a system, E
tot
in eq. 1
may be divided into two categories. One category en-
compasses complex components of a system, while
the other category encompasses simple components
of a system.
E
tot
=
T
Z
0
n
∑
i=1
P
i
dyn
(t) + P
i
stat
(t)
| {z }
complex
+
m
∑
j=1
V
j
(t) · I
j
(t)
| {z }
simple
!
dt
(2)
The first part of eq. 2 defines the power consumption
for complex and clock-driven components with a dy-
namic part P
dyn
and a static part P
stat
. The second
part of eq. 2 addresses simple components which are
only manageable over the voltage V and electric cur-
rent I. The number of complex components is defined
by n and the number of simple components by m re-
spectively. From a system point of view, a component
can be either defined as a part of the System-on-a-
Chip (SoC) (e.g. analog-to-digital converter) or an
integrated part of the system (e.g. sensor, radio mod-
ule). In both cases, the application can be primar-
ily responsible for changes in the energy profile of
the system and perform differently depending on the
combination of system components. Energy models
for complex and simple components are explained in
the following. Components (e.g. voltage regulators),
which are not directly affected by the application, are
not part of this paper.
3.1 Complex Components
The power P for complex components can be divided
in a static part P
stat
and dynamic part P
dyn
. P
stat
is typ-
ically described as the leakage current of transistors
(Kim et al., 2003). Since this is a typical behavior of
hardware components, from an application perspec-
tive, this can only be addressed by turning off func-
tion blocks of the component itself (known as Power
Gating). P
dyn
can be expressed as (Patterson and Hen-
nessy, 2014):
P
dyn
= nCV
2
f (3)
where n represents the number of transistors of a
given component, C the capacitance of a single tran-
sistor, V the supply voltage for the component and
f is the operating frequency. This energy model can
be used for processors or complex sensors with their
own CMOS logic. From an application perspective,
P
dyn
may be influenced by several parameters, which
is further explained in section 3.3.
3.2 Simple Components
The energy model for simple components used in
eq. 2 can be defined as:
E =
T
Z
0
V (t) · I(t) dt (4)
The time t, current I and voltage V as the main parts
of eq. 4 can be affected by the design of an appli-
cation and the algorithms running on an embedded
device. This model is used for simple components
which are not based on CMOS technology and are not
using clock generators. Examples are simple sensors
(e.g. photoresistor, temperature sensor) or infrared
and light diodes. From the application’s perspective,
the active time can be reduced by completing oper-
ations as efficiently and as fast as possible. The cur-
rent I can be reduced theoretically but may not always
be manageable by the application in practice. Further-
more, it is possible to optimize the program control
flow, so that peripheral components are used less fre-
quently or switched off after being accessed.
3.3 Software Addressable Factors
This chapter addresses the gap between the hardware
and software design level, by including power con-
ENASE 2020 - 15th International Conference on Evaluation of Novel Approaches to Software Engineering
64
sumption and timing behavior aspects of the hard-
ware layer in the description of Energy-Aware soft-
ware design patterns. Eq. (2) describes the behavior
on a physical, hardware-related level, which causes
power consumption. The application can influence
the parameters presented below and therefore actively
reduce the consumption of a hardware system.
i) Time (t): Reduce the total time a system is running
by minimizing the workload, e.g., by using ef-
fective algorithms or optimizing the control flow.
For some of those methods, hardware support is
needed (e.g. operation modes of the processor,
especially sleep modes).
ii) Capacity (n · C): Enable and disable components
and functional units when they are not actively
used. A policy for disabling and enabling com-
ponents may either be statically implemented be-
fore compilation or dynamically influenced dur-
ing runtime. This parameter also affects the static
power P
stat
from eq. (2).
iii) Voltage (V ): Increasing or decreasing the power
of the system or single components. This usually
requires support from the underlying hardware.
Another possibility is to turn off the power from
separated parts of the system. Depending on the
hardware layer, software developers do not always
have any control over those features (Oshana and
Kraeling, 2013).
iv) Frequency ( f ): Changing the operation frequency
of components (e.g. processor, sensors). This also
requires support from the hardware layer.
Well-known techniques like Dynamic Voltage Scal-
ing (DVS) (Lim et al., 2007), Dynamic Frequency
Scaling (DFS) (Pering et al., 1998) or Dynamic Volt-
age Frequency Scaling (DVFS) control voltage V and
frequency f to reduce consumption without turning
off the component. Such techniques are not or only
partially supported by typical low-costs and low-end
processors, like the ARM Cortex M family, which
are often used in battery-powered IoT devices. Such
hardware-based techniques cannot or only partially be
accessed from an application context. Even when pat-
terns can address energy-related problems by manag-
ing hardware accesses or using monitoring strategies,
they may cause additional overhead, e.g. power con-
sumption or execution time. This overhead also in-
creases the overall power consumption of the system
and therefore there exists a trade-off between the en-
ergy savings provided by the pattern and the energy
overhead of using the pattern. A detailed description
of the impact on energy consumption for each tem-
plate is part of the notation proposed in section 4.
4 NOTATION FRAMEWORK
This section describes our approach to create a frame-
work for a consistent documentation of software de-
sign patterns with an impact on energy efficiency.
Energy-aware Software Design Pattern Framework
Description
General
Information
Pattern Name
Other Names
Context
Preconditions
Realization
Strategy
Related Pattern
Impact on Non-
Functional Requirements
Energy Consumption
Execution Time/Latency
Modifiability
Development Costs
Problem
Abstract
Consequences (Optional)
Known Uses
Figure 1: Energy-Aware Design Pattern Framework.
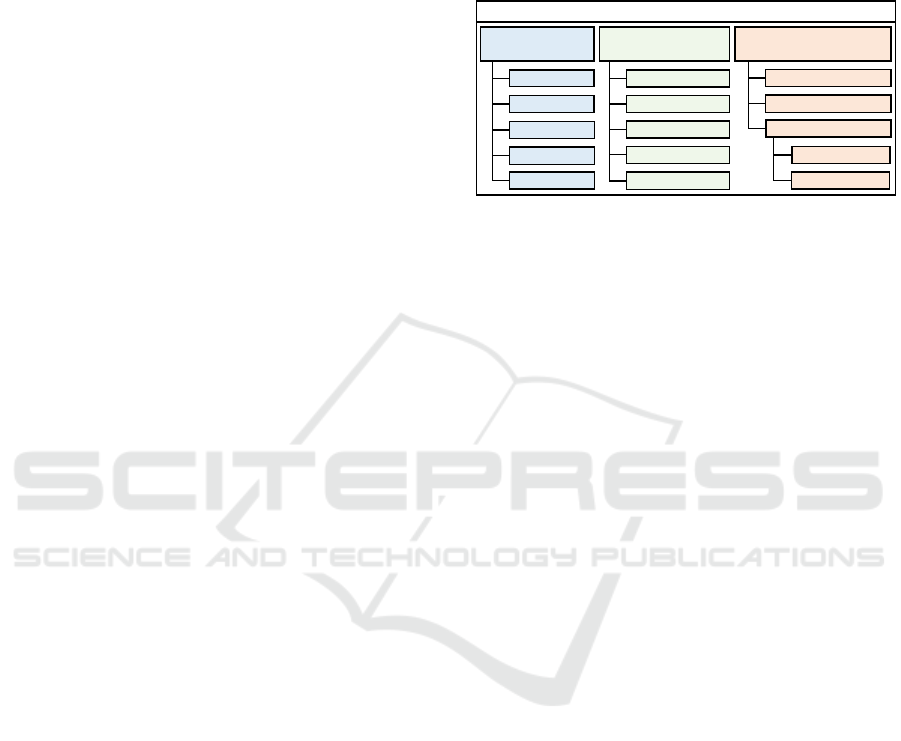
The overall structure of this framework is shown in
figure 1. This approach is derived from the basic con-
cept described in (Armoush, 2010) and enhanced by
taking energy efficiency into account. Both solutions
consider the Execution Time as another closely related
NFR which also includes the impact on real-time re-
quirements. The template in figure 1 is divided into
three main parts: General Information, Description
and Impact on Non-Functional Requirements.
4.1 General Information
This part of the framework describes all meta infor-
mation, including the following elements:
• Pattern Name: A unique and meaningful name
that identifies the pattern.
• Other Names: If exists, other well-known names
of the pattern or names of similar patterns realiz-
ing the basic concept.
• Strategy: Each pattern can address at least one of
the four main factors Time, Capacity, Voltage and
Frequency, proposed in the previous section 3.3.
• Related Patterns: If available, names of other pat-
terns, which are related to this pattern.
• Known Uses: A description of known uses in-
cluding other domains (e.g. electrical engineer-
ing) and existing products using the concept of
this pattern successfully.
4.2 Description
This section of a template contains the definition as
well as information of the basic pattern idea. The pre-
sented structure is based on the GoF pattern descrip-
tion (Gamma et al., 1994) and contains the following
elements:
Framework of Software Design Patterns for Energy-Aware Embedded Systems
65

• Abstract: A short description of the pattern to pro-
vide a first overview.
• Context: Description of the situation to which this
pattern may be applied.
• Preconditions: Conditions that must be fulfilled in
order to apply this pattern. Conditions include re-
quirements and properties of the underlying hard-
ware system architecture.
• Problem: Description of the addressed problem
expressed as a question to describe the character-
istics of the specific problem.
• Realization: A detailed description of the pattern
including a graphical structure representation (if
applicable) as well as an overview of the individ-
ual elements and relations. A description of the
implementation and techniques while implement-
ing the design pattern can be included.
In typical software pattern descriptions (cf. section 2),
Unified Modeling Language (UML) diagrams like
structure, class and object diagrams are often used as
graphical representations. Depending on the type of
pattern (cf. section 3.3), some other UML represen-
tations like timing, activity and sequence diagrams as
well as statecharts may be used to define aspects of
the implementation.
4.3 Impact on NFR
This section describes the impact on NFRs like power
consumption as well as the impact on other energy-
related NFRs like execution time and latency. Ad-
ditionally, other consequences that are not energy-
related (e.g. development costs, modifiability) can
also be mentioned in this section.
• Power Consumption: For a unified description of
the impact on power consumption, we introduce
the energy balance EB
P
. A higher value of EB
P
means greater possible savings. Furthermore, we
define the efficiency factor η
P
to enable a quanti-
tative evaluation of the efficiency of energy sav-
ings (effort-saving ratio). η
P
= 1 means a pattern
saves energy without additional effort. A pattern
that does save energy results in η
P
= 0.
• Execution Time/Latency: Describes the impact of
a pattern on the execution time. In addition, laten-
cies caused by the pattern can be listed.
• Consequences: Drawbacks and side-effects with a
focus on the behavior and control flow of the soft-
ware and system are considered. Also required
adaptations by the software developer as well as
additional hardware requirements are mentioned.
5 PATTERN CATALOG
In this section, we demonstrate our approach on four
selected Energy-Aware design patterns. Section 5.1–
5.3 describe well-known design patterns, while sec-
tion 5.4 presents a novel design pattern. Each descrip-
tion includes a power-timing diagram showing the be-
havior of the pattern related to the power consump-
tion, computation power and execution time. Based
on this diagram, the patterns are evaluated with the
proposed efficiency factor η
P
.
5.1 Pattern: Energy-Aware Sampling
In this section, the Energy-Aware Sampling (EAS)
pattern is described.
5.1.1 General Information
Other Names: Adaptive Sampling (Shu et al., 2017).
Strategy: This pattern influences the time an embed-
ded system (e.g. processor and sensor) is operating
in an active state. By lowering the sampling rate, the
component (e.g. sensor) can be set inactive for longer
periods and the processor can go into a (deep) sleep
mode. Increasing the sampling rate increases the
power consumption of the component due to a longer
active period. Depending on the strategy, a processor
can be in a low power or active state during sampling
of the component.
Related Pattern: Cost-Aware Sampling, where
the sampling rate is adapted according to energy
consumption, memory size and communication
bandwidth. Quality of Service Based Sampling
where the performance of the transmission network
affects the sampling rate. (Mi
´
skowicz, 2016)
Known Uses: In (Shu et al., 2017), a dynamically
adapting sampling frequency is used to save 30.66%
of the system’s battery energy during a three months
monitoring period.
5.1.2 Description
Abstract: According to (Tobola et al., 2015), the
sample rate of a system has a large impact on the
power consumption of the system. As the main
problem, this pattern addresses the acquisition of
sensor data in an Energy-Aware way by using a
sampling rate, which fits the relevant frequencies
to extract all the necessary information. Following
the Nyquist-Shannon sampling theorem (Landau,
1967), the signal can be reconstructed perfectly, if the
ENASE 2020 - 15th International Conference on Evaluation of Novel Approaches to Software Engineering
66
maximum frequency f
max
is known and the sampling
rate results in f
sample
> 2 · f
max
. This represents the
lowest limit for the reduction of the sampling rate.
Context: Use EAS in situations where signal prop-
erties are known (e.g. maximum frequencies) and
algorithms can handle varying sample rates.
Preconditions: This pattern is highly suitable for
periodic systems (e.g. constant sampling rates)
without interrupts. At least one component, typically
a sensor with capabilities to adjust the sampling rate,
is required. In addition, when using this pattern, the
characteristics of the signal must be well known.
Problem: How can a system optimize the overall
energy consumption by adopting the sample rate of
single components (e.g. sensors) individually?
Realization: The pattern interferes only slightly with
the existing application and can be implemented
rapidly. The first step is to change the period dura-
tion for the sensor reading. In the case of a static ad-
justment, this ideally takes place when the program is
executed the first time. If the sampling interval is sup-
posed to vary during run-time, further software com-
ponents may need to be adapted.
5.1.3 Impact on Non-Functional Requirements
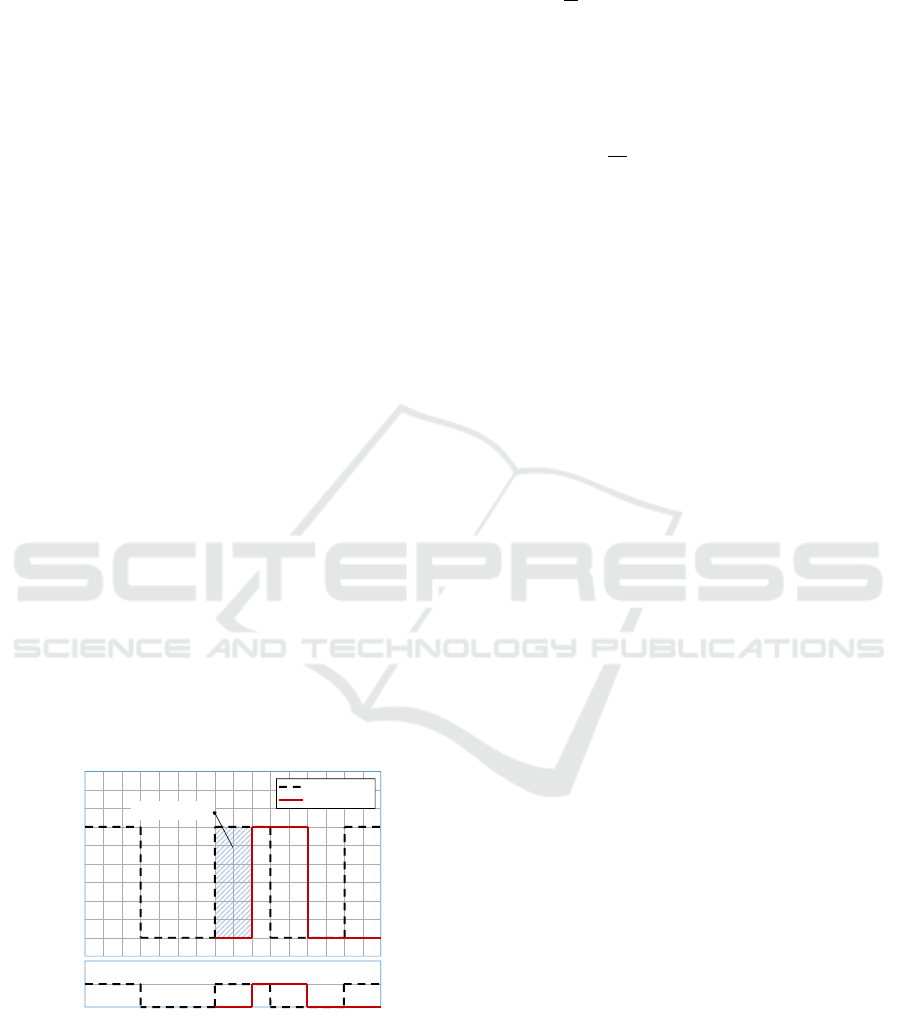
Figure 2 shows the power-related behavior of the pro-
cessor for the basic definition of EAS without consid-
ering peripheral devices and sensors.
Energy Savings
No Pattern
Pattern Applied
Figure 2: EAS Power Characteristics.
Energy Consumption: In the upper part of figure 2, the
power consumption for the sleep mode is defined as
P
0
and for the normal mode as P
1
. In the lower part,
CP
1
represents the computing power during normal
mode. The power (duty) cycle for such applications
is defined as:
D =
c
T
c = t
3
−t
1
T = t
3
−t
0
(5)
with c as the duration when the processor/system is in
normal mode and T as the overall period. Applying
this pattern, a new period T
0
> T is defined and leads
to a new relaxed power cycle D
0
, which is defined as:
D
0
=
c
T
0
T
0
= t
4
−t
0
(6)
∆P
10
= P
1
− P
0
(7)
The energy balance EB
P
can be calculated using the
eq. (6)–(7):
EB
P
= E
normal
− E
relaxed
= (D ·∆P
10
) − (D
0
· ∆P
10
)
= ∆P
10
(D − D
0
)
(8)
There is a linear relationship between relaxing the
duty cycle and energy savings. Additional effort
(power and computing power) is not required which
leads to an efficiency factor η
P
= 1. When taking
other devices into account, eq. (8) needs to be
extended, which is beyond the scope of this paper.
Execution Time/Latency: Reducing the duty cycle
has a positive effect on the execution time of the
software application. Furthermore, periodic latencies,
e.g. waiting for measured values of a sensor, can be
reduced this way.
Consequences: By applying this pattern the number
of total data points and possibly the accuracy of the
sampled signal decreases due to the reduced sampling
rate.
5.2 Pattern: Race-To-Sleep
In this section, the Race-To-Sleep pattern is de-
scribed.
5.2.1 General Information
Other Names: Race-To-Idle, Race-To-Halt, Race-To-
Zero, Race-To-Black.
Strategy: This pattern influences the timing behavior
(cf. section 3.3) of a system. It uses the highest
possible operating frequency to compute the work-
load by the application as fast as possible. After the
associated task is finished, the processor switches
to a low-power state to save energy. If a multi-core
environment is available, the application can be split
and executed on different processor cores, which also
Framework of Software Design Patterns for Energy-Aware Embedded Systems
67
addresses the timing behavior of an application.
Related Pattern: The concept of this pattern can be
extended for multi-core platforms. An application,
can (partially) benefit from parallel processing, which
can reduce the execution time significantly and the
system is able to enter a low-power state earlier
(Rossi et al., 2017).
Known Uses: Mentioned as Race-To-Idle, this pattern
is used for speed scaling in (Albers and Antoniadis,
2014). A multi-core scenario is described in (Rossi
et al., 2017).
5.2.2 Description
Abstract: This pattern has a significant influence
on the behavior of the software by addressing the
dynamic part P
dyn
and the static part P
stat
as described
in eq 2. To achieve energy efficiency, the highest
possible operating frequency of a core can be used
and additionally the application can be split and
executed on different processor cores. The imple-
mentation type varies with processor characteristics
and the application structure. Computing-intensive
applications can profit especially from this pattern.
Context: Use the Race-To-Sleep pattern in situations
where applications are computationally intensive or
consist of computational intensive parts.
Preconditions: The processor must be able to change
the frequency during runtime. If a multi-core system
for parallel processing is used, software developers
must ensure, that the software can be parallelized and
does not induct bottlenecks due to serialization.
Problem: How can an application be computed as
fast as possible while also maximizing the time a
system operates in a low-power mode?
Realization: Based on the features and capabilities of
the processor, this pattern can be applied by adjusting
the frequency and by splitting the workload to differ-
ent cores. Frequency alteration has to be supported
by the underlying operating system. Otherwise, this
functionality has to be implemented by using software
libraries (drivers and middleware) and advanced algo-
rithms to predict the need for a higher frequency. This
can be achieved by measuring the current workload or
using provided performance counters of the proces-
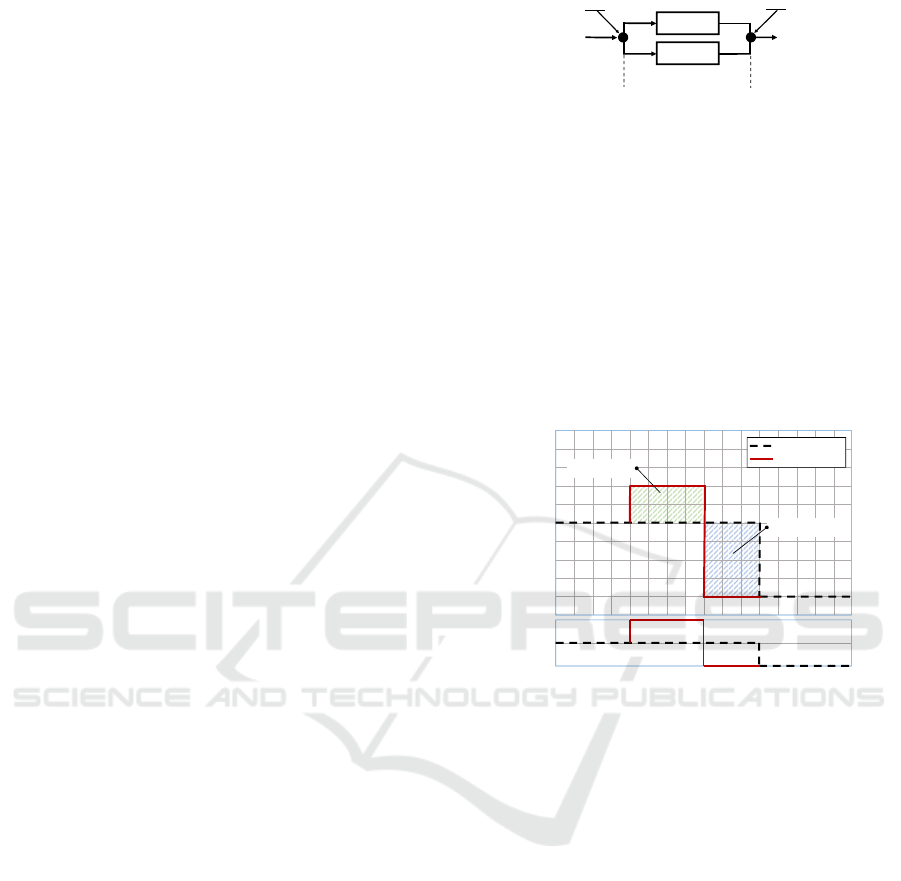
sor. For a dual-core processor, the concept of splitting
the workload is illustrated in figure 3. A fork-join ap-
proach can be used to split the workload and speed-up
the computation.
Fork
Join
Figure 3: Race-To-Sleep in Multi-Core Environment.
The workload is divided and processed on different
cores starting at time t
0
. After the last core has fin-
ished the workload at time t
1
, the results are merged
in a join process. The increase in computation power
results from additional processor cores.
5.2.3 Impact on Non-Functional Requirements
The impact on NFRs described in this section is ex-
emplarily explained for a parallel computation using
a dual-core processor, as shown in figure 4.
Energy Savings
Add. Energy
No Pattern
Pattern Applied
Figure 4: Race-To-Sleep Power Characteristics.
Energy Consumption: The upper part of figure 4
shows the temporal behavior of the pattern where P
represents the power consumption with P
0
, P
1
, P
2
for
consumptions at sleep, normal and race mode. For a
dual-core processor, the normal mode is defined as the
mode where only one processor core is active while
in race mode both cores are used. When a single-core
processor is considered, the race mode is equivalent
to an increased frequency of the processor. CP de-
scribes the computing power with CP
1
as the comput-
ing power for the normal mode and CP
2
for the race
mode. The timestamps t
0
, t
1
indicate the start and end-
point of race mode while t
2
indicates the beginning of
sleep mode. Applying this design pattern, the appli-
cation enters race mode at t
0
. The computing power
is increased and as a consequence also the power con-
sumption. During this mode, the application finishes
it’s computation and switches to the sleep mode at t
1
.
To describe this behavior, the following declarations
and assumptions are required:
ENASE 2020 - 15th International Conference on Evaluation of Novel Approaches to Software Engineering
68

∆P
10
= P
1
− P
0
∆P
21
= P
2
− P
1
(9)
∆t
10
= t
1
−t
0
∆t
21
= t
2
−t
1
(10)
E
save
= ∆P
10
· ∆t
21
E
add
= ∆P
21
· ∆t
10
(11)
∆P
21
< ∆P
10
∆t
10
≥ ∆t
21
(12)
∆P
21
∆P
10
= q
P
< 1
∆t
10
∆t
21
= q
t
≥ 1 (13)
q
P
is defined as the quotient between the power con-
sumption of the race and normal mode and q
t
as the
quotient between the duration of the race and normal
mode. The energy balance EB
P
can be calculated us-
ing eq. (9–12) with:
EB
P
= E
save
− E
add
= ∆P
10
· ∆t
21
− ∆P
21
· ∆t
10
= ∆P
10
· ∆t
21
(1 − q
P
q
t
)
(14)
EB
P
is positive if the energy savings are larger than
the additional energy, which is required to finish
the computing earlier. We define η
P
= (1 − q
P
q
t
).
Considering the MPC8641 multi-core system
(Svennebring et al., 2009), the additional energy con-
sumption is 30% higher compared to the MPC8641
running as single-core, so that q
p
= 0.3. When
choosing q
t
= 1.2, we get η
P
= 0.74.
Execution Time/Latency: Since this pattern ensures
faster processing of the application, it has a positive
influence on the execution time. The execution and
end time of the application can vary and are difficult
to predict, as the pattern dynamically changes the
computing power during run-time.
Consequences: Because some peripherals (e.g.
timers) depend on the clock rate of the SoC, it must
be ensured, that they are synchronized with the new
clock-rate and, for example, that intervals are rede-
fined if the adjustment of the frequency is achieved
without the support of the operating system. Fur-
thermore, to lower the execution time, an application
also has to be designed in such a way, that ideally no
blocking accesses and waiting periods are used. If an
application blocks the process (e.g. waiting for re-
sults) or cannot be parallelized, the effect of this pat-
tern is reduced.
5.3 Pattern: Mirroring
In this section, the Mirroring pattern is described.
5.3.1 General Information
Other Names: -
Strategy: This pattern influences the timing behavior
of the application (cf. section 3.3), by modifying how
long certain parts of the processor stay in specific
operation modes.
Related Pattern: -
Known Uses: ARM uses a technology called
big.LITTLE for their heterogeneous multi-processor
architectures to assign threads either to a high-power
or energy efficiency core, depending on the expected
computational intensity (Yu et al., 2013). This archi-
tecture may consist of an ARM Cortex A53 and Cor-
tex A57 (dual quad-core).
5.3.2 Description
Abstract: The Mirroring pattern migrates tasks
between processor cores with different levels of
power consumption.
Context: Developing energy-efficient software for
embedded systems in situations, where the underly-
ing hardware contains a multi-core architecture and a
task’s execution environment can be controlled dy-
namically. This pattern can also be used on processor
architectures, where cores have different instruction
set architectures and programming languages.
Preconditions: A typical configuration consists
of a fast, high-power processor core alongside a
slower, energy-efficient core. The different cores of a
processor must have the ability to communicate with
each other (e.g. signaling).
Problem: How can individual cores of a multi-core
system be dynamically switched on and off by
software at runtime to increase energy efficiency
without stopping the application software?
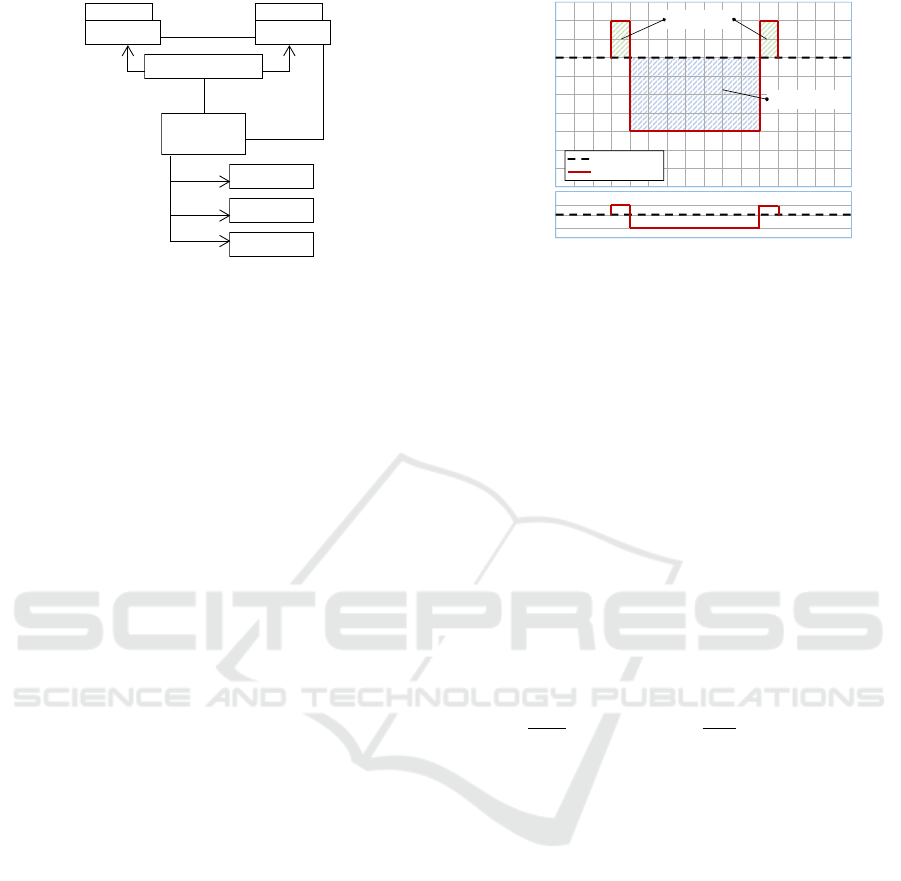
Realization: Figure 5 shows a software model of the
Mirroring pattern. The elements of the pattern pre-
sented in figure 5 are:
• TaskGroup: Consists of a Task and a MirrorTask
implementation. A Task is actively executed after
initialization. A MirrorTask is a passive copy of a
Task, allocated to another core and only powered
on when a migration is executed.
• CoreGroup: Abstraction of cores for a processor
with controlling mechanisms as well as parame-
ters for NFRs.
• CoreControl: Manages CoreGroups and controls
Framework of Software Design Patterns for Energy-Aware Embedded Systems
69
uses
Assignment
Strategy
EnergyRules
CoreControl
CoreGroup
MigrationUnit
TaskGroup
defines
controls
1
1..n
runs on
1 1..n
Figure 5: Structure of the Mirroring Pattern.
communication between the tasks. The class con-
sists of the following three main elements:
– Strategy: Manages the execution and associa-
tion of cores and tasks. Defines the order in
which tasks are migrated and cores powered.
– EnergyRules: Parameters for measuring the
load of the cores. Rules based on processor reg-
isters, performance counter or other techniques
can be used to control cores and tasks.
– MigrationUnit: Task management and switch-
ing strategies as well as power management
functions. It provides functions to instruct the
cores and perform migrations.
The concept of this pattern can be applied to dif-
ferent processor architectures. If an architecture
and operation system support technologies like ARM
big.LITTLE, tasks can be switched between cores
without the need to extend parts of the software de-
sign. Otherwise, a management layer which controls
the tasks has to be developed, as presented in figure 5.
5.3.3 Impact on Non-Functional Requirements
The impact of using the Mirroring pattern on various
energy-related parameters is described below.
Energy Consumption: The purpose of this pattern is
to optimize the energy efficiency of the system by
dynamically controlling the different cores of a pro-
cessor. The impact on consumption depends on how
the cores are controlled. Figure 6 shows an exam-
ple of this pattern applied on a system with a dual-
core processor consisting of an energy-efficient core
and a high-power core. The upper part shows the
power consumption P of the processor, where P
0
rep-
resents power consumption while both cores are in
sleep mode, P
1
shows the power consumption of the
energy-efficient core, P
2
shows the power consump-
tion of the high-power core and P
3
the consumption
of both cores. The levels of computing power CP
Energy Savings
Add. Energy
No Pattern
Pattern Applied
Figure 6: Mirroring Power Characteristics.
can be described as CP
1
for the energy-efficient core,
CP
2
for the high-power core and CP
3
as the computing
power for both cores. The switching (mirroring) of a
task starts at t
0
. In addition to the running high-power
core, the low-power core is started. The application
moves relevant computing tasks from the high-power
to the low-power core. At t
1
, the high-power core
is put into sleep mode. Between t
1
and t
2
, the sys-
tem is utilizing the low-power core. At t
2
the mirror-
ing starts again by shifting the computing tasks to the
large core. For calculating the energy balance EB
P
we define:
∆t
10
= t
1
−t
0
∆t
21
= t
2
−t
1
∆t
32
= t
3
−t
2
(15)
∆P
21
= P
2
− P
1
∆P
32
= P
3
− P
2
(16)
∆P
32
∆P
21
= q
P
< 1
∆t
10
∆t
21
= q
t
< 1 (17)
and assume that ∆t
32
= ∆t
10
. Using eq. (15)–(17),
EB
P
can be calculated:
EB
P
= E
save
− E
add
= ∆P
21
· ∆t
21
− 2 · ∆P
32
· ∆t
10
= ∆P
21
· ∆t
21
(1 − 2 · q
P
q
t
)
(18)
For this pattern, the efficiency factor is specified as
η
P
= (1 − 2 · q
P
q
t
). For example: if q
p
= 0.125 and
q
t
= 0.1, we get the efficiency factor η
P
= 0.975.
The power consumption highly depends on the
application as well as processor characteristics and
needs to be considered in detail. Each change of
a state (e.g. go-to-sleep and wake-up) consumes
energy (e.g. load and unload of capacitance), which
has to be considered in the application design (Urard
and Vu
ˇ
cini
´
c, 2017).
Execution Time/Latency: There are two different im-
pacts on the execution time when using this pattern.
The first impact is the time related to the overhead
during the execution of CoreControl. The second
ENASE 2020 - 15th International Conference on Evaluation of Novel Approaches to Software Engineering
70
impact is caused by the processor configurations. If a
task is moved between two differently clocked cores,
the execution time can be shortened or extended.
Consequences: This pattern can be modified to con-
trol N cores and assign M different tasks to the N
cores (N, M ∈ N). If the cores have the same archi-
tecture and compilers for the same programming lan-
guage, the development costs are low. If source code
for a Task has to be ported from e.g. C++ to Assem-
bler or if multiple cores with different compilers and
programming languages are used, the development
costs will increase because of the N different software
versions of the same task. CoreControl is the manag-
ing instance, so it must be executed on a core that is
either permanently active or switched off last. To get
the best energy balance, this core is typically the most
energy-efficient core.
5.4 Pattern: PowerMonitor
In this section, we describe the PowerMonitor pat-
tern in detail, whose general idea was introduced in
(Uelschen et al., 2019).
5.4.1 General Information
Other Names:-
Strategy: This pattern reduces the active time of a
peripheral device as well as the overall capacity of
the system by automatically disabling all peripheral
devices and interfaces which are no longer in use or
requested by any part of the application.
Related Pattern: -
Known Uses: At the block level of integrated circuit
design (hardware layer), this technique is known as
power-gating. (Jiang et al., 2005)
5.4.2 Description
Abstract: The PowerMonitor pattern considers the
power consumption properties of both the SoC
itself and external peripheral devices. The access of
external peripheral and interfaces (e.g. I
2
C or SPI)
are managed by a single instance. The centralized
approach allows a deep knowledge of the devices
and it can disable devices and change their power
modes dynamically when they are temporarily not
needed. This also includes interfaces with one or
more devices connected to it.
Context: Use the PowerMonitor pattern when an
application has to access peripheral interfaces and
devices periodically. This pattern is also suitable
when a centralized and fine-grained hardware access
control has to be achieved.
Preconditions: This application requires physical
access of all interfaces (e.g. I
2
C or SPI) and the
application must have the direct or indirect capability
to disable and enable external devices like sensors
and actuators as well as clocks of functional units.
Problem: How may a fine-grained dynamic power
consumption strategy be implemented, which runs
application code while only enabling peripheral
devices on request? Additionally, how can conflicts
between sleep modes (e.g. preventing software from
being executed) and use cases (e.g. performing
continuous tasks) be addressed?
Realization: The reference implementation for this
pattern follows a C++17 template meta-programming
approach and provides an abstract and type-safe in-
terface. Only the PowerMonitor interacts with hard-
ware devices so that every other instance can use the
provided functions and does not have to implement
the hardware access itself, which could be a repetitive
and time-consuming process.
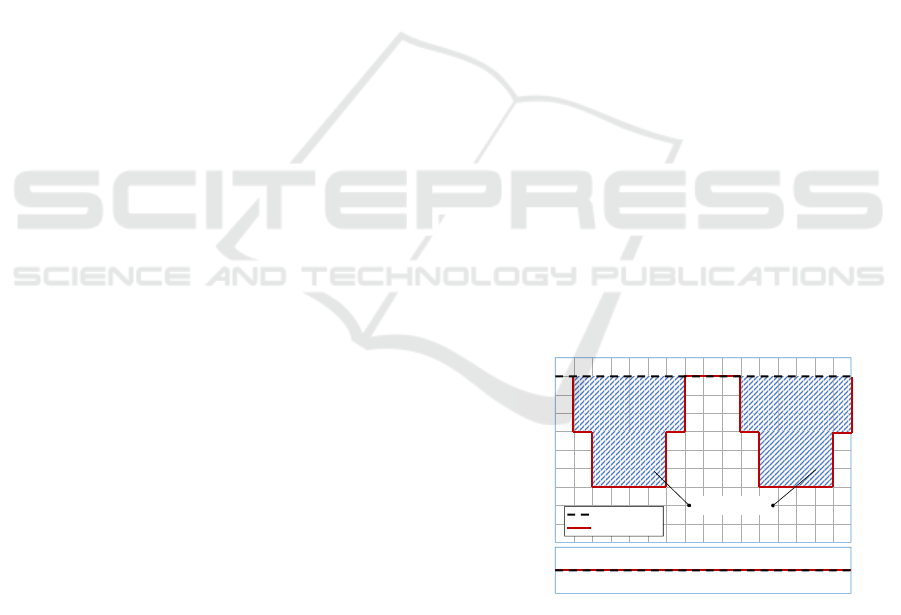
5.4.3 Impact on Non-Functional Requirements
Figure 7 sketches the power characteristics of the
PowerMonitor pattern.
Energy Savings
No Pattern
Pattern Applied
Figure 7: PowerMonitor Power Characteristics.
Energy Consumption: The computing power (lower
part of figure 7) is not affected by this pattern and
remains constant at level CP
1
. We assume that the
considered functional unit and the peripheral device
are disabled before t
0
. The power consumption of this
state is denoted as P
1
.To describe the behavior, the
following declarations are required:
Framework of Software Design Patterns for Energy-Aware Embedded Systems
71

T = t
4
−t
0
∆P
21
= P
2
− P
1
∆P
31
= P
3
− P
1
(19)
∆t
10
= t
1
−t
0
∆t
21
= t
2
−t
1
∆t
32
= t
3
−t
2
(20)
In order to access devices, the PowerMonitor enables
at first the functional unit (e.g. I
2
C) beginning at t
0
.
Afterwards at t
1
, the peripheral device (sensor con-
nected via I
2
C) gets enabled. During ∆t
21
, the appli-
cation can access the device without loss of function-
ality. The power consumption level is P
3
. After uti-
lization, the application dynamically disables the ex-
ternal device at first and the functional unit of the SoC
afterwards. The power consumption drops back to the
previous level P
1
. The energy savings of the pattern
depends on the power consumption of the SoC’s func-
tional unit ∆P
21
and the external device ∆P
31
. EB
P
can be calculated using eq. (19)–(20):
E
normal
= T · ∆P
31
E
monitor
= (∆t
10
+ ∆t
32
) · ∆P
21
| {z }
≈0
+∆t
21
· ∆P
31
EB
P
= E
save
= E
normal
− E
monitor
= ∆P
31
· (T − ∆t
21
)
(21)
The first part of E
monitor
can be ignored since the
fast enabling of functional units usually takes only
a few clock cycles. Because the basic concept of
this pattern does not require additional energy, the
efficiency factor η
P
= 1.
Execution Time/Latency: Switching devices on and
off adds latencies which are caused by the software
itself and the affected hardware components. To
achieve a clear and simple description of the basic
concept of this pattern shown in figure 7, additional
latencies are not considered. Those latencies depend
on the characteristics of the hardware layer and
cannot be generalized.
Consequences: For each new interface (e.g. I
2
C) and
device (e.g. sensor) used in the system, the Power-
Monitor needs to be extended which can increase the
development time and required hardware resources
(e.g. memory) of the application.
6 CONCLUSION
In this paper, we presented a novel approach to in-
clude power consumption in the definition of soft-
ware design patterns for embedded systems. First,
we have shown how the software can influence the
power consumption of an embedded system. Next, a
framework to describe Energy-Aware software design
patterns is proposed. The approach modifies and ex-
tends well-known pattern descriptions with attributes
related to the power consumption. We used the pro-
posed pattern framework to uniformly document four
design patterns with effects on the energy efficiency
of a system. Software developers can use the frame-
work to express software design patterns affecting the
energy consumption. Based on a power-timing dia-
gram, which is presented for all pattern descriptions,
we introduce the efficiency factor, a dimensionless
numerical value in order to make possible energy sav-
ings quantifiable. The efficiency factor describes the
trade-off between energy savings and the energy over-
head of a pattern. It can be a helpful tool to compare
the energy efficiency on different systems using the
same pattern. However, the efficiency factor is not
suitable for comparing the efficiency of energy sav-
ings between different patterns.
Future work following the current results includes
an extension of a pattern catalog by systematically de-
scribing more patterns using the framework. This can
lead to the design of a reference catalog to point out
the advantages of each pattern for a specific problem
domain. Another part of the future work includes an
analysis of the effect on energy consumption for use
cases where more than one pattern is used at the same
time.
ACKNOWLEDGEMENTS
This work was partially funded by the German Fed-
eral Ministry of Economics and Technology (Bun-
desministeriums fuer Wirtschaft und Technologie-
BMWi) within the project ”Holistic Model Driven
Development for embedded systems in consideration
of diverse hardware architectures” (HolMES). The
authors are responsible for the contents of this pub-
lication.
REFERENCES
Abdulsalam, S., Lakomski, D., Gu, Q., Jin, T., and Zong, Z.
(2014). Program energy efficiency: The impact of lan-
guage, compiler and implementation choices. In 2014
International Green Computing Conference (IGCC),
pages 1–6, Piscataway, NJ. IEEE.
Albers, S. and Antoniadis, A. (2014). Race to idle. ACM
Transactions on Algorithms, 10(2):1–31.
Armoush, A. (2010). Design patterns for safety-critical em-
bedded systems. PhD thesis, Aachen.
Banerjee, A., Chattopadhyay, S., and Roychoudhury, A.
(2016). On testing embedded software. volume 101
of Advances in Computers, pages 121–153. Elsevier.
ENASE 2020 - 15th International Conference on Evaluation of Novel Approaches to Software Engineering
72

Bunse, C. and H
¨
opfner, H. (2008). Resource substitution
with components - optimizing energy consumption.
In ICSOFT 2008 - Proceedings of the Third Inter-
national Conference on Software and Data Technolo-
gies, Volume SE/MUSE/GSDCA, Porto, Portugal, July
5-8, 2008, pages 28–35. INSTICC Press.
Douglass, B. P. (2011). Design patterns for embedded sys-
tems in C: An embedded software engineering toolkit.
Newnes/Elsevier, Oxford and Burlington, MA.
Feitosa, D., Alders, R., Ampatzoglou, A., Avgeriou, P., and
Nakagawa, E. Y. (2017). Investigating the effect of
design patterns on energy consumption. Journal of
Software: Evolution and Process, 29(2):e1851.
Gamma, E., Helm, R., Johnson, R., and Vlissides, J. M.
(1994). Design Patterns: Elements of Reusable
Object-Oriented Software. Addison-Wesley Profes-
sional.
Iyenghar, P. and Pulvermueller, E. (2018). A model-driven
workflow for energy-aware scheduling analysis of iot-
enabled use cases. IEEE Internet of Things Journal,
5(6):4914–4925.
Jiang, H., Marek-Sadowska, M., and Nassif, S. R. (2005).
Benefits and costs of power-gating technique. In 2005
International Conference on Computer Design, pages
559–566, Los Alamitos, CA. IEEE Computer Society.
Kim, N. S., Austin, T., Blaauw, D., Mudge, T., Flautner, K.,
Hu, J. S., Irwin, M. J., Kandemir, M., and Narayanan,
V. (2003). Leakage current: Moore’s law meets static
power. Computer, 36(12):68–75.
Landau, H. J. (1967). Sampling, data transmission, and the
nyquist rate. Proceedings of the IEEE, 55(10):1701–
1706.
Lim, C., Ahn, H. T., and Kim, J. T. (2007). Predictive dvs
scheduling for low-power real-time operating system.
In Na, Y. J., editor, International Conference on Con-
vergence Information Technology, 2007, pages 1918–
1921, Los Alamitos, CA. IEEE Computer Society.
Litke, A., Zotos, K., Chatzigeorgiou, A., and Stephanides,
G. (2007). Energy consumption analysis of design
patterns. International Journal of Electrical, Com-
puter, Energetic, Electronic and Communication En-
gineering, 1(11):1663–1667.
Maleki, S., Fu, C., Banotra, A., and Zong, Z. (2017). Un-
derstanding the impact of object oriented program-
ming and design patterns on energy efficiency. In 2017
Eighth International Green and Sustainable Comput-
ing Conference (IGSC), pages 1–6, NJ. IEEE.
Mi
´
skowicz, M. (2016). Event-based control and signal pro-
cessing. Embedded systems. CRC Press, Boca Raton.
Noureddine, A. and Rajan, A. (2015). Optimising energy
consumption of design patterns. In Proceedings of the
37th International Conference on Software Engineer-
ing - Volume 2, ICSE ’15, pages 623–626, Piscataway,
NJ, USA. IEEE Press.
Oshana, R. and Kraeling, M. (2013). Software engineering
for embedded systems: Methods, practical techniques,
and applications. Newnes/Elsevier, Waltham, MA.
Pang, C., Hindle, A., Adams, B., and Hassan, A. E. (2016).
What do programmers know about software energy
consumption? IEEE Software, 33(3):83–89.
Patterson, D. A. and Hennessy, J. L. (2014). Computer
organization and design: The hardware/software in-
terface. The Morgan Kaufmann series in computer
architecture and design. Elsevier/Morgan Kaufmann,
Amsterdam and Boston.
Pering, T., Burd, T., and Brodersen, R. (1998). The sim-
ulation and evaluation of dynamic voltage scaling al-
gorithms. In Chandrakasan, A. and Kiaei, S., editors,
Proceedings, pages 76–81, NY. ACM Order Dept.
Reinfurt, L., Breitenb
¨
ucher, U., Falkenthal, M., Leymann,
F., and Riegg, A. (2017a). Internet of things pat-
terns for devices. In Ninth international Conferences
on Pervasive Patterns and Applications (PATTERNS)
2017, pages 117–126.
Reinfurt, L., Breitenb
¨
ucher, U., Falkenthal, M., Leymann,
F., and Riegg, A. (2017b). Internet of things patterns
for devices: Powering, operating, and sensing. Inter-
national Journal on Advances in Internet Technology,
pages 106–123.
Rossi, D., Loi, I., Pullini, A., and Benini, L. (2017).
Ultra-low-power digital architectures for the internet
of things. In Alioto, M., editor, Enabling the Internet
of Things, volume 59, pages 69–93. Springer Interna-
tional Publishing, Cham.
Shu, T., Xia, M., Chen, J., and Silva, C. d. (2017). An en-
ergy efficient adaptive sampling algorithm in a sensor
network for automated water quality monitoring. Sen-
sors (Basel, Switzerland), 17(11).
Svennebring, J., Logan, J., Engblom, J., and Str
¨
omblad, P.
(2009). Embedded multicore: An introduction.
Tan, T. K., Raghunathan, A., and Jha, N. K. (2003). Soft-
ware architectural transformations: a new approach to
low energy embedded software. In Design, Automa-
tion, and Test in Europe Conference and Exhibition,
pages 1046–1051, Los Alamitos, CA. IEEE Computer
Society.
Tobola, A., Streit, F. J., Espig, C., Korpok, O., Sauter,
C., Lang, N., Schmitz, B., Hofmann, C., Struck, M.,
Weigand, C., Leutheuser, H., Eskofier, B. M., and Fis-
cher, G. (2015). Sampling rate impact on energy con-
sumption of biomedical signal processing systems. In
2015 IEEE 12th International Conference on Wear-
able and Implantable Body Sensor Networks (BSN),
pages 1–6, NJ. IEEE.
Uelschen, M., Schaarschmidt, M., Fuhrmann, C., and West-
erkamp, C. (2019). Powermonitor: Design pattern for
modelling energy-aware embedded systems. In Pro-
ceedings of the International Conference on Embed-
ded Software Companion, EMSOFT ’19, New York,
NY, USA. ACM.
Urard, P. and Vu
ˇ
cini
´
c, M. (2017). Iot nodes: System-level
view. In Alioto, M., editor, Enabling the Internet of
Things, volume 29, pages 47–68. Springer Interna-
tional Publishing, Cham.
Yu, K., Han, D., Youn, C., Hwang, S., and Lee, J. (2013).
Power-aware task scheduling for big.little mobile pro-
cessor. In International SoC Design Conference
(ISOCC), 2013, pages 208–212, NJ. IEEE.
Framework of Software Design Patterns for Energy-Aware Embedded Systems
73
