
The Suitability of Graph Databases for Big Data Analysis: A Benchmark
Martin Macak
1,2
, Matus Stovcik
1,2
and Barbora Buhnova
1,2
1
Institute of Computer Science, Masaryk University, Brno, Czech Republic
2
Faculty of Informatics, Masaryk University, Brno, Czech Republic
Keywords:
Big Data, Benchmark, Graph Database, Neo4j, PostgreSQL.
Abstract:
Digitalization of our society brings various new digital ecosystems (e.g., Smart Cities, Smart Buildings, Smart
Mobility), which rely on the collection, storage, and processing of Big Data. One of the recently popular
advancements in Big Data storage and processing are the graph databases. A graph database is specialized
to handle highly connected data, which can be, for instance, found in the cross-domain setting where various
levels of data interconnection take place. Existing works suggest that for data with many relationships, the
graph databases perform better than non-graph databases. However, it is not clear where are the borders for
specific query types, for which it is still efficient to use a graph database. In this paper, we design and perform
tests that examine these borders. We perform the tests in a cluster of three machines so that we explore
the database behavior in Big Data scenarios concerning the query. We specifically work with Neo4j as a
representative of graph databases and PostgreSQL as a representative of non-graph databases.
1 INTRODUCTION
With the growing popularity of the Internet of Things
(IoT), Big Data technologies have emerged as a crit-
ical tool bringing a better understanding of cross-
domain knowledge within IoT infrastructures. Smart
cities (Piro et al., 2014; Walletzky et al., 2018) are
one example, covering many sub-domains, such as
smart buildings, smart mobility, smart grids, and oth-
ers (Gesvindr et al., 2017; Rossi et al., 2016; Chren
et al., 2018).
Although the topic of Big Data analytics in digital
IoT and cross-domain infrastructures is extensively
researched, the disparity between various Big Data
analytics methods and tools is supported with isolated
experience rather than evidence, measurement, and
benchmarks. Among storage strategies, both NoSQL
and relational databases are used to store IoT data,
with not much explicit discussion of the reasoning be-
hind the choice (Ge et al., 2018). While in the Smart
Cities domain, NoSQL solutions are preferred to store
IoT data, traditional domains such as healthcare and
agriculture are still using relational databases for IoT
data (Ge et al., 2018). Moreover, it seems that the
choice propagates in the domain by experience (mod-
ern domains prefer NoSQL databases, traditional do-
mains prefer relational databases), and the potential
of the new storage strategies remains unexplored.
Graph databases are one of the recent strategies
in IoT and Big Data storage, which rises in popu-
larity thanks to its increasing accessibility. They are
designed to handle highly connected data effectively.
Therefore, they are a very good candidate for cross-
domain analysis. Multiple benchmarks show their
strengths comparing to their non-graph database vari-
ant when applied to highly-connected data (Almabdy,
2018; Vicknair et al., 2010). This is implied by expen-
sive JOIN operations in non-graph databases, while
graph databases offer to traverse many connections
very fast.
On the other hand, there are situations in which
graph databases seem not to be the optimal choice.
For example, when the relationships between data are
not available, the data is queried only as a key-value
store, or when the queries need to scan all data (Miler
et al., 2014; Kolomi
ˇ
cenko et al., 2013). However,
these recommendations for both directions (choosing
vs. avoiding graph databases) only focus on the ex-
treme cases, which are rarely present in practice, and
hence, the recommendations have limited usability in
practice. We are not aware of a work that would de-
scribe practical borders among the situations in which
the non-graph databases perform better than the graph
ones or vice versa. Moreover, the benchmarks be-
come even rarer when it comes to Big Data and the
need to run the analysis in a cluster.
Macak, M., Stovcik, M. and Buhnova, B.
The Suitability of Graph Databases for Big Data Analysis: A Benchmark.
DOI: 10.5220/0009350902130220
In Proceedings of the 5th International Conference on Internet of Things, Big Data and Security (IoTBDS 2020), pages 213-220
ISBN: 978-989-758-426-8
Copyright
c
2020 by SCITEPRESS – Science and Technology Publications, Lda. All rights reserved
213

In this paper, we contribute to the state of the
art in supporting the decision about the storage so-
lution, namely choosing among graph and non-graph
database in non-extreme cases. For each case of data
cohesion, we design and run several tests with dif-
ferent query types. To make the database decision-
relevant in Big Data context, we work with a huge
data set, which calls for a storage solution in a cluster
of computers. We hence import this data to distributed
versions of databases, exploring how the queries be-
have in a cluster. For each chosen database in the
comparison, which are Neo4j and PostgreSQL, we
perform these tests in a cluster of three machines.
The structure of the paper is as follows. After
the related work overview in Section 2, we motivate
our choice of the compared database solutions in Sec-
tion 3. In Section 4, the setup and design of the ex-
periments are discussed, followed by the results of the
experiments in Section 5. Section 6 contains the inter-
pretations of results and recommendations that were
created based on them. Section 7 discusses the threats
to validity of this work, and Section 8 concludes it
with a summary of findings.
2 RELATED WORK
In this section, we discuss existing studies aimed at
comparing graph and non-graph databases from the
point of view of performance comparison (Section
2.1) as well as a comparison of features and charac-
teristics (Section 2.2).
2.1 Performance Comparison
In existing performance comparisons between graph
and non-graph databases, the relational database is
typically chosen as the representative of non-graph
databases. However, none of the existing compar-
isons is testing the performance in a cluster of ma-
chines.
Vicknair et al. (Vicknair et al., 2010) made a per-
formance comparison of queries between the Neo4j
graph database and the MySQL relational database.
Their experiments were performed on the data prove-
nance information. Almabdy (Almabdy, 2018) also
performed a performance comparison between Neo4j
and MySQL. The designed queries were executed on
Twitter social network data set. Those two databases
were also compared in a research work by Joishi and
Sureka (Joishi and Sureka, 2017), in which they im-
plemented two process mining algorithms and com-
pared their performance between Neo4j and MySQL.
Miler et al. (Miler et al., 2014) measured the per-
formance of Dijkstra shortest path algorithm between
Neo4j and relational database PostgreSQL. Those two
databases were also compared by Kan et al. (Kan
et al., 2017) in the analysis of power grid data.
In (Ding et al., 2019), the performance of Neo4j
was extensively compared with ArangoDB and Post-
greSQL. In (Kolomi
ˇ
cenko et al., 2013), Kolomi-
cenko et al. performed experiments on several
graph databases, but also for the MongoDB docu-
ment store and the MysqlGraph relational database.
Khan and Shahzad (Khan and Shahzad, 2017) com-
pared the latency of queries between the Oracle re-
lational database and Neo4j. In addition, Sharma et
al. (Sharma et al., 2018) compared Neo4j and Mon-
goDB on geotagged data.
Several benchmarks test the performance of
NoSQL databases in a cluster. However, authors
of these papers do not consider graph databases, so
they are not relevant to us. For example, Tang and
Fan (Tang and Fan, 2016) compared five NoSQL
databases that run in a cluster with four nodes.
Swaminathan and Elmasri (Swaminathan and El-
masri, 2016) compared the performance of three
NoSQL databases. Tests were performed on multi-
ple sizes of data sets and for multiple cluster sizes.
Gandini et al. (Gandini et al., 2014) also performed
benchmarks for three NoSQL databases with differ-
ent types of virtual machines and cluster sizes. These
papers, however, do not address our problem because
there is a missing link between the database cluster
comparisons and graph database comparisons.
2.2 Comparison of Features and
Characteristics
Several papers have been written about the techni-
cal comparison of the graph and non-graph databases.
These are typically mentioned in papers that com-
pare NoSQL with relational databases. As the graph
database is a NoSQL database, we mention those pa-
pers that contain graph databases as part of them.
These papers can undoubtedly help with the choice
of whether to use a graph database, but on the other
hand, experiments are needed to support these claims.
Sahatquija et al. (Sahatqija et al., 2018) did qual-
itative research that reviewed in more detail the ad-
vantages and disadvantages of NoSQL databases and
relational databases over each other. They mention
many criteria, like scalability, performance, flexibil-
ity, querying, security, and data management. Ous-
sous et al. (Oussous et al., 2015) also presented
a detailed comparison between SQL and NoSQL
databases from multiple points of view. Makris et
IoTBDS 2020 - 5th International Conference on Internet of Things, Big Data and Security
214

al. (Makris et al., 2016) reviewed the differences
between relational and NoSQL databases in multi-
ple aspects like schema, transaction methodology,
complexity, fault tolerance, consistency, and dealing
with Big Data. Corbellini et al. (Corbellini et al.,
2017) reviewed NoSQL databases, described their
features, compared them with relational ones, and
provided some basic recommendations for each of
them. Nayak et al. (Nayak et al., 2013) provided
the advantages and disadvantages of using a NoSQL
database and a relational database over each other.
Kamal et al. (H Kamal et al., 2019) presented a qual-
itative comparison of Neo4j, MongoDB, and Redis.
3 DATABASES UNDER
COMPARISON
Representatives of two different database schemas
have been selected for our comparison. Both
databases are prevalent and representative enough so
that they can be mapped to other database systems
that are currently in use. When choosing these repre-
sentatives, we have determined the popularity of ex-
isting databases based on the DB-Engines website
1
where the popularity score based on multiple factors,
like frequency of Google search, relevance in social
networks, and a number of job offers, is given.
3.1 Neo4j
As the representation of graph databases, the Neo4j
version 3.5.3
2
was chosen. Neo4j is one of the lead-
ing software in graph databases with active support
and development. We have found the Neo4j to be the
right choice among other graph database software be-
cause it performed well in several comparisons with
other graph databases (Dominguez-Sal et al., 2010;
Jouili and Vansteenberghe, 2013; Ciglan et al., 2012).
It uses nodes and relationships to store and navigate
through data, which allows for less costly traversing
through data than SQL joins. Nodes and relation-
ships are labeled by name and grouped according to
sets. Unlike conventional SQL management systems,
Neo4j offers structure-free development, which adds
to the agility of the whole data storage. This database
offers easy replication via core and read-only nodes.
In our case, we used three core nodes. Neo4j does
not use the traditional concept of master and slave hi-
erarchy; instead, nodes vote leader for every period
to maintain freshness and availability. However, there
1
https://db-engines.com/en/ranking
2
http://neo4j.org
are leaders and followers; only the leader is allowed
to write operations.
3.2 PostgreSQL
To represent relational databases, PostgreSQL ver-
sion 11.2
3
has been chosen. PostgreSQL is a mod-
ern object-relational database system with over three
decades of active development. It ensures robustness,
reliability, and performance. PostgreSQL is devel-
oped into strong competition with NoSQL manage-
ment systems, mainly because of its scalability. The
database consists of tables and rows; tables have a
fixed structure, changing the mentioned structure re-
quires nontrivial effort. However, the relational aspect
is stable, well-known, and embedded in the tech com-
munity. This paper tests PostgreSQL capabilities in
large inter-table searches.
4 DESIGN OF EXPERIMENTS
This section details the design of experiments, which
has been considered in this work.
4.1 Description of Our Data Set
To correctly determine for which level of data com-
plexity the chosen graph database is more suitable,
we decided to use a large data set named Microsoft
Academic Graph (Sinha et al., 2015). The data set
contains over 1.7 billion rows, 14 tables, and 13 rela-
tionships between the mentioned tables. Only three of
the mentioned tables did not contain the self-id value.
Tables contained a relatively high number of refer-
ence keys. Many attributes were represented as string
values, for example, names and URL attributes. The
number of rows provided us desirable volume, one of
the aspects of Big Data. A number of relationships
contributed to a series of distinct queries on our data
set and allowed us to show the difference between
references of SQL and the traversal relationship of a
graph database. Therefore the data set was the right
choice for this comparative study.
4.2 Setup
We configured each node in a cluster with an Intel
Skylake (2.2GHz, 4 cores), 16GB RAM run-
ning on Ubuntu 16.04 LTS 64bit Linux 4.4.0
kernel.
3
https://www.postgresql.org/
The Suitability of Graph Databases for Big Data Analysis: A Benchmark
215

Then, the first step in our research was to pre-
process our data to load it properly. Afterward, we
modeled the data to fit our specifications. We had
to load and model each database differently. Neo4j
needed relationships for fast traversal between nodes
and indexes on primary keys. Relationships in Neo4j
were created by querying reference and primary keys,
similar to join with respecting the direction of ref-
erence. PostgreSQL required primary keys, indexes,
references, and foreign keys.
We decided to go with three-node clusters with
configuration focused on reading and high availabil-
ity. Each of the chosen databases was configured to
clusters in the most suitable way for our use cases. We
focused on memory and processing equality for our
configurations. However, there are some differences
between configurations of Neo4j, and PostgreSQL
because each one of them has different needs, and our
goal was to find the best settings for each mentioned
database.
Both databases required CSV files for loading.
However, each had different syntax and mechanics of
this process. The best and fastest way of loading the
data into Neo4j was to use neo4j-admin import tool
with a configuration and sequence. Next, we loaded
PostgreSQL using its console. First, we had to use
CREATE for creating a table, and afterward, we used
COPY to copy the data set from a CSV file to the
table. Every data loading was done on master nodes,
and then the masters propagated data to slaves or read-
only nodes.
4.3 Queries
We aimed for queries to be in groups of a certain
level of data cohesion. We created sets of queries de-
pending on the inter-table connection. We focused
on identifying the specific number of joins or traver-
sals needed for a query to be effective in the graph
database. We were continuously creating more com-
plex queries.
To compare our query results, we used the built-
in tools’ timers. Each query was run five times. We
removed the biggest and the lowest value from the re-
sults, and then we averaged the remaining three values
for the final result.
We wanted to highlight the power of relationships
in the graph database. The first set of queries named
J1, J2, J3 were simple join across multiple tables.
This queries aimed at determining the threshold of
data-level complexity. We wanted to test real-world
heterogeneous data. Therefore each table may have
varied in several rows and levels of interconnection.
The second batch of queries contained the same
joins as the previous with the addition of filters and
simple conditions. We wanted to perform real-world
use cases by using simple where statements. We as-
signed names W1, W2, W3 for these queries.
The third collection of queries focuses on using
string contains functions. By doing this, we wanted
to test how database tools handle working with values
by filtering values based on content. We named these
queries C1, C2, C3.
J1 Counts the number of papers presented at a
conference.
J2 Counts the number of papers presented at con-
ference instances.
J3 Counts the number of journals presented at
conference instances.
W1 Counts the number of papers presented at con-
ferences with a specified short name.
W2 Counts the number of papers, linked through
a conference with a specified short name that was pre-
sented at conference instances.
W3 Counts the number of journals, linked through
a conference with a specified short name, that was
presented at conference instances.
W4 Counts the number of papers with specified
original paper title presented at conferences.
C1 Counts the number of papers linked to a con-
ference with short name containing specified sub-
string that was presented at conference instances.
C2 Counts the number of papers, linked through a
conference with short name containing specified sub-
string that was presented at conference instances.
C3 Counts the number of journals, linked through
a conference with short name containing specified
sub-string, that have been presented at conference in-
stances.
5 RESULTS OF EXPERIMENTS
This section contains all measurements of the de-
signed queries. Also, the standard error (SE) is pre-
sented in the tables.
We expected that PostgreSQL would dominate in
less complex inter-connections. However, in J1, we
found that Neo4j handled values counting of the join
between the enormous size of Papers and Confer-
ences better, as shown in Table 1. PostgreSQL did not
have a space for any optimization. Therefore Neo4j
performed better with pre-made relationships.
Moving to J2 and J3, PostgreSQL performed bet-
ter than Neo4j, as visible in Table 2 and Table 3.
Despite the pre-made relationship, Neo4j performed
worse. We accredit this behavior to PostgreSQL opti-
mizations of joins where it did not have to use every
IoTBDS 2020 - 5th International Conference on Internet of Things, Big Data and Security
216

row in both the joined tables. Instead, PostgreSQL
chose a subset of rows which led to improved per-
formance. However, Neo4j searched for raw matches
inside the database.
Table 1: Measurements of J1 query.
# Neo4j PostgreSQL
1. 524 ms 22,561 ms
2. 571 ms 22,538 ms
3. 614 ms 22,440 ms
4. 565 ms 20,456 ms
5. 587 ms 21,458 ms
SE 14.74 ms 413.26 ms
Table 2: Measurements of J2 query.
# Neo4j PostgreSQL
2. 3,023 ms 1,127 ms
3. 3,178 ms 1,159 ms
1. 3,112 ms 1,104 ms
4. 3,301 ms 1,009 ms
5. 3,103 ms 1,113 ms
SE 46.45 ms 25.15 ms
Table 3: Measurements of J3 query.
# Neo4j PostgreSQL
1. 1,732 ms 1,355 ms
2. 1,760 ms 1,185 ms
3. 1,785 ms 1,186 ms
4. 1,760 ms 1,204 ms
5. 1,715 ms 1,175 ms
SE 12.19 ms 33.82 ms
Table 4: Measurements of W1 query.
# Neo4j PostgreSQL
1. 23 ms 3.621 ms
2. 27 ms 3.737 ms
3. 47 ms 3.753 ms
4. 23 ms 3.664 ms
5. 25 ms 3.831 ms
SE 4.56 ms 0.036 ms
Table 5: Measurements of W2 query.
# Neo4j PostgreSQL
1. 30 ms 24.684 ms
2. 44 ms 23.895 ms
3. 43 ms 22.352 ms
4. 31 ms 22.104 ms
5. 30 ms 23.455 ms
SE 3.23 ms 0.48 ms
Table 6: Measurements of W3 query.
# Neo4j PostgreSQL
1. 73 ms 35.498 ms
2. 69 ms 33.987 ms
3. 68 ms 33.254 ms
4. 75 ms 34.477 ms
5. 69 ms 34.664 ms
SE 1.36 ms 0.37 ms
In the next queries, we searched for a specific con-
ference across one (Table 4), two (Table 5), or three
(Table 6) tables. We found that PostgreSQL man-
aged to perform better. The difference was signifi-
cant; Neo4j needed almost eight times more time.
Table 7: Measurements of W4 query.
# Neo4j PostgreSQL
1. 2,256 ms 22,559 ms
2. 2,481 ms 22,116 ms
3. 2,509 ms 22,504 ms
4. 2,486 ms 22,415 ms
5. 2,500 ms 22,496 ms
SE 47.86 ms 78.92 ms
Query W4 was similar to query W1. The differ-
ence was between the direction of traversal. There is
a performance difference, as shown in Table 7. We
observed that searching for a value in a node from
which a relationship starts is faster than the opposite.
These results demonstrated that Neo4j might perform
nine times better if relationships are in the right order.
Table 8: Measurements of C1 query.
# Neo4j PostgreSQL
1. 118 ms 86.785 ms
2. 129 ms 88.536 ms
3. 123 ms 86.334 ms
4. 152 ms 86.595 ms
5. 131 ms 88.160 ms
SE 5.82 ms 0.45 ms
Table 9: Measurements of C2 query.
# Neo4j PostgreSQL
1. 2,301 ms 1,108 ms
2. 2,317 ms 996 ms
3. 2,309 ms 1,001 ms
4. 2,298 ms 1,051 ms
5. 2,281 ms 1,064 ms
SE 6.04 ms 20.85 ms
Table 10: Measurements of C3 query.
# Neo4j PostgreSQL
1. 51 ms 21.158 ms
2. 47 ms 21.790 ms
3. 57 ms 22.480 ms
4. 46 ms 21.297 ms
5. 48 ms 23.329 ms
SE 1.98 ms 0.40 ms
We decided to use the contains function in val-
ues. The queries were modeled as one (Table 8),
two (Table 9), or three (Table 10) joined tables as we
wanted to show how each database performs on dif-
ferent inter-connection levels. PostgreSQL performed
better than Neo4j. However, the difference between
Neo4j and PostgreSQL was smaller than in the W
queries.
The Suitability of Graph Databases for Big Data Analysis: A Benchmark
217
6 INTERPRETATIONS OF
RESULTS AND
RECOMMENDATIONS
For each query measurement, we excluded the maxi-
mum and minimum value, and from the rest, we com-
puted an average. They are in the following figures.
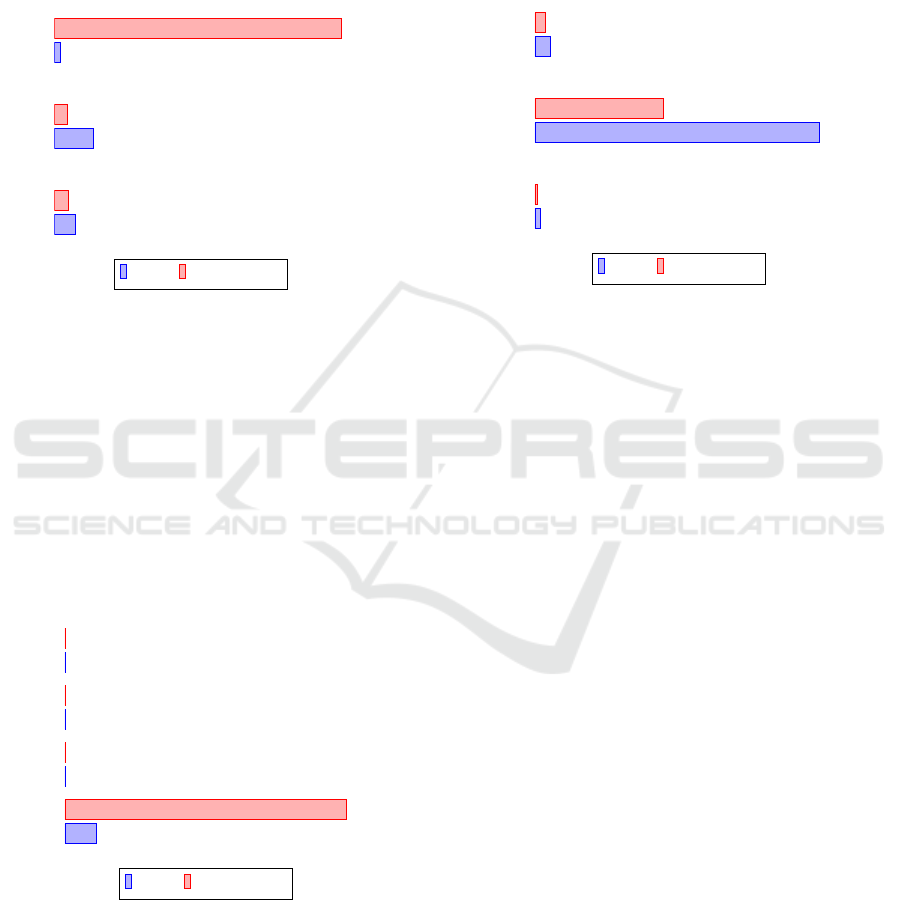
J3
J2
J1
574
3,140
1,751
22,145
1,115
1,191
Neo4j PostgreSQL
Figure 1: Mean values of J queries (ms).
Neo4j managed to outperform PostgreSQL in J1
query vastly. It shows that the relationships of the
graph have great potential. Despite having worse disk
space demands, it allowed Neo4j to perform 20 times
better than PostgreSQL. We found that PostgreSQL
achieved better results in more complex joins. We
wanted to preserve the direction of the relationship in
Neo4j based on the data set. Therefore we had some
relationships in a different direction across our path.
We concluded that this inconsistency in path direction
led to slower performance. The results of J queries are
in Figure 1.
W4
W3
W2
W1
25
34.67
70.33
2,498
3.72
23.23
34.38
22,471
Neo4j PostgreSQL
Figure 2: Mean values of W queries (ms).
This set of queries was focused on the ability of ef-
fective search. PostgreSQL performance was overall
better. However, Neo4j was outperformed only by 36
ms. Neo4j performed W4 query in the ninth of Post-
greSQL time. These results showed that the direc-
tion of relationships, whether it comes from node A
to node B or vice-versa, has a large impact on the per-
formance of Neo4j, as shown in Figure 2. We would
recommend to carefully consider the creating direc-
tions of relationships based on the expected usage of
this graph database. There is also an option of cre-
ating two-way directions of relationships, but in that
case, there would be a greater sacrifice of disk space.
C3
C2
C1
128
2,303
48.33
87.18
1,039
21.86
Neo4j PostgreSQL
Figure 3: Mean values of C queries (ms).
The relational database performed better in C
queries. Results in Figure 3 have shown that the con-
tains function was used faster by PostgreSQL. Neo4j
needed twice the amount of time to finish the tasks
comparing to PostgreSQL. However, in the C1 and
C3 queries, Neo4j lost by 40 ms and 20 ms, which
again proved that Neo4j performs decently.
We concluded that PostgreSQL performed better
in our benchmarks than Neo4j. However, differences
of 20-40 ms between Neo4j and PostgreSQL times
proved that Neo4j could perform almost as well as
PostgreSQL on more relational-based data.
7 THREATS TO VALIDITY
This section discusses the construct validity, internal
validity, and external validity and its threats.
7.1 Construct Validity Threats
We are aware that the storage technique of graph
data that is used in Neo4j is not the only option for
graph databases. However, other open source graph
databases are less popular, less supported, and over-
all less mature (DB Engines Ranking, 2020). There-
fore it is very hard to run them in a cluster. Still, it
is desirable to test more methods of storage in graph
databases over the cluster in the future.
Another construct validity threat is the fact that
we used only one metric, which is the query response
time, to measure the suitability of graph databases.
IoTBDS 2020 - 5th International Conference on Internet of Things, Big Data and Security
218

We chose it is being emphasized as the most impor-
tant metric. However, in the future, measuring other
metrics, like throughput, memory usage, or processor
usage, may provide more detailed results. In prac-
tice, the requirements for a suitable database may dif-
fer and be much more complex.
The last construct validity concern we are aware
of is that there are many more query types that can be
executed on those databases to determine the suitabil-
ity of the graph database for a given Big Data prob-
lem. We believe that our paper will encourage others
to perform new tests, so the state of the art in sup-
porting the decision about the graph storage is further
expanded.
7.2 Internal Validity Threats
We are aware that the configuration of each bench-
marked database can affect the results of the exper-
iments. We have tried several configurations of each
one, and we believe that the chosen configurations are
designed for the best efficiency. An exhaustive search
of all configurations would be impractical.
However, it is worth considering that experiment-
ing with multiple configurations of the nodes in a
cluster may provide different results. Also, the re-
sults may vary when the database cluster contains a
different number of nodes.
7.3 External Validity Threats
The selection of the data set could also have an impact
on the results. We have on purpose chosen a large
graph data set that has multiple relationships, which
makes it a good candidate for our study. However,
more tests on different data sets should be done in the
future to make the results easier to generalize. Nev-
ertheless, we believe that our work provides a step
towards this goal.
8 CONCLUSION
In this paper, we designed and performed tests that
compare the Neo4j graph database to the PostgreSQL
non-graph database. Based on our knowledge, this is
the first work to compare the performance of graph
and non-graph databases in a cluster of computers.
We compared the execution times of these databases
for several non-trivial queries on a real data set. These
queries were performed on multiple levels of joins so
that we could check the border for which it is still ef-
ficient to use a graph database rather than a non-graph
database.
Our tests have shown that, for several cases, a
graph database can have similar performance as a re-
lational database in a cluster of three machines. We
have also found that there is a significant difference
in graph database performance between filtering val-
ues on nodes with direction heading out instead of in.
We provided recommendations for when to use the
graph database and show the results of performance
measurements of the chosen graph database and non-
graph database.
ACKNOWLEDGMENT
The work was supported from European Regional
Development Fund Project CERIT Scientific Cloud
(No. CZ.02.1.01/0.0/0.0/16 013/0001802). Access to
the CERIT-SC computing and storage facilities pro-
vided by the CERIT-SC Center, under the ”Projects
of Large Research, Development, and Innovations In-
frastructures” programme (CERIT Scientific Cloud
LM2015085), is greatly appreciated.
REFERENCES
Almabdy, S. (2018). Comparative analysis of relational and
graph databases for social networks. In 2018 1st In-
ternational Conference on Computer Applications In-
formation Security (ICCAIS), pages 1–4.
Chren, S., Rossi, B., Buhnova, B., and Pitner, T. (2018).
Reliability data for smart grids: Where the real data
can be found. In 2018 Smart City Symposium Prague
(SCSP), pages 1–6.
Ciglan, M., Averbuch, A., and Hluchy, L. (2012). Bench-
marking traversal operations over graph databases. In
2012 IEEE 28th International Conference on Data
Engineering Workshops, pages 186–189.
Corbellini, A., Mateos, C., Zunino, A., Godoy, D., and
Schiaffino, S. (2017). Persisting big-data: The nosql
landscape. Information Systems, 63:1 – 23.
DB Engines Ranking (2020). Db-engines
ranking of graph dbms. https://db-
engines.com/en/ranking/graph+dbms. Accessed:
2020-02-22.
Ding, P., Cheng, Y., Lu, W., Huang, H., and Du, X. (2019).
Which category is better: Benchmarking the rdbmss
and gdbmss. In Shao, J., Yiu, M. L., Toyoda, M.,
Zhang, D., Wang, W., and Cui, B., editors, Web and
Big Data, pages 207–215, Cham. Springer Interna-
tional Publishing.
Dominguez-Sal, D., Urb
´
on-Bayes, P., Gim
´
enez-Va
˜
n
´
o,
A., G
´
omez-Villamor, S., Mart
´
ınez-Baz
´
an, N., and
Larriba-Pey, J. L. (2010). Survey of graph database
performance on the hpc scalable graph analysis bench-
mark. In Shen, H. T., Pei, J.,
¨
Ozsu, M. T., Zou, L., Lu,
The Suitability of Graph Databases for Big Data Analysis: A Benchmark
219

J., Ling, T.-W., Yu, G., Zhuang, Y., and Shao, J., ed-
itors, Web-Age Information Management, pages 37–
48, Berlin, Heidelberg. Springer Berlin Heidelberg.
Gandini, A., Gribaudo, M., Knottenbelt, W. J., Osman, R.,
and Piazzolla, P. (2014). Performance evaluation of
nosql databases. In Horv
´
ath, A. and Wolter, K., edi-
tors, Computer Performance Engineering, pages 16–
29, Cham. Springer International Publishing.
Ge, M., Bangui, H., and Buhnova, B. (2018). Big data for
internet of things: A survey. Future Generation Com-
puter Systems, 87:601–614.
Gesvindr, D., Michalkova, J., and Buhnova, B. (2017).
System for collection and processing of smart home
sensor data. In 2017 IEEE International Conference
on Software Architecture Workshops (ICSAW), pages
247–250.
H Kamal, S., Elazhary, H., and E Hassanein, E. (2019). A
qualitative comparison of nosql data stores. Interna-
tional Journal of Advanced Computer Science and Ap-
plications, 10.
Joishi, J. and Sureka, A. (2017). Graph or relational
databases: A speed comparison for process mining al-
gorithm. CoRR, abs/1701.00072.
Jouili, S. and Vansteenberghe, V. (2013). An empirical
comparison of graph databases. In 2013 International
Conference on Social Computing, pages 708–715.
Kan, B., Zhu, W., Liu, G., Chen, X., Shi, D., and Yu,
W. (2017). Topology modeling and analysis of a
power grid network using a graph database. Interna-
tional Journal of Computational Intelligence Systems,
10(1):1355–1363.
Khan, W. and Shahzad, W. (2017). Predictive perfor-
mance comparison analysis of relational & nosql
graph databases. Int. J. Adv. Comput. Sci. Appl,
8:523–530.
Kolomi
ˇ
cenko, V., Svoboda, M., and Ml
´
ynkov
´
a, I. H. (2013).
Experimental comparison of graph databases. In Pro-
ceedings of International Conference on Information
Integration and Web-based Applications & Ser-
vices, IIWAS ’13, pages 115:115–115:124, New York,
NY, USA. ACM.
Makris, A., Tserpes, K., Andronikou, V., and Anagnos-
topoulos, D. (2016). A classification of nosql data
stores based on key design characteristics. Procedia
Computer Science, 97:94 – 103. 2nd International
Conference on Cloud Forward: From Distributed to
Complete Computing.
Miler, M., Odobasic, D., and Medak, D. (2014). The short-
est path algorithm performance comparison in graph
and relational database on a transportation network.
Promet - Traffic - Traffico, 26:75–82.
Nayak, A., Poriya, A., and Poojary, D. (2013). Article:
Type of nosql databases and its comparison with re-
lational databases. International Journal of Applied
Information Systems, 5(4):16–19. Published by Foun-
dation of Computer Science, New York, USA.
Oussous, A., Benjelloun, F.-Z., Ait Lahcen, A., and Belfkih,
S. (2015). Comparison and classification of nosql
databases for big data. In Proceedings of Interna-
tional Conference on Big Data Cloud and Applica-
tions, 2015.
Piro, G., Cianci, I., Grieco, L., Boggia, G., and Camarda,
P. (2014). Information centric services in smart cities.
Journal of Systems and Software, 88:169–188.
Rossi, B., Chren, S., Buhnova, B., and Pitner, T. (2016).
Anomaly detection in smart grid data: An expe-
rience report. In Systems, Man, and Cybernet-
ics (SMC), 2016 IEEE International Conference on,
pages 002313–002318. IEEE.
Sahatqija, K., Ajdari, J., Zenuni, X., Raufi, B., and Ismaili,
F. (2018). Comparison between relational and nosql
databases. In 2018 41st International Convention on
Information and Communication Technology, Elec-
tronics and Microelectronics (MIPRO), pages 0216–
0221.
Sharma, M., Sharma, V. D., and Bundele, M. M. (2018).
Performance analysis of rdbms and no sql databases:
Postgresql, mongodb and neo4j. In 2018 3rd Interna-
tional Conference and Workshops on Recent Advances
and Innovations in Engineering (ICRAIE), pages 1–5.
Sinha, A., Shen, Z., Song, Y., Ma, H., Eide, D., Hsu, B.-
J. P., and Wang, K. (2015). An overview of microsoft
academic service (mas) and applications. In Proceed-
ings of the 24th International Conference on World
Wide Web, WWW ’15 Companion, pages 243–246,
New York, NY, USA. ACM.
Swaminathan, S. N. and Elmasri, R. (2016). Quantita-
tive analysis of scalable nosql databases. In 2016
IEEE International Congress on Big Data (BigData
Congress), pages 323–326.
Tang, E. and Fan, Y. (2016). Performance comparison
between five nosql databases. In 2016 7th Interna-
tional Conference on Cloud Computing and Big Data
(CCBD), pages 105–109.
Vicknair, C., Macias, M., Zhao, Z., Nan, X., Chen, Y., and
Wilkins, D. (2010). A comparison of a graph database
and a relational database: A data provenance perspec-
tive. In Proceedings of the 48th Annual Southeast
Regional Conference, ACM SE ’10, pages 42:1–42:6,
New York, NY, USA. ACM.
Walletzky, L., Buhnova, B., and Carrubbo, L. (2018).
Value-driven conceptualization of services in the
smart city: a layered approach. In Social Dynamics
in a Systems Perspective 2018, pages 85–98. Springer.
IoTBDS 2020 - 5th International Conference on Internet of Things, Big Data and Security
220
