
Playing the Role of Co-designers on Mobile PWAs: An Investigation of
End-Users Interaction
Giulia de Andrade Cardieri
a
and Luciana A. M. Zaina
b
Federal University of S˜ao Carlos, Sorocaba, S˜ao Paulo, Brazil
Keywords:
Progressive Web Apps, End-User Development, Experimental Study, Mobile Apps.
Abstract:
Progressive Web App (PWA) is a new approach that combines technology resources of both web and native
apps. End-User Development (EUD) is an approach from which end-users participate actively in a system’s
design process. PWAs are a recent technology and the impacts of associating EUD and PWAs have been
little exploited. To cover this gap, we proposed the PWA-EU approach in previous work. In this paper, we
present an investigation about end-users interactions when they act as co-designers on PWAs. We built a
mobile app based on the PWA-EU approach and conducted a study with 18 participants with eight acting as
co-designers of the app, and ten interacting as non-designers. We carried out a qualitative analysis from the
participants’ interaction focusing on the breakdowns communication and user experience (UX) of the partici-
pants. Our gathered evidence points out that even acting as co-designers participants still have communication
breakdowns. Moreover, those who acted as co-designs had a more satisfying experience than those who did
not.
1 INTRODUCTION
The use of mobile devices to access the internet is
more popular around the globe than the use of desk-
tops (Comscore, 2017). Mobile devices are consid-
ered part of individuals’ daily activities which include
access to different information systems such as on-
line banking, e-learning systems and so on (Casadei
et al., 2017). Designers and developers must con-
sider browsers and device limitations when working
with mobile or web apps. With those limitations in
mind, the need for adapting interfaces on different
screen sizes, resources, and dimensions becomes rel-
evant (Bueno and Zaina, 2017; Gull`a et al., 2015).
Responsive Web Design (RWD) arose as a popu-
lar solution to user interface (UI) adaptation for mo-
bile web apps (Marcotte, 2011). From the RWD ap-
proach, the interface adaptation runs automatically by
considering the device screen width, orientation, and
platform by CSS media queries (Bryant and Jones,
2012).
Progressive Web App (PWA) is proposed by
Google in 2015. It combines both web and native
apps technology resources. Initially, PWAs are pre-
sented as RWD mobile apps which after continuous
a
https://orcid.org/0000-0002-5537-1592
b
https://orcid.org/0000-0002-1736-544X
user interactions, progressively become more com-
plete and similar to the natives (Petele, 2016). This
feature provides an adaptive nature to PWAs since
their UIs get more complete according to the growth
of user interactions.
Considering end-users side, end-user develop-
ment (EUD) focuses on allowing users who are not
primarily interested in software to create, modify and
extend a system according to their needs. Meta-
design is a EUD approach in which the end-user can
participate actively in application development and is
not restricted to its use (Fischer, 2009).
The adaptive nature of PWAs brings great poten-
tial to be associated with meta-design since both ap-
proaches allow apps to become more complete while
the user builds a relationship with it. Due to that, the
aim of this paper was to investigate the issues and
the UX of end-users when they act as co-designers
on PWAs. We called co-designers individuals that
can change the user interface design on the app run-
time. To conduct our investigation, we defined two
research questions (RQs): (i) Which communication
breakdowns come up when users play the role of co-
designers in a PWA?” and (ii) How are users’ percep-
tion of UX when interacting as co-designers?.
The traditional PWA approach was not prepared to
allow end-users to make their own preferences option.
476
Cardieri, G. and Zaina, L.
Playing the Role of Co-designers on Mobile PWAs: An Investigation of End-Users Interaction.
DOI: 10.5220/0009350804760486
In Proceedings of the 22nd International Conference on Enterprise Information Systems (ICEIS 2020) - Volume 2, pages 476-486
ISBN: 978-989-758-423-7
Copyright
c
2020 by SCITEPRESS – Science and Technology Publications, Lda. All rights reserved

Taking into account this limitation we proposed the
PWA-EU approach (Cardieri and Zaina, 2019). Our
proposal is an extension of the traditional PWA archi-
tecture that includes meta-design in a way that users
can include their preferences to adapt interfaces on
run-time. Another motivation for the PWA-EU pro-
posal is the small number of studies on PWAs, espe-
cially when we consider the user perspective. Con-
sidering the aim of this paper, we built a mobile app
based on the PWA-EU approach to be used in our
study. We conducted a study with 18 participants, in
which eight acted as co-designers of the app, which
means they selected their preferences in order to cus-
tomize the PWA’s appearance, and ten interacted as
non-designers. We carried out a qualitative analysis
of recordings collected from the participants’ interac-
tion. We also analyzed the participants’ perceptions
of their experience with the approach.
The main contribution of our work is how the
communication breakdowns that can affect the expe-
rience of end-users when they act as co-designers. As
far as we know, this kind of investigation is the first
one in the literature. Our findings can aid developers
in the creation of apps more self-guided from which
end-users can perform the role of co-designers. Be-
sides, our paper presents all the steps of a robust quali-
tative study in detail. This rich description of the qual-
itative study can be seen as an important academic
contribution by itself so it allows other researchers to
replicate the same study.
The rest of the paper is organized as follows: Sec-
tion 2 presents the fundamentals and related work;
the PWA we developed to our study is presented in
Section 3; the details of our study are discussed in
Section 4 and its results are in follow Section 5; in
Section 6 we return to our research questions to point
out the important results and make a comparison with
the literature as well as presents the limitations of our
study; and finally Section 7 discusses the conclusion
and future work.
2 BACKGROUND
2.1 PWA-EU Approach
We adopted PWA-EU to conduct our study. We have
proposed it in a previous work (Cardieri and Zaina,
2019). To provide a better understanding, we will
explain the approach briefly. PWA-EU approach is
an extension of the PWA architecture in which users’
preferences are taken into account on the interface
adaptation at run-time. Developers and designers
should follow the architectural proposal to construct
apps from which end-users can modify the interface
in accordance with their preferences. The conception
initial steps of design is not a part of our proposal.
Rather than use methodologies such as user-centered
design or design thinking (Sharp et al., 2019), PWA-
EU provides a software architecture that allows in-
cluding features in the apps from which the end-user
can act as a co-designer.
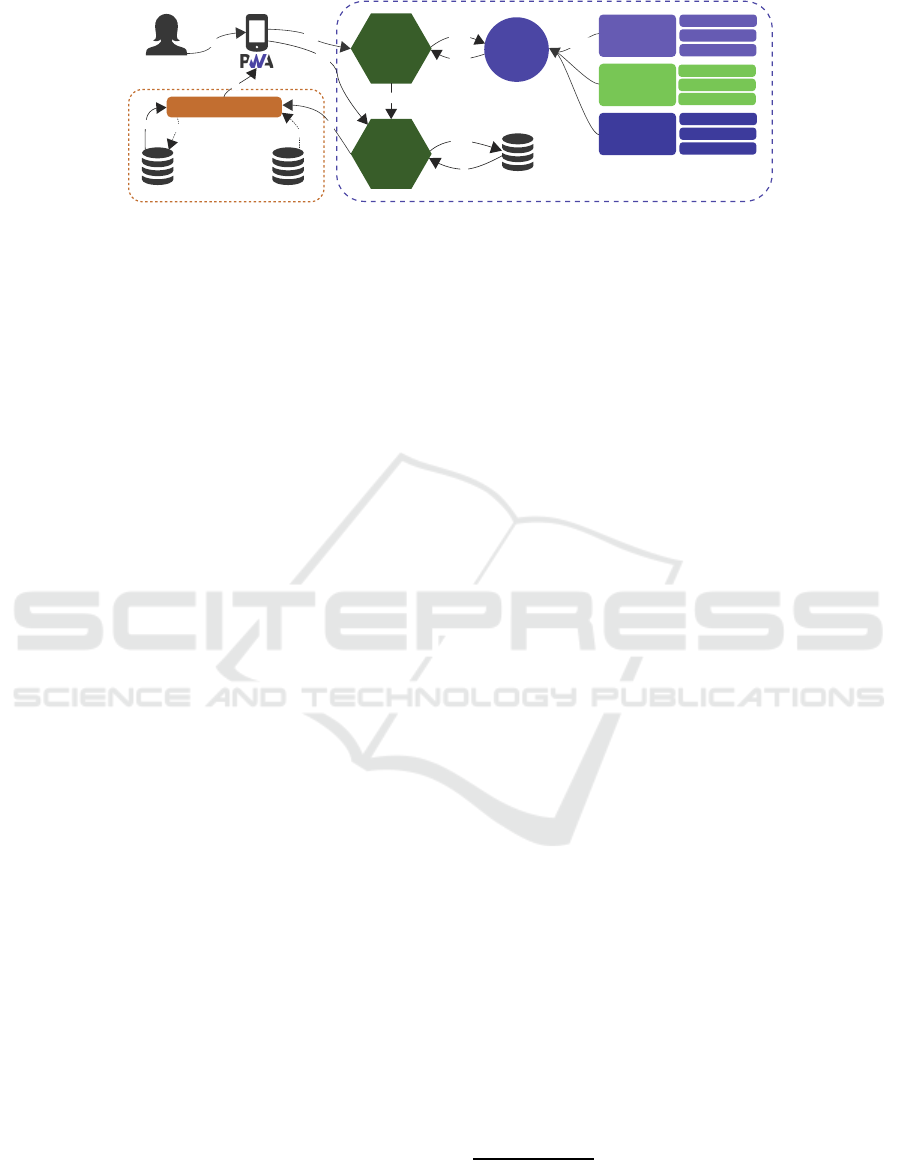
Looking at Figure 1, we see on the left side the
traditional PWA is shown while our extension is on
the right side.
The User Design Model (UDM) (A) establishes
and combines different User App Preferences (E),
some examples are UI elements appearance, inter-
action methods, and content display formats such as
data and images. The User App Preferences are con-
nected to the app domain. For instance, on a PWA in
which end-users create lists, their preferences could
be linked to how each list element is displayed. More-
over, the relation between the app and User App Pref-
erences should be previouslydefined by designers and
developers. These preferences have default settings
and follow meta-design principles, in which users can
change their preferences. Developers must select a
technology to store these preferences.
The Management Layer (B) is responsible for
including, editing and deleting the User App Prefer-
ences on the UDM. It can receive two different re-
quests from the PWA:(i) receiving and sending mod-
ifications to the UDM, and (ii) for sending an up-
dated UDM to the Connection Layer. The Connec-
tion Layer (C) has three functions: (i) sending the
UDM to be stored, (ii) retrieving the UDM from the
storage, and (iii) sending the latest UDM to the Adap-
tation Engine. The first scenario only occurs when the
UDM was updated by the user on the Management
Layer. The other scenarios happen when is necessary
to load a new UI on the PWA, which can occur when a
new UDM preference is set or when the user is brows-
ing through the app. The Adaptation Engine is the
link between the PWA-EU and the traditional PWA
architecture. It takes into account the UDM User App
Preferences to alter the app UI. Moreover, this engine
should store the app UI on cache memory and recover
it when necessary. We defined the PWA-EU archi-
tecture into these three elements and the connection
with the Adaptation Engine following an adaptation
of the event-driven and the layered architectures for
software development (Richards, 2015). The event-
driven part is relevant since the PWA-EU architecture
depends on events triggered by users, such as modi-
fying the UDM or loading a new UI.
With regards to EUD, PWA-EU is based on the
guidelines presented in the meta-design framework
Playing the Role of Co-designers on Mobile PWAs: An Investigation of End-Users Interaction
477
User
...
Interface
Elements
Interacon
Methods
Datepicker
Select
Images
Content
Display
Format
Lists
Cards
Voice
Movements
...
User App Preferences (E)
User
Design
Model (A)
Modified PWA approach considering user preferences
Storage System (D)
Management
Layer (B)
Connecon
Layer (C)
2a.2
2a.4
2a.1
2a.3
2a.5
3
2a
2b
1
Adaptaon Engine (F)
HTML, CSS and JSHTML, CSS and JS
Tradional PWA approach
Cache (H) Web Host (G)
7
6
5
8
4
Figure 1: PWA-EU approach.
proposed by Fisher, Nakakoji & Ye (2009) as de-
scribed in the following: Support Human-problem In-
teraction - Designers and developers should analyze
the app domain and its end-users. After this analysis,
the User App Preferences are defined and included as
part of PWA-EU’s UDM. Underdesign for Emergent
Behaviour - A PWA developed with PWA-EU has de-
fault options before the end-user initial interaction.
Due to that, the design of the app is not complete be-
fore end-users modified the default options by select-
ing their preferences on the UDM. Moreover, a new
design behavioris generated by architectural elements
every time the user changes their User App Prefer-
ences on the app. Share Control - Designers and de-
velopers are the original meta-designers who define
multiple User App Preferences during development.
At run time, the control of these preferences, that
affect app’s functionalities and appearance, is trans-
ferred to end-users who are acting as co-designers.
2.2 Related Work
As PWA is a recent technology, there are not many
works related to it. Biørn-Hansen et al. propose a
technical comparison between PWA, Native, Hybrid,
and Interpreted apps and concluded there is poten-
tial to PWAs unify web and native development with-
out the need of cross-platform frameworks (Biørn-
Hansen et al., 2017). Sharma et al. discusses the def-
inition of PWAs and compares their performance to
native and hybrid apps (Sharma et al., 2019). In our
previous paper (Cardieri and Zaina, 2018), we con-
ducted a UX-based comparison between PWA, Native
and Web apps, finding out that all three approaches
provided a satisfying experience to end-users. We
could not find works in the PWA field that take both
interface adaption or EUD into account. In contrast,
there are many works on interface adaption for mobile
apps, and on EUD (Bueno and Zaina, 2017; Manca
et al., 2013; Ghiani et al., 2014; Gull`a et al., 2015).
Danado & Patern´o proposes Puzzle, a framework
in which end-users with no programming experience
can develop or customize complex mobile apps and
connect their apps to web services and smart devices
(Danado and Patern`o, 2014). Costabile et al. propose
a EUD desktop app based on the software shaping
workshop (SSW) method in which a meta-design par-
ticipatory approach is adopted during the entire soft-
ware life cycle (Costabile et al., 2008). Namoun et
al. (2016) propose a model linking the features of
performing EUD in mobile devices to end-users’ at-
titudes towards and intent of doing this. In the stud-
ies, the authors considered participants with experi-
ence or not on EUD in mobile. The results show
that rather than creating apps the end-users have more
interest in customizing apps to improve their experi-
ence. Nonetheless, these works do not take PWA and
interface adaptation into account.
3 DEVELOPING A PWA-EU APP
A Calendar app following the PWA-EU approach
was developed to support our study (App available
at https://h1eneas.dlvr.cloud/). Calendar is a PWA
that allows users to manage events and their time (i.e.
event name, date, location, category, start, and end
time). Calendar was chosen because it represents a
common-sense domain avoiding the need for users to
learn about the app domain. To build the Calendar,
we considered the most popular frameworks in web
mobile app design, such as Bootstrap
1
and Material-
ize
2
. As PWA is a Google proposal based on Material
Design, we chose Materialize as the default design
for Calendar’s UI elements. Material Design consists
of guidelines, components, and tools that support the
best practices of UI design available as open-source
code (Clifton, 2015). We chose Vue.js
3
to develop
the front-end because it has a fast learning curve, its
applications are smaller to store when compared to
the other frameworks, it is easy to use in projects
1
https://getbootstrap.com/
2
http://materializecss.com
3
https://vuejs.org/
ICEIS 2020 - 22nd International Conference on Enterprise Information Systems
478

and availability of an official Vue.js PWA template
4
(Sheppard, 2017) (Rojas, 2020).
At the start we set up the User App Preferences
(see Fig 1). After conducting an investigation on
the Material Design guide and considering the na-
ture of the app (i.e. Calendar), we decided to cover
five UI elements: calendar, checkbox, input, select
and timepicker. We also introduced a second op-
tion in which users acting as co-designers could se-
lect. For each element, users acting as co-designers
could choose between a Material Design element
and a browser-default appearance as part of the User
App Preferences of the UDM. A browser-default look
changes according to the device and browser the user
is accessing. For instance, the input from Safari Mo-
bile for iOS shows a vertical scroll for the day, month
and year, while on Chrome Mobile for Android it dis-
plays a pop-up calendar.
Gestures and voice Interaction Methods (see Fig
1) were available. The swipe gesture was selected due
to some Material Design components recommending
its use, such as lists and cards. The voice synthe-
sis and speech recognition were included considering
they became a standard feature on smartphones (Cor-
bett and Weber, 2016). Complementing the User App
Preferences, Content Display Formats were selected
to provide users with distinct ways to read the infor-
mation on the app. Following Material Design guide-
lines, we defined that users can choose between list
and card formats to display data, besides showing or
hiding images on the cards.
Each architectural element from PWA-EU and
the Adaptation Engine are represented on the Calen-
dar app. All three PWA-EU architectural elements
(UDM, Management, and Connection Layers) are de-
fined in the My Design section. In this section, partic-
ipants could select and edit their user app preferences.
While the UDM’s values were visually represented
by My Design’s UI, the Connection and Management
Layers were built as sets of JS functions. Connection
Layer’s functions store and retrieve data from Local-
Storage and the Management Layer’s code changes
the values of user app preferences on the UDM. On
the other hand, the Adaptation Engine is formed by
multiple CSS and JS files that modify user app pref-
erences on Home and Include New Event sections.
4 EXPERIMENTAL STUDY
In next section we describe the planning, conduction
and analysis our study guided by (Lazar et al., 2017).
4
https://github.com/vuejs-templates/pwa
4.1 Planning
Participants were invited to take part in the study vol-
untarily via social networks like Twitter and Face-
book. The participants were selected by convenience,
according to their availability to take part in the study
(Lazar et al., 2017). We obtained two distinct groups
of participants who were separated based on their aca-
demic and professional experience (Namoun et al.,
2016). One group had participants from the technol-
ogy field (i.e. developers and designers), we named
tech, and the other had participants from other pro-
fessional and academic fields, we named non-tech.
This separation avoids that only individuals with pre-
vious knowledge on UI design or development acted
as co-designers and indicates whether or not a differ-
ence stands between end-users co-designers who have
a technical profile and those who do not have.
We selected the Communicability Evaluation
Method (CEM) (Leit˜ao and Souza, 2009) to conduct
our study and guide our analysis of communication
breakdowns (RQ1). We used the method to separate
into codes the recurring issues and interactions re-
garding users’ communication breakdown situations.
CEM is a semiotic engineering-based method that
aims to explore communication breakdowns between
the designed system and the user through the observa-
tion of how a group of users interacts with a particular
system. Considering that in our study part of the users
are also the designers (i.e. co-designers), these break-
downs can point out whether these individuals’ roles
as co-designers lead to more satisfying interactions,
and understand if even acting as co-designers users
still have communication breakdowns.
Moreover, we took the Self Assessment Manikin
(SAM) (Bradley and Lang, 1994) to collect the par-
ticipants’ experience after their interactions with the
application (RQ2). SAM is a pictograph evaluation
method to measure emotional responses from some
sort of stimulus. Three dimensions are considered by
this technique: pleasure (if the participant had a pos-
itive or negative reaction), arousal (body stimulation
level from an event or object) and dominance (feeling
in control of the situation or controlled by it). The
user chooses a value on a scale of one to nine on each
dimension, using images, to represent their emotions
after interactions. Participants answered questions re-
garding SAM after each task. Furthermore, when all
tasks were accomplished we conducted an interview
with four questions to have a broader comprehension
of the end-users’ perspective.
A pilot test was carried out with two participants.
We concluded that no changes were necessary and the
study could be run.
Playing the Role of Co-designers on Mobile PWAs: An Investigation of End-Users Interaction
479

4.2 Conduction
The study was conducted over four days in Soro-
caba, S˜ao Paulo, Brazil. We had a total of 20 partic-
ipants who were between 18 and 59 years old, me-
dian 23 years old. Most participants were under-
graduate students or had a degree. All participants
accepted the term of consent about the use of data
and images for academic ends. Besides the techni-
cal profile separation (see Planning section), half of
the participants were randomly selected and named
co-designers due to having an active participation in
the setting of the UI design, by selecting their pref-
erences and customizing the app’s design. The other
ten participants interacted only with features that did
not make changes on the UI and were named non-
designers.
The participants’ observation took place individ-
ually and the researcher made notes regarding each
communication breakdown. Initially, each participant
received instructions about Calendar and the conduc-
tion of the study. For the co-designers, three tasks
were proposed. The tasks were specified as follow:
Task 0 - Co-designers - participants could set the
UDM by selecting their preferences regarding UI el-
ements, interaction methods, and display format op-
tions; Task 1 - Include events - participants included
two new events on the app; and Task 2 - Browse
events - Participants canceled and marked as finished
the previous included events. Non-designers run only
Task 1 and Task 2.
Only the description of the current task was dis-
played in text format on a laptop screen. We did
not introduce a time limit to the participants accom-
plished the tasks. All the participants used the same
mobile device, a Motorola Moto G4 Play running An-
droid 8.1. This avoided that differences in Android
operating system versions could introduce bias on in-
teraction data. The participants’ interactions with the
PWA were recorded by using DU Recorder
5
, installed
on the mobile device. In addition, the participants’ fa-
cial expressions and voice were captured by a laptop
camera placed in front of the participant. The think-
aloud protocol (Sharp et al., 2019) was adopted to
provide a better understanding of user interaction and
to assist the application of the CEM method. This
protocol requires users to speak their thoughts dur-
ing their interactions. Following the CEM method,
we prepared a semi-structured interview that asked a
question about the difficulties the participants had in
using the app.
5
http:/www.duapps.com/product/du-recorder.html
4.3 Analysis
The analysis was conducted by crossing-over four
data sources (i.e. SAM questionnaire, video record-
ings, screen recordings, and the main researcher’s
notes). Approximately, we collected five hours of
video recordings from user interactions on the mo-
bile device and recordings of user’s faces, and around
two hours of audio from the interviews. During a
pre-analysis of all video and audio recordings, two
samples were discarded. These participants were co-
designers, from both tech and non-tech groups, who
did not complete Task 0. In the end, we had 18 par-
ticipants, from which eight acted as co-designers and
the others as non-designers. Due to the sample size of
18 participants, we decided not to conduct an inferen-
tial statistical analysis. We carried out three rounds of
analysis with at least two cycles of data exploration
for each one. In the first cycle, the first author of this
paper explores the data, and after, in the next cycle,
the first and second authors together revised, refined,
and consolidated the outcomes.
In the first round of analysis, the videos contain-
ing the users’ interactions on apps and facial expres-
sions were put together on the same video aiming to
enable easier and more precise identification of each
evidence of a communication breakdown. For this,
we used the iMovie Software
6
. Regarding the inter-
view, we transcribed to text all conversationsrecorded
on audio between the users and the researcher. After
all the videos were combined, we started CEM’s tag-
ging step. The first author of this paper watched all
video recordings twice, took notes of when, why and
where it occurred, and assigned a tag when a com-
munication breakdown was identified. A spreadsheet
was used to support all the analysis. We used the 13
tags proposed by the CEM method (Leit˜ao and Souza,
2009). These tags are natural language expressions
commonly found in human communications, which
the participants might utter during the thinking aloud
process.
In the second round, the chunks that were tagged
were revisited for the identification of the main com-
munication breakdowns. Each tag was listed and
analyzed in two perspectives: (i) the frequency and
context of occurrence which was identified by list-
ing when, where and the probable reason each tag oc-
curred, and (ii) the existence of pattern in sequences
of tag types, such as grouping tags connected to the
similar communication breakdowns on multiple or
single participants. In each step of tagging, the first
author conducted a double-checking of the results.
In the third round, we did a crossing-over among
6
https://www.apple.com/imovie/
ICEIS 2020 - 22nd International Conference on Enterprise Information Systems
480

the issues that have caused the observed breakdowns,
with the participants’ profile, SAM answers, record-
ings and interview data.
5 FINDINGS
We organized our findings in two subsections consid-
ering the two RQs we should answer. Table 1 will
support us in our discussion regarding our findings.
It shows the profile data of the participants and their
SAM feedback.
5.1 Communication Breakdowns
We analyzed the communication breakdowns that
were caused by the co-designers choices because only
these participants interfered with the app’s design.
These are problems influenced by the user prefer-
ences selected when participants were acting as co-
designers. Moreover, we counted seven communica-
tion breakdowns which came up from five participants
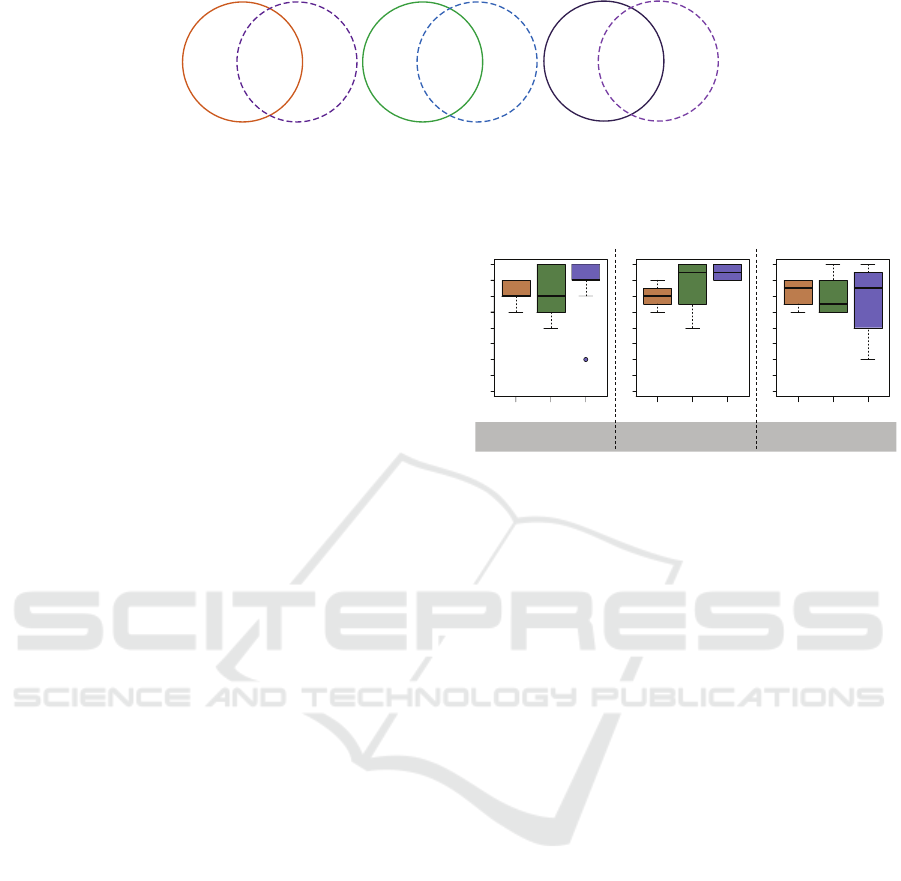
on a total of eight co-designers. The breakdownswere
categorized into four of the 13 tags (identified by let-
ter T) provided by CEM. Figure 2 shows the tags that
represent the breakdowns that arose when the users
were interacting with the Calendar app. The right-
most diagram indicates which breakdowns also oc-
curred as a consequence of co-designer actions. Fol-
lowing we concentrated on discussing the tags from
the third diagram. The other breakdowns are out of
the scope of this work due to they are related exclu-
sively to UI elements and technological expertise is-
sues.
T6 - What happened? tag is identified when
users repeat an operation because they could not see
or understand the effects of their actions. We saw ev-
idence of T6 from [P4] interaction on Task 2. Playing
the role of co-designer (i.e. performing Task 0), [P4]
changed the default design of content display format
(see the content display format on Fig 1) from card
to list. Explaining the preference after the execution
of Task 0, [P4] said: “I prefer the list rather than
card viewing...it shows the same data but allows me
to see more data at the same time”. Additionally, the
list format changed how the cancel and finish buttons
were displayed in a way the buttons contained only
symbols (i.e. an X and a checkmark, respectively)
representing the actions instead of the text format
from when the card format was selected. While per-
forming Task 2 [P4] was not sure which button can-
celed an event. After a time of hesitation, [P4] pressed
the cancel button and the app displayed a modal win-
dow requesting the participant to confirm the action.
Rather than confirming the cancellation, [P4] closed
the modal and reopened it right away, this time con-
firming the action. In the interview [P4] stated “That
was very practical, I just tested it once to be sure I
was clicking on the correct button”.
T8 - Where am I tag represents the communica-
tion breakdown when a user did not find a particular
feature by pausing and searching it. T8 was identi-
fied on [P8]’s interactions on Task 2, who likewise
[P4] selected the list as default content display for-
mat. Commenting on the selection, [P8] said: “It’s
an advantage as is faster to check events using the list
format”. Nonetheless, [P8] was insecure about which
button would perform the action to mark an event as
finished, as the buttons had only symbols and not text.
S/he stated: “Mark the event as finished? ... Let me
click here ... oh, ok! .. Yay!”. By analyzing this snip-
pet, we noticed that initially s/he was not sure which
UI element would perform this action. Yet, [P8] fig-
ured it out in a few seconds and explained this break-
down over interview “I didn’t realize the finalize but-
ton was there, I initially tried to click over the list”.
However, a couple of minutes after this statement [P8]
recalled this issue affirming “Finalizing an event was
easy.”.
The T9 - Oops tag occurs when a user momentar-
ily makes a mistake and immediately corrects it. S/he
sees that s/he has made a wrong step and usually ac-
tivates the “undo” function immediately. This break-
down was identified on [P7]’s interactions on Task 2,
a tech co-designer. Resembling [P4] and [P8], [P7]
selected the list as the preferred content display for-
mat on Task 0. S/he stated: “I prefer the list because
it fits more data onto the screen, it’s very clear and
not cramped.”. Yet, s/he had issues to understand the
difference between cancel and mark as finished but-
tons. While trying to finish an event, [P7] spoke “The
button is asking me if I want to finish an event... I
don’t want to finish .. wait? Is it the same thing?...
finish an event, ok.”. By [P7]’s speech, we observe a
misunderstanding regarding the verbs cancel and fin-
ish. Over the interview, s/he explained: “The action
buttons were not clear, I understand one of them is
positive and the other is negative. Still, the message
was very similar in both actions”.
On the T13 - Why doesn’t it? tag, the user is
trying to make sense of the designer message by re-
peating the steps of previous unsuccessful commu-
nication in order to find out what went wrong. The
issue experienced by [P7] in the previous paragraph
is also connected to T13. On Task 2, [P7] repeated
the ‘mark as finished task’ until s/he understood the
difference between this and the cancel action. Ad-
ditionally, T13 also occurred with two other partici-
Playing the Role of Co-designers on Mobile PWAs: An Investigation of End-Users Interaction
481
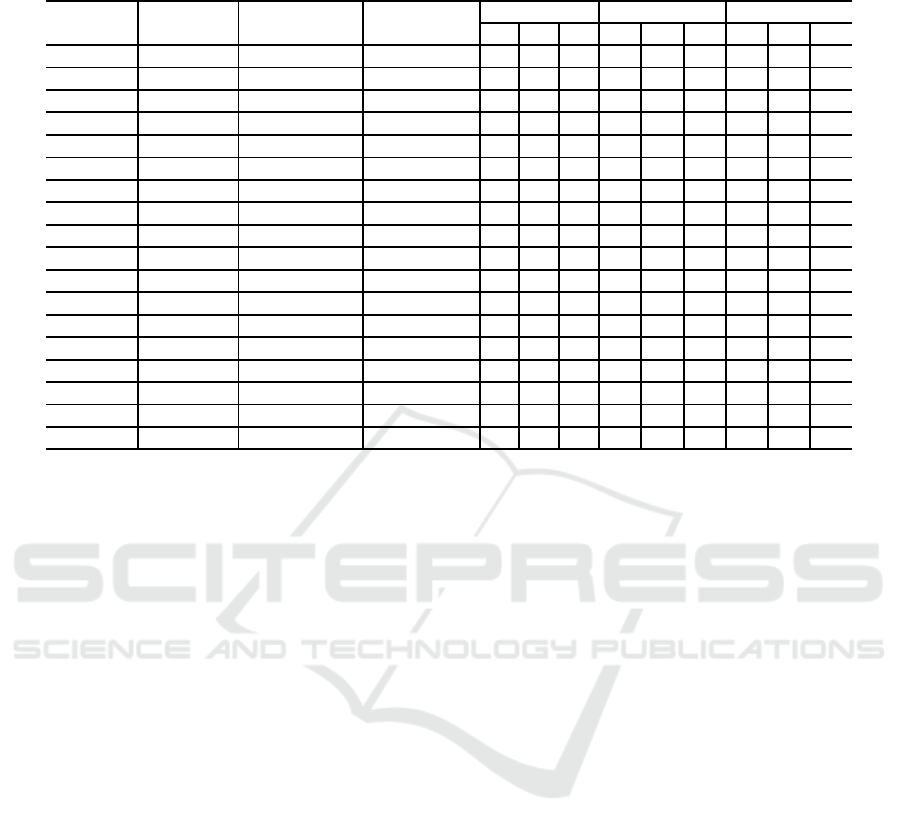
Table 1: Participants’ profile: P/A Experience - Professional/Academic Experience, and SAM results: PI - Pleasure Index, AI
- Arousal Index, DI - Dominance Index.
Participant Group Technical Profile P/A Experience
Task 0 Task 1 Task 2
PI AI DI PI AI DI PI AI DI
P1 Co-designer Non-tech 2-4 years 8 7 9 9 9 9 9 9 9
P2 Co-designer Non-tech N/A 7 6 8 9 8 8,5 9 9 9
P3 Co-designer Tech 5 years or more 8 9 9 7,5 7,5 8,5 9 9 9
P4 Co-designer Non-tech 1-2 years 6 6 3 8 8,5 8,5 8 8 7,5
P5 Co-designer Non-tech Less than a year 8 9 7 9 9 9 9 9 9
P6 Co-designer Tech 2-4 years 7 9 8 8 9 8 8 9 7
P7 Co-designer Tech 2-4 years 6 8 8 5,5 5,5 6,5 5,5 4 5,5
P8 Co-designer Tech 5 years or more 7 5 9 9 9 7,5 9 9 9
P9 Non-designer Non-tech 5 years or more - - - 9 9 9 9 9 9
P10 Non-designer Non-tech 2-4 years - - - 8,5 9 8,5 9 9 9
P11 Non-designer Non-tech 5 years or more - - - 7,5 7,5 7,5 9 8 9
P12 Non-designer Tech 5 years or more - - - 7,5 8,5 9 9 9 9
P13 Non-designer Non-tech 1-2 years - - - 7 7,5 6,5 7 9 6
P14 Non-designer Tech 5 years or more - - - 7,5 9 9 8 9 9
P15 Non-designer Tech 1-2 years - - - 7 8,5 7,5 7,5 8,5 7,5
P16 Non-designer Non-tech 1-2 years - - - 7,5 7,5 8 9 9 9
P17 Non-designer Tech 5 years or more - - - 7 8 5 5 7,5 3,5
P18 Non-designer Tech 5 years or more - - - 8 9 8 8,5 8 9
pants on Task 1, in which participants had to include
an event. [P1] and [P2], co-designers from the non-
tech group, selected the Materialize’s datepicker in-
stead of the browser-default. The default behavior of
Materialize’s datepicker displays the current day with
a distinct font color that led participants to believe a
date was selected. Still, in order to choose a date,
users had to touch over a day and it would acquire a
different background color. This behavior is a feature
from Materialize, which is not considered a design er-
ror by the library. Both participants did not comment
on why they selected this datepicker instead of the
second option, which did not present this behavior.
Yet, [P1] explained “I did not enjoy the datepicker
because instead of performing two commands I wish
I could complete it in one.”. Conversely, [P2] did not
state difficulties. Other three participants selected this
datepicker, [P3] from the tech and [P4], [P5] from
the non-tech group. However, [P4] had the same
breakdown with the Materialize UI element on Task
0, which lead him/her to select the other datepicker
option.
As Materialize’s datepicker was the default on the
Calendar app, we can compare the T13 breakdown
with the non-designers. For non-designers, four (P11,
P13, P15, and P17) of the ten participants experienced
a similar issue. Two (P15 and P17) of these four
were from the tech group. This comparison points
out that even people who are acquainted with tech-
nology may have issues understanding Materialize’s
datepicker behavior. Most co-designers from the tech
group selected the second option, which displays a UI
element associated to the browser.
Even though three participants (P4, P8, and P7)
had distinct issues related to the list and action but-
tons on Task 2, two other tech participants, [P3] and
[P6], also selected the list as their content display for-
mat preference. Both [P3] and [P6] did not experi-
ence breakdowns, instead, both stated in the interview
that the action buttons were very clear. As the list
was not available as content display format for partic-
ipants who did not act as co-designers, we could not
make a relation with the non-designers participants.
Further, we looked at the results of the interview.
One question asked whether the co-designersfelt they
had better interactions due to their design choices. Six
from eight participants felt positive about this ques-
tion, [P8] felt neutral and [P2] disagreed. [P2] stated
“The choices don’t change a lot of things”. Yet, s/he
was a non-tech participant with initial difficulties in
understanding how the design options would be later
applied. The tech participant [P8] said the choices did
not interfere with posterior interactions. The other six
participants explained the preferences selection made
the navigation easier and more pleasant to interact.
Some examples are “The app was more pleasant as it
identifies with your choices.”[P3]; and “The app gets
easier to interact”[P4].
ICEIS 2020 - 22nd International Conference on Enterprise Information Systems
482
Co-designers
Non-designers
T12
T6
T13
T9
T8
T5
T3
T2
T7
T10
Tech
Non-Tech
T6
T10
T13
T9
T8
T12
T3
T7
T2
T5
TechNon-Tech
T13
T6
T8
T9
Only Co-designers
Figure 2: Participants communication breakdown tags divided by co-designers/non-designers, tech/non-tech and co-designers
from both tech/non-tech.
5.2 UX Perception
Our discussion on UX perception is performed on a
holistic overview throughout the interpretation of the
users’ feedback from SAM. Table 1 summarizes the
SAM dimensions and the participants’ responses per
task. When we look at participants’ results divided by
their technical profile, we notice a contrast between
them. Hence, Figure 3 shows a comparison of both
groups on the co-designers’ feedback on Task 0. Fur-
ther, the SAM medians for co-designers are higher
on Task 1 in which interactions with UI elements are
linked to user app preferences. Yet, there were no
differences in the SAM values for Task 2, as users’
choices were not as visible as Task 1.
By associating the results of Table 1, Figure 3 and
taking into account all the co-designers (i.e. tech and
non-tech), we see an outlier regarding dominance in-
dex. This is a consequence of [P4] having selected
value 3 for this index. By checking the videos of the
participants’ interactions, we noticed that three non-
tech users (i.e. [P2], [P4] and [P5]) had difficulties
in understanding how to initiate Task 0 and were con-
fused about their role as co-designers. Yet, they were
having doubts about why and how their preferences
would affect their interactions. [P4], for instance, was
browsing through the design options for a minute and
asked the researcher for help: “I can’t understand
what I should do here”. On top of that, [P2] had ques-
tions about the consequences of the changes: “Where
can I see this element if I choose it?”. Moreover, [P5]
said: “But how do I know what is the difference be-
tween this or that checkbox?”. Briefly, the researcher
answered all the questions and the participants had no
further issues regarding their initial difficulties. Even
though [P4]’s SAM values appear as outliers when
we take all co-designers into account, his/her dom-
inance index value is not an outlier when we focus
only on non-tech participants. As pointed out in Fig-
ure 3, non-tech individuals who took the role of co-
designers selected lower values on arousal and domi-
nance SAM dimensions, which might be the cause of
this remark.
[P2], [P5] and [P7] had difficulties in acting as co-
All
PI DIAI PI DIAI PI DIAI
Tech Non-tech
1 2 3 4 5 6 7 8 9
1 2 3 4 5 6 7 8 9
1 2 3 4 5 6 7 8 9
Task 0
Figure 3: UX perception of with Task 0.
designers. However, they struggle more on choices of
interaction methods (see interaction methods on Fig
1). Both from the non-tech group, [P2] and [P5] asked
the researcher for help, and [P2] stated: “This speech
recognition, what does it specifically do?”. Still,
[P2] was confused about other design choices such
as swipe movement and the datepicker. In both situ-
ations, the researcher gave a brief explanation about
what the design choices meant and participants con-
tinued their tasks. Yet, the tech group participant [P7]
stated that “I don’t like to use voice, I don’t like voice
synthesis or speech recognition ... I don’t understand
why both methods are separated, but it’s fine”. This
issue could also be one of the causes of [P2] having at-
tributed lower valuesfor pleasure and arousal indexes.
On the other hand, [P5] selected high values for both
pleasure and arousal indexes. As the only represen-
tative of the tech group, [P7] selected 6 for pleasure
index. However, [P7] chose high values for the other
SAM indexes pointing out that the issue did not affect
the experience.
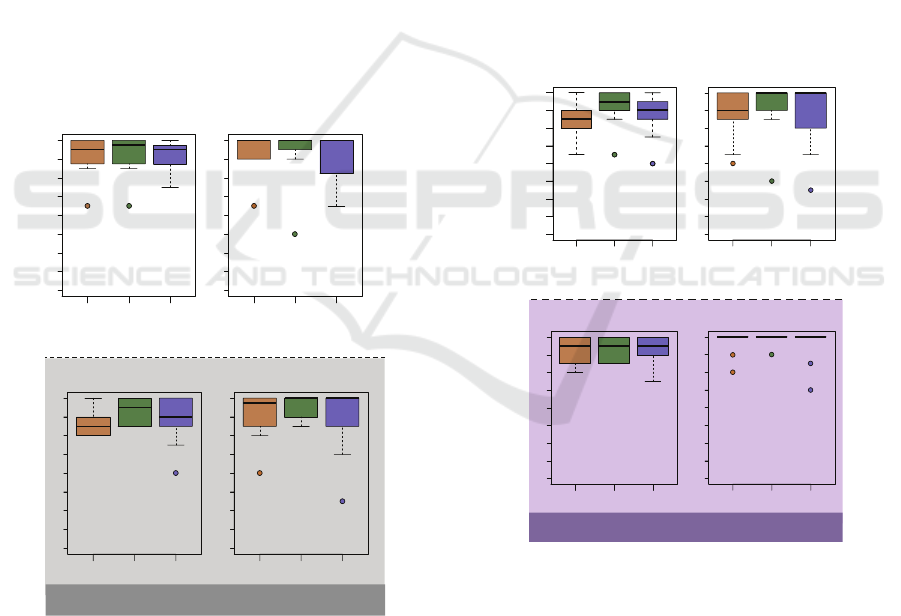
By observing Figures 4 and 5, we see the homo-
geneous feedback of the participants independently of
the task and their group. Task 1 boxplots show out-
liers linked to [P7] and [P16]. Both participants are
from the tech group, yet, [P7] was a co-designer and
[P16] was not. Comparing the data from both CEM
and SAM methods, we found out that [P7] and [P16]
had a common issue that was also experienced by
[P1], [P2], and [P3]. The issue came up during the use
of timepicker element, in which they had to include
an event with a specific time slot. Actually, all the
participants had some kind of difficulty while select-
Playing the Role of Co-designers on Mobile PWAs: An Investigation of End-Users Interaction
483
ing a precise time slot. We noticed this issue on both
timepicker options, materialize and web pattern. Dur-
ing the interview, [P16] related issues regarding the
timepicker’s accuracy: “It’s nice to have a timepicker
that spins to a precise time, but I had many difficulties
trying to select both zeros from 15:00. I’m not sure
if it is too accurate or not accurate at all”. No other
participants commented on this issue. Taking a look
at SAM indexes of [P1], [P2] and [P3], we notice that
this issue did not affect their UX. Nonetheless, [P3]
had lower values when compared to [P1] and [P2].
The results showed that this barrier has affected only
the SAM indexes of the tech participants.
The issue related to the datepicker described in the
previous subsection affected only part of the partici-
pants. When we observe [P1] and [P2] SAM results,
we notice they did not select lower indexes on Task 1.
The non-designers (i.e. P11, P13, P15, and P17) who
had this issue selected lower values on SAM indexes
for Task 1. This points out that the co-designers’ ex-
perience was not affected by this breakdown, yet, the
non-designers had a less satisfactory experience.
Co-designers
Non-designers
1 2 3 4 5 6 7 8 9
PI DIAI PI DIAI
PI DIAI PI DIAI
1 2 3 4 5 6 7 8 9
1 2 3 4 5 6 7 8 9
1 2 3 4 5 6 7 8 9
Task 1 Task 2
Task 1 Task 2
Figure 4: Boxplots with SAM results categorized by partic-
ipants role.
Also connected to the communication breakdowns,
the issue regarding the list UI element did affect co-
designers UX. In Figures 4 and 5, we see the out-
liers in the boxplots of co-designers (pleasure and
arousal indexes) and of techs (arousal index) group
from Task 2. Besides that, all of SAM indexes of [P4]
are pointed out as outliers on the non-tech boxplot.
Yet, the values from [P4] did not come as outliers on
the co-designers boxplot. The experience reported by
[P8] showed the communication breakdown s/he has
faced did not bring consequences to his/her experi-
ence due to SAM values are high.
The other two outliers on Task 2 for pleasure and
dominance indexes were found from [P12] feedback
when seeing as the non-tech participant. His/her is-
sues are related to his/her own expectations regard-
ing the app (i.e. s/he wished a specific functional-
ity existed), not their UI elements or the PWA-EU
approach. Instead, the lower values arose when the
participant wanted extra functionality on the app in
which the finished and canceled events could be re-
stored. [P12] stated: “Wow, the event I marked as
finished just vanishes? I’m sad”. Likewise, [P12] and
[P16] outliers presented in Task 2 for pleasure and
dominance indexes on both non-designers and tech
boxplots are linked to the same expectation.
1 2 3 4 5 6 7 8 9
1 2 3 4 5 6 7 8 9
1 2 3 4 5 6 7 8 9
1 2 3 4 5 6 7 8 9
Non-Tech
Tech
Task 1
PI DIAI PI DIAI
PI DIAI PI DIAI
Task 2
Task 1 Task 2
Figure 5: Boxplots with SAM results categorized by partic-
ipants experience.
6 DISCUSSION AND STUDY
LIMITATIONS
Considering the communication breakdowns results,
we answer the RQ1 “Which communication break-
downs come up when users play the role of co-
designers in a PWA?”. Even when users acted as
co-designers they experienced communication break-
ICEIS 2020 - 22nd International Conference on Enterprise Information Systems
484

downs. This remark is affected by users’ technical
background, such as programmers and designers who
are used to building and designing applications. Tech
participants had fewer breakdowns as they had more
expertise in the behavior and functionality of differ-
ent UI elements than non-tech ones. Although EUD
brings interest and motivation to non-tech end-users,
their lack of technical skills makes them not engage
as co-designers (Namoun et al., 2016).
Supporting by SAM results we can answer RQ2
“How are users’ perception of UX when interact-
ing as co-designers?”. By playing the role of co-
designers the participants had a more positive per-
ception as their active participation in the app design
could improve their experience. This remark could be
noticed especially in the pleasure index. When con-
sidering the technical profile, the tech group demon-
strate less satisfaction than the non-tech. However,
while playing the role of co-designers the non-tech
individuals felt less dominant and aroused compar-
ing to the tech ones. Technical issues can introduce
situational limitations to non-tech end-users (Casadei
et al., 2017). These limitations are any kind of prob-
lem that comes up from environmental characteris-
tics and may jeopardize the UX (Henry et al., 2014).
One important motivation for end-users engaging in
EUD actions is the improvements that it can bring to
their experience (Fischer et al., 2017). Yet, one of
the biggest challenges to overcome is to simultane-
ously give end-users the empowerment of designing
apps and provide ways to support them with how to
do EUD (Namoun et al., 2016). In order to provide
more guidance, we could establish guidelines for the
development of the PWA-EU.
Since most issues pointed out in the results are
related to three UI elements (datepicker, timepicker,
and list), we can discuss if the identified breakdowns
are connected to the interaction with UI elements. As
reported in our previous paper (Cardieri and Zaina,
2018), despite bringing satisfaction, datepickers can
cause confusion and frustration on PWA users. More-
over, users have issues while including data via forms
on mobile apps as these elements have not changed
much since their first design. Finally, lists seem like a
practical design for users, yet it raises serious acces-
sibility concerns (Casadei et al., 2017). Still, likewise
our previous study (Cardieri and Zaina, 2018), par-
ticipants achieved a satisfying UX even with issues
when interacting with the UI elements.
We took different actions as the sample of our
work can be considered a limitation (i.e. 18 partic-
ipants). First, we adopted four distinct data sources
that allowed us to triangulate data that provides re-
liability to the analysis. Yet, we assured all partici-
pants used the same mobile device in order to avoid
bias which could be caused by different Android ver-
sions. We also explored the data on distinct lenses
(i.e. SAM and CEM) and consequently getting rich
discussions of the results. We ensured all selected
participants were frequent users of mobile devices in
order to avoid problems related to the interaction with
the mobile platform. Still, our work is limited to the
use of certain UI elements, which were part of the
user app preferences and are connected to the user’s
experience, as pointed out in the discussion.
7 CONCLUSION AND FUTURE
WORK
This paper presented an investigation about end-users
acting as co-designers on PWAs. The findings re-
vealed that individuals with technology background
were less satisfied, but felt more dominant when act-
ing as co-designers. Conversely, grouping partici-
pants as those who acted as co-designers and the
ones who did not, we noticed the co-designers group
had more satisfying interactions on the posterior task
when compared to the ones who did not include their
preferences into the PWA.
Our work contributes to the discussion of how
end-users could activelyparticipate in the design. The
results show that there are some difficulties in playing
the role of co-designers and these can have a direct
impact on the overall UX. Working on more guided
mobile apps could be a start point for achieving an in-
clusive environmentfor end-users. We also present an
important discussion regarding the potential of com-
bining PWAs and EUD. PWA-EU could be seen as a
contribution for developers of apps in the sense it ar-
ranges the responsibilities from the architectural per-
spective of the application.
As future work, first, we intend to refine the PWA-
EU approach by adding recommendations on how de-
velopers can provide more guidance during interac-
tion and consequently support end-users in their role
of co-designers. For instance, only after the user in-
teracts with a user app preference (i.e. a UI element)
the different preference options are displayed. Fur-
ther, the app section in which the user can select their
preferences is progressivelybuilt according to user in-
teractions.
Playing the Role of Co-designers on Mobile PWAs: An Investigation of End-Users Interaction
485

ACKNOWLEDGMENTS
This study was financed in part by the Coordenac¸˜ao
de Aperfeic¸oamento de Pessoal de N´ıvel Superior -
Brasil (CAPES) - Finance Code 001.
REFERENCES
Biørn-Hansen, A., Majchrzak, T. A., and Grønli, T.-M.
(2017). Progressive Web Apps: The Possible Web-
native Unifier for Mobile Development. Proceedings
of the 13th Int. Conf. on Web Inform. Sys. and Tech.,
(Webist):344–351.
Bradley, M. and Lang, P. J. (1994). Measuring Emotion:
The Self-Assessment Manikin and the Semantic Dif-
ferential. Journal of Behavior Therapy and Experi-
mental Psychiatry, 25(1):49–59.
Bryant, J. and Jones, M. (2012). Responsive Web Design. In
Pro HTML5 Performance, volume 67. Apress, Berke-
ley, CA.
Bueno, D. C. and Zaina, L. M. (2017). HyMobWeb : A
hybrid adaptation of context-sensitive Web interfaces
with multimodality support in mobile devices. SBC
Journal on Interactive Systems.
Cardieri, G. A. and Zaina, L. A. M. (2019). PWA-EU: Ex-
tending PWA approach for promoting customization
based on user preferences. Proc. ACM Hum.-Comput.
Interact., 3(EICS).
Cardieri, G. A. and Zaina, L. M. (2018). Analyzing User
Experience in Mobile Web, Native and Progressive
Web Applications: A User and HCI Specialist Per-
spectives. In Proceedings of the 17th Brazilian Sym-
posium on Human Factors in Comp. Sys., IHC 2018,
pages 9:1–9:11.
Casadei, V., Granollers, T., and Zaina, L. (2017). Investigat-
ing accessibility issues of UI mobile design patterns
in online communities: A virtual ethnographic study.
In Proceedings of the XVI Brazilian Symp. on Human
Factors in Comp. Sys., IHC 2017, pages 33:1–33:10.
Clifton, I. G. (2015). Android User Interface Design: Im-
plementing Material Design for Developers. Addison-
Wesley Professional.
Comscore (2017). The global mobile report. http://bit.ly/
2ST47kf. Last checked on Nov 12, 2018.
Corbett, E. and Weber, A. (2016). What can I say?: Ad-
dressing user experience challenges of a mobile voice
user interface for accessibility. In Proceedings of the
18th Int. Conf. on HCI Interaction with Mobile De-
vices and Services, MobileHCI ’16, pages 72–82.
Costabile, M. F., Mussio, P., Parasiliti Provenza, L., and
Piccinno, A. (2008). End users as unwitting software
developers. In Proceedings of the 4th Int. Workshop
on End-user Soft. Engn - WEUSE ’08, pages 6–10.
Danado, J. and Patern`o, F. (2014). Puzzle: A mobile
application development environment using a jigsaw
metaphor. Journal of Visual Languages and Comp.,
25(4):297–315.
Fischer, G. (2009). End-user development and meta-design:
Foundations for cultures of participation. Lecture
Notes in Computer Science (including subseries Lec-
ture Notes in Artificial Intelligence and Lecture Notes
in Bioinformatics), 5435 LNCS:3–14.
Fischer, G., Fogli, D., and Piccinno, A. (2017). Revisiting
and broadening the meta-design framework for end-
user development. In New Perspectives in End-User
Development, pages 61–98. Springer, Cham.
Ghiani, G., Manca, M., Patern`o, F., and Porta, C. (2014).
Beyond responsive design: Context-dependent mul-
timodal augmentation of web applications. In 11th
Int. Conf. on Mobile Web and Intelligent Inform. Sys.
- MobiWis’14, volume 8640 LNCS, pages 71–85.
Gull`a, F., Ceccacci, S., Germani, M., and Cavalieri, L.
(2015). Design Adaptable and Adaptive User Inter-
faces: A Method to Manage the Information. In
Biosystems & Biorobotics, volume 11, pages 47–58.
Springer Internatinal Publishing.
Henry, S. L., Abou-Zahra, S., and Brewer, J. (2014). The
role of accessibility in a universal web. In Proceedings
of the 11th Web for All Conf., W4A ’14, pages 17:1–
17:4.
Lazar, J., Feng, J. H., and Hochheiser, H. (2017). Research
Methods in Human-Computer Interaction. 2 edition.
Leit˜ao, C. F. and Souza, C. S. (2009). Semiotic Engineering
Methods for Scientific Research in HCI. Morgan &
Claypool.
Manca, M., Patern`o, F., Santoro, C., and Spano, L. D.
(2013). Generation of multi-device adaptive multi-
modal web applications. In 10th Int. Conf. on Mobile
Web and Intelligent Inform. Sys. - MobiWis’13, vol-
ume 8093 LNCS, pages 218–232.
Marcotte, E. (2011). Responsive web design, a book apart.
http://bit.ly/32p3zFY. Last checked on Oct 30, 2017.
Namoun, A., Daskalopoulou, A., Mehandjiev, N., and Xun,
Z. (2016). Exploring mobile end user development:
Existing use and design factors. IEEE Transactions
on Software Engineering, 42(10):960–976.
Petele (2016). Your first progressive web app. http://bit.ly/
3c5JlFI. Last checked on Sept 26, 2017.
Richards, M. (2015). Software Architecture Patterns.
O’Reilly Media.
Rojas, C. (2020). Making your first progressive web app.
In Building Progressive Web Applications with Vue.
js, pages 1–46. Springer.
Sharma, V., Verma, R., Pathak, V., Paliwal, M., and Jain,
P. (2019). Progressive Web App (PWA) - One Stop
Solution for All Application Development Across All
Platforms. Int.Journal of Scientific Research in Comp.
Sci., Eng. and Inform. Tech., 5(2):1120–1122.
Sharp, H., Preece, J., and Rogers, Y. (2019). Interaction
Design-beyond human-computer interaction. John
Wiley & Sons.
Sheppard, D. (2017). Beginning progressive web app devel-
opment creating a native app experience on the web.
Apress.
ICEIS 2020 - 22nd International Conference on Enterprise Information Systems
486
