
Occupancy Grid Map Generation from OSM Indoor Data for Indoor
Positioning Applications
Thomas Graichen
a
, Rebecca Schmidt
b
, Julia Richter
c
and Ulrich Heinkel
d
Professorship Circuit and System Design, Chemnitz University of Technology, Reichenhainer Straße 70, Chemnitz, Germany
Keywords:
Occupancy Grid Maps, OpenStreetMap, Indoor Maps, Indoor Localisation.
Abstract:
In recent years, there is a growing interest in indoor positioning due to the increasing amount of applications
that employ position data. Current approaches determining the location of objects in indoor environments
are facing problems with the accuracy of the sensor data used for positioning. A solution to compensate
inaccurate and unreliable sensor data is to include further information about the objects to be positioned
and about the environment into the positioning algorithm. For this purpose, occupancy grid maps (OGMs)
can be used to correct such noisy data by modelling the occupancy probability of objects being at a certain
location in a specific environment. In that way, improbable sensor measurements can be corrected. Previous
approaches, however, have focussed only on OGM generation for outdoor environments or require manual
steps. There remains need for research examining the automatic generation of OGMs from detailed indoor
map data. Therefore, our study proposes an algorithm for automated OGM generation using crowd-sourced
OpenStreetMap indoor data. Our experiments with nine different building map datasets demonstrate that the
proposed method provides reliable OGM outputs. The proposed algorithm now enables the integration of
environmental information into positioning algorithms to finally increase the accuracy of indoor positioning
applications.
1 INTRODUCTION
Indoor positioning has received much attention in re-
cent years due to the vast amount of applications that
employ position data. Indoor positioning is the pro-
cess of determining the location of objects in indoor
environments. Positioning systems are applied to lo-
calise and track assets in production buildings, to nav-
igate persons through indoor environments or to anal-
yse a person’s trajectory in elderly care applications,
for example. Such systems use different types of
technologies, such as inertial sensors, visual mark-
ers, cameras, time of flight (ToF) sensors, or Wi-Fi-
based technologies. All these localisation techniques
have different disadvantages in indoor environments,
which lead to inaccurate localisation results. Wi-Fi
signals, for instance, can be interfered by metallic ob-
jects, ToF-based approaches require a line of sight
and inertial sensor data is prone to error accumula-
tion. Even technologies such as ultra-wideband sys-
a
https://orcid.org/0000-0003-1861-6033
b
https://orcid.org/0000-0002-9249-3812
c
https://orcid.org/0000-0001-7313-3013
d
https://orcid.org/0000-0002-0729-6030
tems with a theoretically achievable accuracy of 10
cm can be influenced by the environment, so that the
positioning error reaches values of up to 3 m. As a
consequence, the acquired sensor data can be inaccu-
rate and unreliable, which results in invalid localisa-
tions, such as persons detected within a wall.
In order to compensate localisation errors, it is
necessary to include further information about the ob-
ject to be positioned and about the environment into
the positioning algorithm. One possibility to improve
the localisation accuracy is the integration of indoor
map data: the given structure of buildings with its spe-
cific spacial dimensions, such as corridors, stairways
and doors, allows an elimination of invalid positions.
Moreover, by considering the structure of indoor en-
vironments, both probable and improbable object oc-
currences can be defined. A person walking through a
building will probably not walk directly near the wall
and will definitely not pass through a wall. An incor-
rectly acquired position within a wall could then be
adjusted to a valid position next to the wall. Meth-
ods that are implementing such position corrections
are described in Section 2. The described example is
visualised in Figure 1.
168
Graichen, T., Schmidt, R., Richter, J. and Heinkel, U.
Occupancy Grid Map Generation from OSM Indoor Data for Indoor Positioning Applications.
DOI: 10.5220/0009348501680174
In Proceedings of the 6th International Conference on Geographical Information Systems Theory, Applications and Management (GISTAM 2020), pages 168-174
ISBN: 978-989-758-425-1
Copyright
c
2020 by SCITEPRESS – Science and Technology Publications, Lda. All rights reserved

Corridor
Room
Room
Room
Room
Figure 1: Localisation Example: Correction of Incorrect
Sensor Data by including Information about Indoor Envi-
ronment. The Blue and Grey Dots Indicate Sensor Measure-
ments Whereas Grey Dots Correspond to Invalid Positions,
E. G. within a Wall, That Can Be Adjusted to a Correct Po-
sition Indicated by Green.
The occurrence probability of a specific object within
a building can be modelled by means of so-called
occupancy grid maps (OGMs), which represent the
occupancy probability of an object on the floor plan
of a building. The OGM is modelled by a cell ma-
trix whereas each cell is a square area of the indoor
environment holding the probability of being occu-
pied. Hence, generating OGMs requires floor plans
and consequently indoor data of buildings. Since in-
door data about building had either been generally not
available or is only provided in form of Computer
Aided Design (CAD) formats, an alternative data
source was created by the OpenStreetMap (OSM)
community: indoor map data has been collected by
volunteers and now provides detailed crowd-sourced
information about the structure of buildings. These
mapping activities have been being increased in re-
cent years and have led to a wider availability of in-
door data. An overview of mapped data is listed in the
OSM Wiki (OSM-Community, 2020).
To date, little attention has been paid to the in-
volvement of OSM indoor data in OGM generation.
This paper therefore examines OSM indoor map data
as a data source for the generation of OGMs and in-
troduces a procedure to create such OGMs as an input
for indoor positioning algorithms.
The paper is structured as follows: Section 2
presents state-of-the-art methods for OGM generation
and outlines the research gap. Thereupon, Section 3
introduces the proposed procedure to generate OGMs
from OSM indoor data by illustrating the system con-
cept overview and subsequently describing the real-
isation of the single system modules. The obtained
results are presented and discussed in Section 4. Fi-
nally, Section 5 concludes the paper and gives an out-
look on future work.
2 RELATED WORK
Occupancy grid mapping was initially introduced
by Moravec and Elfes in 1985 (Moravec and Elfes,
1985). Originally, this mapping procedure was de-
veloped for noisy sonars and called “mapping with
known poses”. In literature, especially in the field
of probabilistic robotics, occupancy grid mapping is
often referred to as the process of generating maps
from noisy and uncertain sensor data while the po-
sition of the robot with the attached sensors such as
cameras, laser range scanners and LIDAR is known
(Matthies and Elfes, 1988), (Konolige, 1997), (Thrun,
2001). In this mapping problem, the aim is to build an
occupancy map of the environment, in which the oc-
currence of obstacles is stored.
For positioning/localisation, the opposite prob-
lem has to be solved: Based on an existing map, the
position of objects shall be derived, also in the pres-
ence of noisy sensor data. In our case, the existing
map is an OSM indoor map that has to be transformed
in an occupancy grid map first. In this context, OGM
generation is the transform of a floor plan into in-
dependent discrete cells. Each cell stores a variable
estimating the grade of its occupancy. The variable
can either be binary or continuous, stating whether the
cell is occupied or not or indicating the grade of oc-
cupancy, i. e. the occupancy probability of the object
to be localised.
Extant literature gives insight on how OSM maps
are transferred to OGMs and thereafter used for local-
isation purposes.
In their publications, Kurdej et al. present a local-
isation system for intelligent vehicles that uses OSM
outdoor map data as a-priori information (Kurdej,
2015), (Kurdej et al., 2012). This systems generates
OGMs based on OSM road and building information
and matches sensor data from optical sensors against
these OGMs.
Herrera et al. are the first to generate OGMs from
OSM indoor maps (Herrera et al., 2013), (Herrera
et al., 2014). Their algorithm derives the OGMs from
a manually defined graph network that overlays the
indoor map data. This graph consists of nodes, which
were defined by empirical studies and denote proba-
ble indoor positions. However, these nodes have to be
manually added to the graph.
Naik et al. proposed OSM-based indoor data for
robot navigation and generated a primitive OGM
for that purpose (Naik et al., 2019). This genera-
tion methodology involves only a limited set of ob-
jects, namely information about rooms and corridors.
Moreover, the OGM distinguishes between only two
occupancy states.
Occupancy Grid Map Generation from OSM Indoor Data for Indoor Positioning Applications
169
Step 1:
Coordinate
System
Transformation
OSM
Indoor Map Data
in WGS 84
Indoor Map Data
in OGM
Coordinates
Step 2:
Map Data
Sorting
Ordered Indoor
Map Data
Step 3:
OGM
Rendering
OGM
OGM Resolution
Local Coordinate
System (Origin
and Orientation)
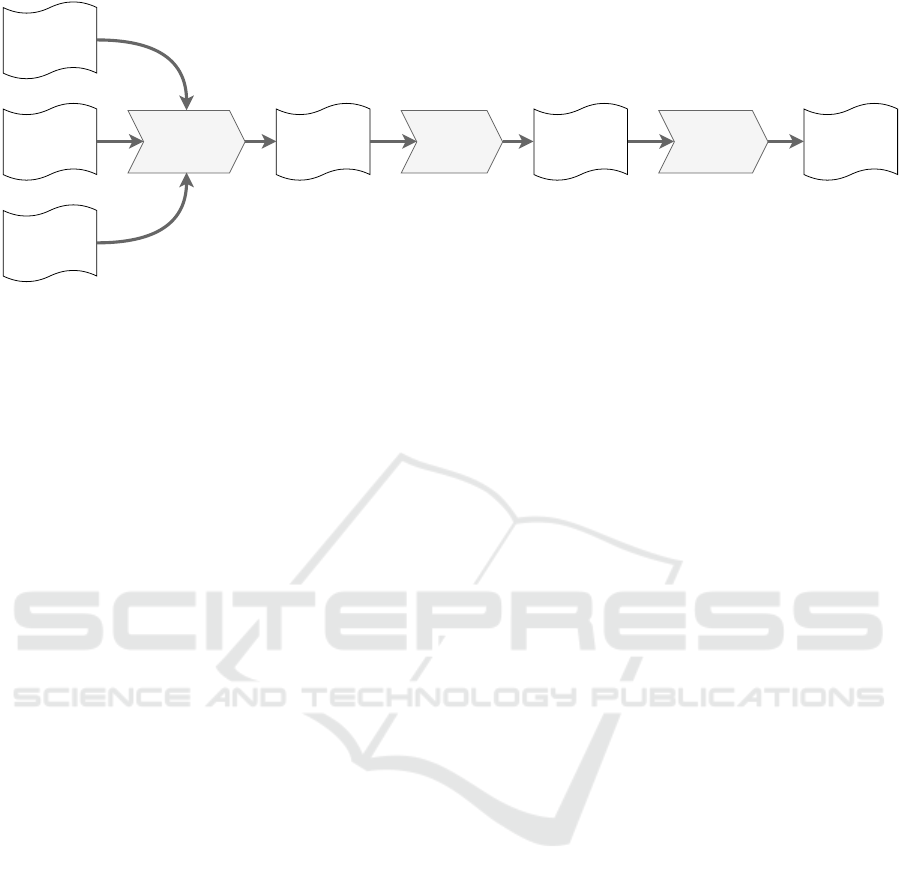
Figure 2: Concept Overview: The Algorithm for OGM Generation Is Divided into Three Main Steps.
To summarise, the presented related work either fo-
cusses on OSM outdoor data or is lacking a full au-
tomation of the OGM generation and is only cover-
ing a small part of building features. Therefore, we
propose a methodology for a highly automated gen-
eration of OGMs based on OSM indoor maps that is
involving as much as possible information about the
interior of a building.
3 METHODOLOGY
This section first provides an overview about the al-
gorithm with its single steps and thereafter explains
the realisation of every step as well as the input and
the output data in detail.
3.1 Concept Overview
Our proposed algorithm for OGM generation is di-
vided into three steps: coordinate transformation, data
sorting and OGM rendering, as can be seen in Fig-
ure 2.
In the first step, the input OSM map data, which
is represented in WGS-84 (World Geodetic System
1984) format has to be transformed into OGM co-
ordinates. Therefore, the coordinates of the indoor
map data are firstly converted to a metric representa-
tion and to a local coordinate system (LCS) that, to-
gether with its origin and orientation, has to be de-
fined depending on the specific positioning applica-
tion that will use the OGMs. This transformation is
necessary to represent all objects, i. e. both objects
from the OSM map as well as objects to be located,
in the same local and metric coordinate system. A
transformation of indoor data into local metric format
brings the benefit of compatibility to other devices.
Other devices might be industrial robots also work-
ing with a local metric coordinate system or devices
processing a given grid map. Afterwards, a transfor-
mation from the metric LCS in OGM coordinates is
applied based on a manually defined OGM resolution.
Thereby, the OGM coordinates represent the cell in-
dices of the OGM.
During map data sorting, all indoor map objects
are assigned to a specific priority level that corre-
sponds to a layer in the rendering process, where the
OGM is rendered layer by layer in a fixed order. This
assignment is based on the OSM tags of each geo ob-
ject. For the OGM rendering, we defined a certain
order in a lookup table to achieve sensible OGM out-
puts. This is necessary, because geo objects within
OSM data sets may be overlapping. For instance,
room areas and their walls are described by two sepa-
rate geo objects, whereas the mapped area of the room
may be overlapping with its mapped walls. At this
point, the OSM mapping scheme considers walls as
a second layer over room areas, so that the mapped
wall boundaries define the real-world physical walls
above underlying room areas. Now consider an ex-
emplary rendering output of unsorted data: Rendering
the walls of a room before rendering its area would
lead to a loss of wall position information due to the
”over-rendering” of walls by the room area. This ex-
ample illustrates the necessity of a sensible data sort-
ing in accordance with OSM mapping schemes. Next
to the chronological order objects will be rendered,
the layer specifies the occupancy probability for ob-
jects in that level, and the shape the object will be
rendered with.
Finally, the OGM is built by rendering the map
objects that were assigned to the specific layers with
their according probabilities.
GISTAM 2020 - 6th International Conference on Geographical Information Systems Theory, Applications and Management
170
3.2 Realisation
3.2.1 Input Data
The algorithm requires three sets of input informa-
tion: The OSM indoor map data, the origin of the lo-
cal coordinate system and the desired grid map reso-
lution. The OSM indoor map data is stored within an
XML (Extensible Markup Language) file including
indoor geo objects, such as rooms, walls, doors and
corridors, characterised by a set of nodes with longi-
tude and latitude coordinates as well as by OSM tags,
which are describing the meaning of each object.
The second required information are the position
and orientation of the LCS. The position consists of
a WGS-84 coordinate (latitude and longitude) and
the orientation is defined by the rotation angle be-
tween the ordinate of the WGS-84 coordinate sys-
tem and the ordinate of the LCS. The origin of the
LCS as well as the rotation angle can be set by us-
ing the JOSM (Java-OpenStreetMap)-Editor (OSM-
Community, 2019a) with measurement functionali-
ties provided by plug-ins (OSM-Community, 2019b).
The grid maps resolution is the third input data of
this algorithm and it is specified in pixels per meter
(px/m). This resolution is used for the conversion of
geo object positions to the OGM coordinate system,
which is using pixels as units.
The described input data is parsed at the initiali-
sation of the algorithm and stored in an internal data
structure for further processing in the following com-
puting steps.
3.2.2 Step 1: Coordinate System Transformation
Because indoor positioning systems are comprised of
several system components with their own single co-
ordinate systems, it is necessary that all the different
components share the same local coordinate system
in the overall indoor positioning application. Such
components can be different kind of sensors, robots
or algorithms that further process positioning data.
For OGM generation, the input data needs to be
transformed into OGM coordinates, which then rep-
resent the originally metric dimensions of an indoor
environment in OGM pixel coordinates, as already
outlined in Figure 2. By means of a geographic li-
brary (Karney, 2013), (Karney, 2019), the indoor map
coordinates will be transferred from WGS-84 format
into a metric coordinate system by solving the in-
verse geodesic problem, which determines the short-
est route between two points on the surface of the
Earth. Thereby, the results are the metric distance
components on the latitude and longitude arc ∆x
ω
and
∆y
ω
between the origin of the LCS as well as a node
of a geo object at the position (x
L1
,y
L1
). Afterwards
the rotation angle α of the LCS is applied to finally
transform ∆x
ω
and ∆y
ω
into local x and y coordinates.
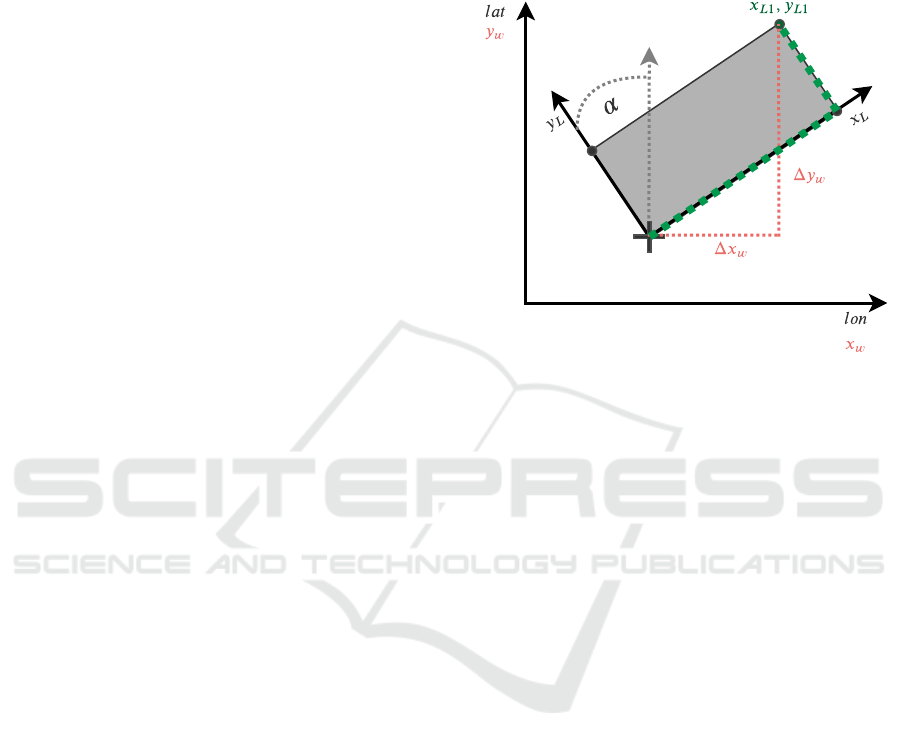
Figure 3 visualises this coordinate system transforma-
tion.
Geo Object
LCS
Origin
Figure 3: Transformation of a Geo Object at Position
(X
l1
,Y
l1
) given in WGS-84 Coordinates to a Metric LCS.
∆x
ω
and ∆y
ω
Represent the Distance Components on the
Latitude and Longitude Arc between the Origin of the LCS
and a Geo Object. α Is the Rotation Angle between the
WGS-84 Coordinate System and the LCS.
Finally, the map data in LCS coordinates is trans-
formed in OGM coordinates. This is achieved by
manually defining the resolution of the OGM in pix-
els per meter (px/m) and afterwards multiplying each
LCS coordinate with this resolution value to obtain
rounded OGM coordinates in Pixels (px). The choice
of the resolution depends on the accuracy of the posi-
tioning system, whose results shall be improved. For
instance, an UWB system with an accuracy of 20 cm
can use an OGM with a resolution of 5 px/m.
3.2.3 Step 2: Map Data Sorting
As already described in Section 3.1, an ordered map
data set is necessary for generating an OGM with a
layer-wise rendering methodology that also involves
over-rendering. Though, due to the structure of the
OSM data definition, the geo objects within the in-
door map data are unsorted and might be overlapping.
Therefore, a lookup table that assigns relevant tags of
the geo objects to a specific rendering layer was cre-
ated. This lookup table is shown in Figure 4.
The first rendering layer (L1) holds basic indoor
geo objects with the lowest limitations for position-
able objects, such as rooms, corridors, steps, stair-
ways or elevators. In that sense, lowest limitations
refers to the highest probability for a valid indoor po-
Occupancy Grid Map Generation from OSM Indoor Data for Indoor Positioning Applications
171
LayerLookup-Table
L1 Rooms,Corridors,Steps,Elevators, etc.
L2 Walls
L3 Openings: Doors, Entrances, etc.
Figure 4: Lookup Table to Assign Geo Objects by Means
of Their Application-Relevant Tags to a Specific Rendering
Layer.
sition. The second layer (L2) contains all kinds of
walls that definitely restrict the freedom of movement
of positionable objects. Openings, such as doors and
entrances, are considered separately to be placed as a
third layer (L3) atop of walls and to enable the over-
writing of limitations set by the walls.
3.2.4 Step 3: OGM Rendering
As a final step of the OGM generation, the rendering
is performed.
Thereby, every floor of a building with its specific
geometry results in a separate OGM. Consequently, a
canvas is created for every floor and the dimensions of
these canvases are defined by the lowest and highest
OGM coordinates of every floor, which designate the
canvas boundaries.
The rendering itself handles 8 bit grey scale val-
ues, which encode positioning probabilities in a range
from 0 % (0.0) to 100% (1.0). When rendering in-
door areas of Layer L1, i. e. rooms, corridors or steps,
these areas are filled with a grey scale value of 0.75
as it is shown in Figure 5b. Using a probability value
of 75 % instead of 100 % allows to subsequently add
popular paths with even higher probabilities, so the
grid map can be optimized in retrospect in case such
frequently used paths are known.
This step is followed by rendering a gradient tube
adjacent to the inner boundaries of the resulting area
of Layer L1, see Fig. 5c. By means of this gradi-
ent behaviour, a lower probability of positions at the
boundaries of indoor areas is modelled. Hence, the
occupancy probability decreases towards the walls in
the shape of a smoothed circle in our case, while the
grey value the circle is filled with is linearly reduced
with increasing radius. Other shapes, such as normal
distributions, are sensible as well. The dimensions of
the shape are relative to the size of the indoor area.
In the next step, the walls of Layer L2 are ren-
dered atop of the L1 area. Walls are also modelled
as areas and are filled with a positioning probability
of 0.0, which ensures that this area is inaccessible for
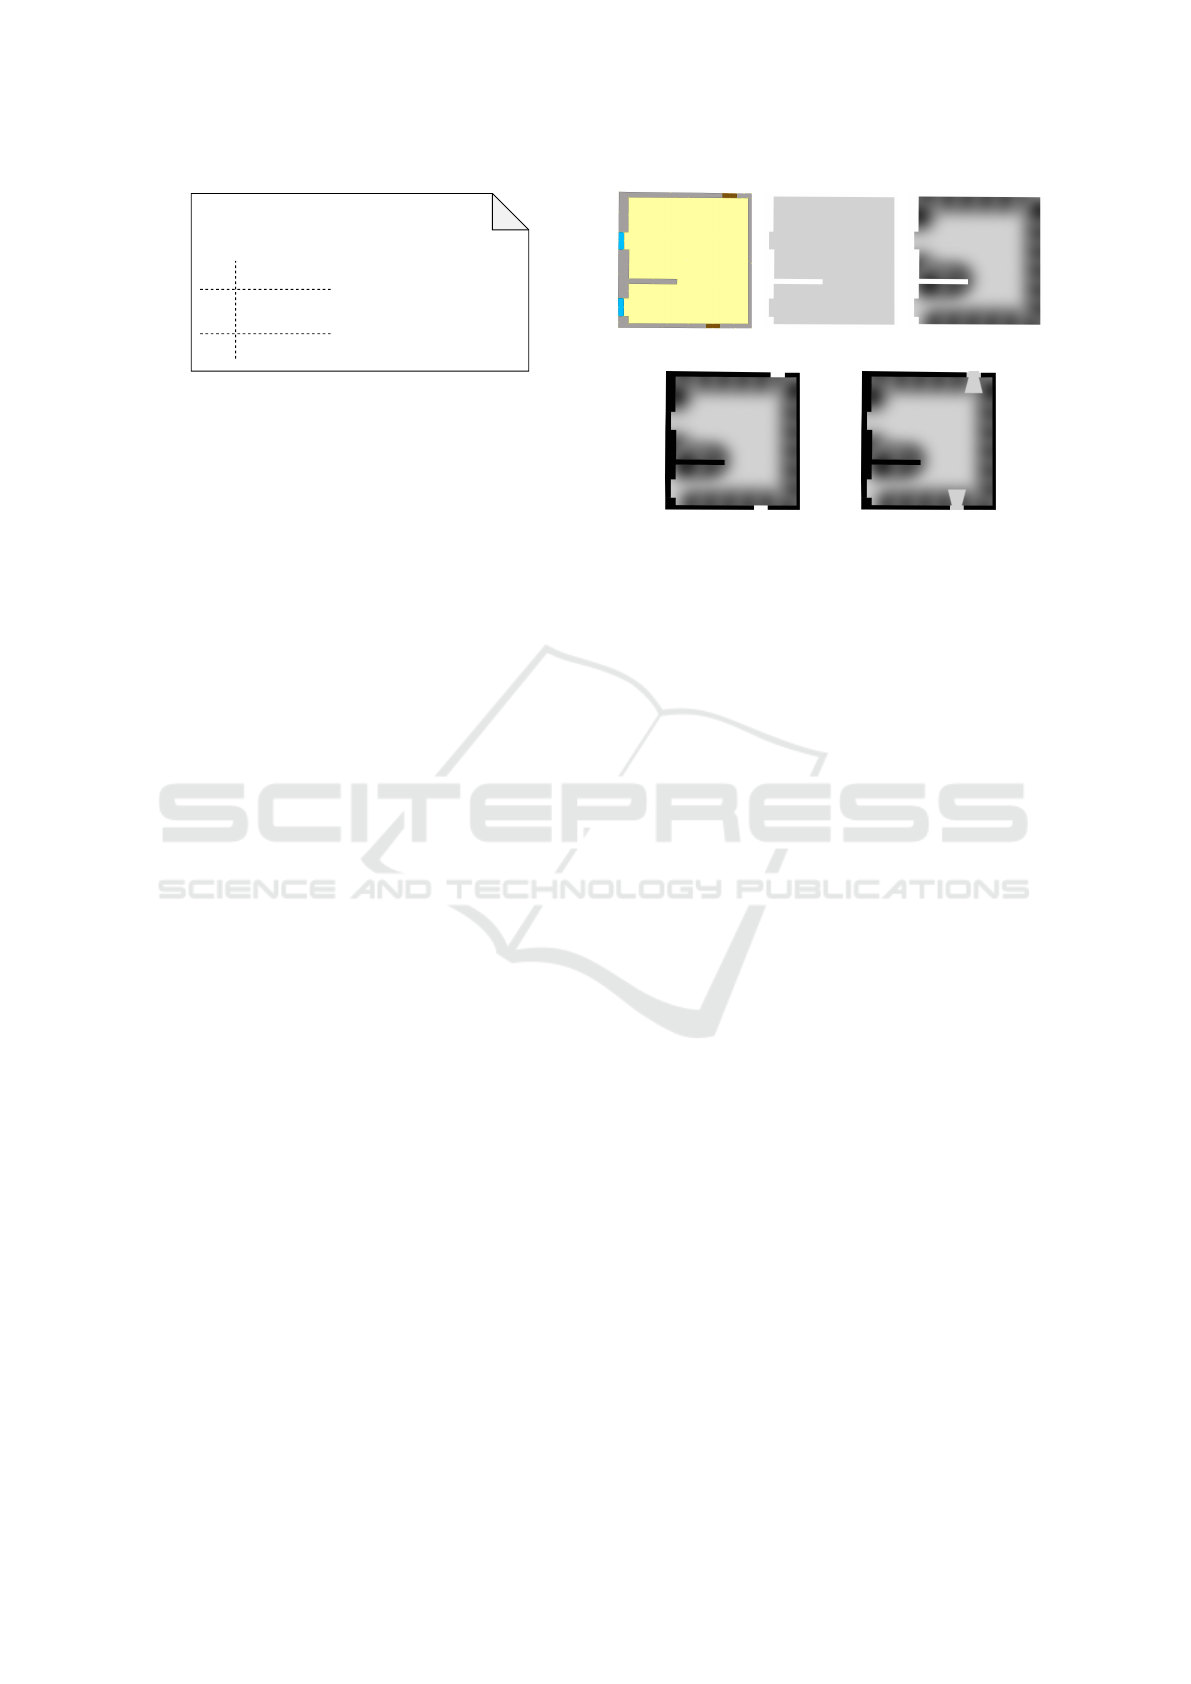
(a)
(b) (c)
(d) (e)
Figure 5: Illustration of the OGM Rendering Process. 5a:
Example OSM Indoor Map with Windows (Blue), Walls
(Grey), Openings (Red) and the Room Area Itself (Yel-
low). 5b: Resulting Area of L1.with Basic Indoor Objects.
5c: Boundary Modelling with Gradients. 5d: Rendering of
Walls in L2. 5e: Rendering of Openings in L3.
positionable objects and persons. This rendering step
is visualised in Figure 5d.
As shown in Figure 5e, Layer L3 includes open-
ings and their probability behaviour of the area around
them. The openings are rendered atop of the previous
layers and represent a positioning probability of 0.75.
Empirical experiences have shown that people enter
or leave openings in a shape similar to a funnel. In
case of openings that are accessible in both direction,
two funnels are used for rendering, so that the result-
ing shape resembles a hourglass shape. The funnels
are rendered perpendicular to the wall surrounding the
respective opening.
Finally, applying the complete algorithm to OSM
indoor data of a certain building delivers an OGM for
each level of this building, which is the output data of
the OGM generation algorithm.
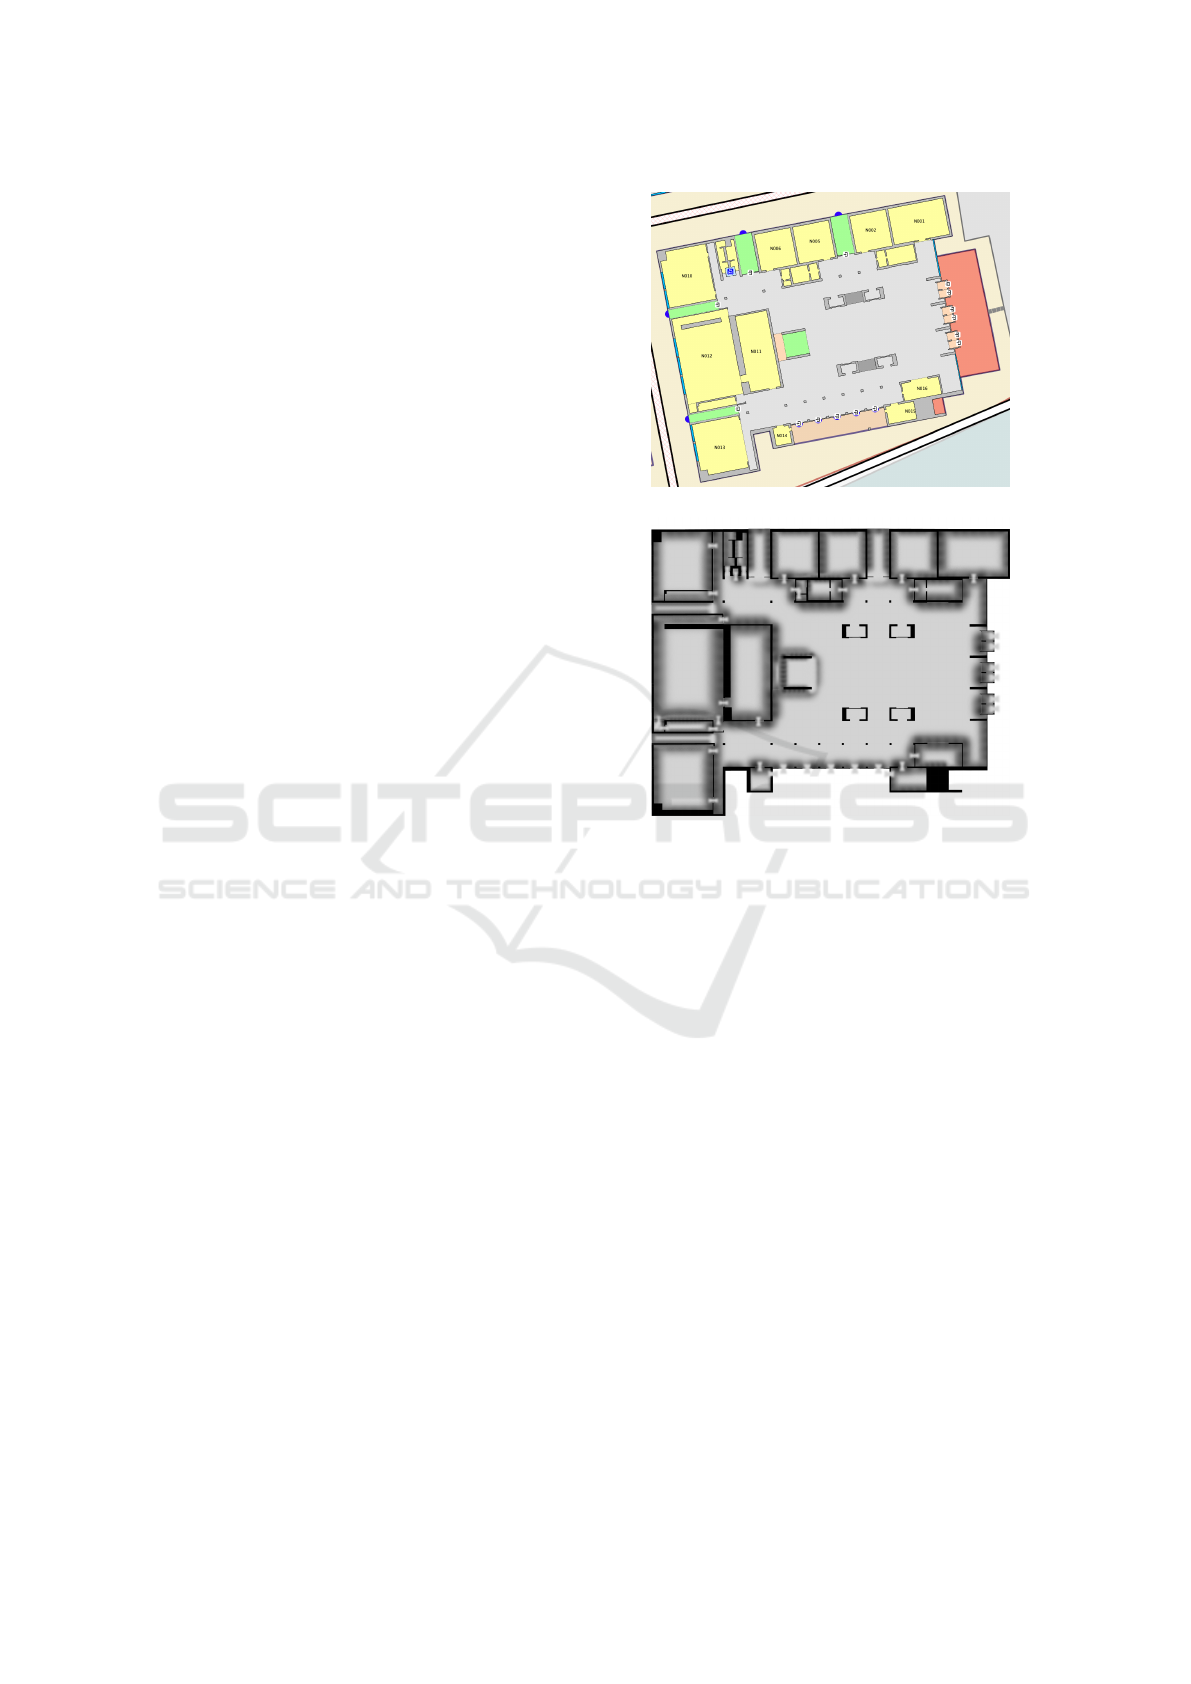
4 RESULTS AND DISCUSSION
We performed experiments with 9 different building
map data sets, which have qualitatively shown that
the algorithm delivers reasonable OGMs. An example
for one of these generated OGMs, which represents a
complete floor of a building, is shown in Figure 6.
When comparing the input, i. e. the OSM indoor data,
with the rendered OGM, it can be seen that the dif-
ferent objects of the three layers are correctly repre-
sented in form of probability grey scale values. Our
study therefore proved that the proposed automated
generation of OGMs from crowd-sourced OSM in-
GISTAM 2020 - 6th International Conference on Geographical Information Systems Theory, Applications and Management
172
door data provides reliable results, provided that the
indoor environment was mapped correctly.
Nevertheless, the algorithm still has three limita-
tions, which should be contemplated in future work:
Firstly, the algorithm does not automatically evaluate
the quality and correctness of the input OSM data.
Because this data is mapped by volunteers without
any special training, the data can be very imprecise
and even necessary features such as doors may be
missing and can therefore negatively affect the result-
ing OGM. With the current implementation, no auto-
matic validation of the input data is performed, so that
a manual plausibility check of the generated OGM
had to be performed. Consequently, validating the
input data is still an open subject to be solved. Sec-
ondly, hourglasses, which are rendered with a fixed
pre-defined size at door positions, are not seamlessly
connected to the base probability of the indoor area.
This is because the width of the probability gradient at
the borders of the indoor area depends on the size of
this area (as noted in Section 3.2.4). Accordingly, the
size of the hourglass should be dynamically adapted
to the room size as well. Thirdly, the current place-
ment of the hourglass in narrow corners of a room
lead to an unwanted overwriting of wall information.
5 FUTURE WORK
In addition to the limitations, which have been pre-
sented in the previous section and which will be han-
dled in future, there are two further developments
planned:
As next step, we focus on the integration of the
generated OGMs in an UWB positioning systems in
order to improve positioning accuracy. Therefore, the
OGM shall be used in combination with a particle fil-
ter to eliminate invalid samples. By means of practi-
cal experiments, the impact of OGMs on the accuracy
improvement will be evaluated.
Furthermore, in future versions of this method im-
plementation, points of interest (POIs) and popular
paths in buildings will be integrated in the OGM, as
already pointed out in Section 3.2.4.
The kind of POIs depends on the use case of the
intended positioning system. For instance, an indoor
navigation for museum visitors must consider the area
around paintings as places with high probabilites for
positions. Because paintings are typically mounted at
walls, the occupancy value of the OGM in such areas
must be increased.
For the definition of popular paths can be applied
both, manual as well as automated approaches: A
manual solution is to ask several persons to manu-
(a)
(b)
Figure 6: OGM Output Generated from OSM Indoor Data.
6a: Example OSM Indoor Map of a Floor in a Building. 6b:
OGM Generated from the given OSM Indoor Map Data.
ally draw paths in the map they think probable to be
frequently used. More appropriate, however, would
be automatised methods. One sensible solution is a
learning-based approach where most frequently used
paths are derived from the actual positioning output
and a kind of heat map is generated. The more detec-
tions are registered in a cell of an OGM, the higher
is the path probability, i. e. the heat, of this cell. A
further method could determine paths by applying
skeletonisation algorithms on the indoor map areas
whereas the remaining topological skeleton denotes
these paths. Finally, another option is to determine
direct paths between relevant objects, for example the
direct lines of sight from one door to other doors in a
room.
REFERENCES
Herrera, J. C. A., Hinkenjann, A., Pl
¨
oger, P. G., and Maiero,
J. (2013). Robust indoor localization using optimal fu-
sion filter for sensors and map layout information. In
Occupancy Grid Map Generation from OSM Indoor Data for Indoor Positioning Applications
173

International Conference on Indoor Positioning and
Indoor Navigation, pages 1–8.
Herrera, J. C. A., Pl
¨
oger, P. G., Hinkenjann, A., Maiero,
J., Flores, M., and Ramos, A. (2014). Pedestrian in-
door positioning using smartphone multi-sensing, ra-
dio beacons, user positions probability map and In-
doorOSM floor plan representation. In 2014 Interna-
tional Conference on Indoor Positioning and Indoor
Navigation (IPIN), pages 636–645.
Karney, C. F. F. (2013). Algorithms for geodesics. Journal
of Geodesy, 87(1):43–55.
Karney, C. F. F. (2019). GeographicLib.
https://geographiclib.sourceforge.io/.
Konolige, K. (1997). Improved Occupancy Grids for Map
Building. Autonomous Robots, 4(4):351–367.
Kurdej, M. (2015). Exploitation of Map Data for the Per-
ception of Intelligent Vehicles. PhD thesis, Univer-
sit
´
ede Technologie de Compi
`
egne, Compi
`
egne.
Kurdej, M., Moras, J., Cherfaoui, V., and Bonnifait, P.
(2012). Map-Aided Fusion Using Evidential Grids
for Mobile Perception in Urban Environment. In De-
noeux, T. and Masson, M.-H., editors, Belief Func-
tions: Theory and Applications, Advances in Intelli-
gent and Soft Computing, pages 343–350. Springer
Berlin Heidelberg.
Matthies, L. and Elfes, A. (1988). Integration of sonar and
stereo range data using a grid-based representation. In
1988 IEEE International Conference on Robotics and
Automation Proceedings, pages 727–733 vol.2.
Moravec, H. and Elfes, A. (1985). High resolution maps
from wide angle sonar. In 1985 IEEE International
Conference on Robotics and Automation Proceedings,
volume 2, pages 116–121.
Naik, L., Blumenthal, S., Huebel, N., Bruyninckx, H., and
Prassler, E. (2019). Semantic mapping extension for
OpenStreetMap applied to indoor robot navigation. In
2019 International Conference on Robotics and Au-
tomation (ICRA), pages 3839–3845.
OSM-Community (2019a). JOSM. https:
//josm.openstreetmap.de/.
OSM-Community (2019b). JOSM/Plugins/measurement
– OpenStreetMap Wiki. https://
wiki.openstreetmap.org/wiki/JOSM/Plugins/
measurement.
OSM-Community (2020). Indoor Map-
ping – OpenStreetMap Wiki.
https://wiki.openstreetmap.org/wiki/Indoor
Mapping.
Thrun, S. (2001). Learning occupancy grids with forward
models. In Proceedings 2001 IEEE/RSJ International
Conference on Intelligent Robots and Systems. Ex-
panding the Societal Role of Robotics in the the Next
Millennium (Cat. No.01CH37180), volume 3, pages
1676–1681 vol.3.
GISTAM 2020 - 6th International Conference on Geographical Information Systems Theory, Applications and Management
174
