
IoT based Testbed for Human Movement Activity Monitoring and
Presentation
Akash Gupta, Khalid-Al-Naime and Adnan-Al-Anbuky
School of Engineering, Computer and Mathematical Sciences,
Auckland University of Technology,
Auckland, New Zealand
Keywords: Internet of Things (IoT), Activity Monitoring, Wearable Sensor, Testbed, Remote Monitoring.
Abstract: Rehabilitation or Prehabilitation are vital healthcare practices that allows people to recover their muscle
strength and return to their normal daily life activities or be ready for operating on respectively. Each type of
injury or operation would require its own specific movement activities that need to be conducted over a
predefined supervised or unsupervised program. Tracking, recording and monitoring the daily movement
activities can significantly help in follow up the correct implementation of a predefined program. The recent
advancement in digital health could be leveraged upon in benefiting the above indicated processes. Internet
of Things (IoT) is the technological revolution that allows objects to be interconnected, related movement
activities to be tracked and online gathering of real time and history data to be collected. This in effect should
offer the possibility of converting regular rehabilitation into a smart rehabilitation care. This paper proposes
a generic IoT based testbed using three layered solution for human activity movement monitoring. These are
wireless sensing layer, the local processing and internet access layer and remote cloud service layer.
Functionality for each of these layers are explored and tested based on hip fractured rehabilitation use cases.
Experimental results reflect the ability to drive the system in a software defined mode for accommodating
different use cases.
1 INTRODUCTION
With an unprecedented advancement in IoT,
numerous services and prototypes have been
developed and proposed (Dang, Piran et al. 2019).
Integrating IoT with healthcare can help significantly
in reducing the cost, enrich user experience and
improve the quality of life (Salunke and Nerkar
2017). However, it possesses a lot of growing
challenges like data storage, management, latency,
constrained resources, exchange of data between the
devices, mobility, security , network connectivity,
ubiquitous access and system performance (Buyya
and Srirama 2019). In fact, different multi-layer IoT
based architectures have been proposed by many
researchers that include the sensing, networking,
service and the user interface layer (Kowal, Kuzio et
al. , Lee and Lee 2015, Farahani, Firouzi et al. 2018).
A wearable IoT architecture for home based and
personalised healthcare services is proposed by
(Kumari, López-Benítez et al. 2017) based on edge
computing. In their work, the system architecture
component is composed of the wearable human
activity tracking device comprising of many different
sensors like 9-axis motion sensors, responsible for
data collection, storage and processing. Edge
computing device is used for storage, processing and
for communicating information to the cloud. Cloud
computing and other analytical services are used for
real time visualisation of subject data. Their
architecture provides an explanation as how each of
these device functions in formulating a complete
system. However, the system lacks technical detailed
explanation about the frequency of data acquisition,
different types of storage available, data
communication frames and protocols by providing
examples. The paper has given examples as how their
architecture could be suitable for clinical practises.
However, there is no discussion on real-life testing on
any of the application to see what challenges the
system can offer and how the researchers can benefit
at each level while addressing application
requirement.
(Cabra, Castro et al. 2017) have presented a work-
in-progress IoT approach for deploying WSN applied
to the environmental monitoring of temperature and
Gupta, A., Khalid-Al-Naime, . and Adnan-Al-Anbuky, .
IoT based Testbed for Human Movement Activity Monitoring and Presentation.
DOI: 10.5220/0009347800610068
In Proceedings of the 6th International Conference on Information and Communication Technologies for Ageing Well and e-Health (ICT4AWE 2020), pages 61-68
ISBN: 978-989-758-420-6
Copyright
c
2020 by SCITEPRESS – Science and Technology Publications, Lda. All rights reserved
61
humidity within hospitals or clinic laboratories. The
work aimed at developing an IoT architecture capable
of autonomously sensing the environmental
conditions and providing to the user real-time remote
monitoring. The authors have structured their
architecture based on three layers starting with the
node layer based on WSN, the local management
layer, and the cloud-based layer for remote
monitoring. In their approach, the sink module
receives all the data sent by different sensing nodes
based on MTM-CM5000-MSP module then sends to
the local PC in which it can be sent to the cloud. The
information of data packets is ID node, humidity and
temperature values. From the findings, node layer
factors like data packet size, sampling rate etc. have
not been presented in detail.
However, the current focus is now shifting
towards two different types of IoT architecture i.e.
centralised and decentralised approach. In the
centralised approach, the operational and
computational processes are placed within the cloud.
All the involved devices forward the data to the cloud
before any decision making can take place. This may
lead to challenges in handling the unnecessary
increase in the traffic and load of resources (Verma,
Kawamoto et al. 2017). Whereas in the decentralised
approach, utilizing the other layers of the architecture
for distributing the computational and decision-
making capabilities from the cloud to the edge and
fog
layer
represented
by
the
end
and
intermediate
devices (gateway) respectively. This can lead to
significant reduction in the transferred data, thus
decreasing the communication delay (Mocnej, Seah
et al. 2018). However, this concept has not been
employed to cloud based WSN and can be of great
interest while proposing and implementing the
layered architecture by considering the computation
process to be done in the various spots of the network.
This paper attempts to underline and address all
the competent functions involved in IoT based testbed
architecture for human activity movement
monitoring. The concept could support many
different healthcare monitoring applications.
Moreover, the paper also validates the proposed
architectural functionality at each level by
considering the case of hip fracture rehabilitation
movement activity monitoring.
2 HUMAN ACTIVITY
MOVEMENT MONITORING
SYSTEM
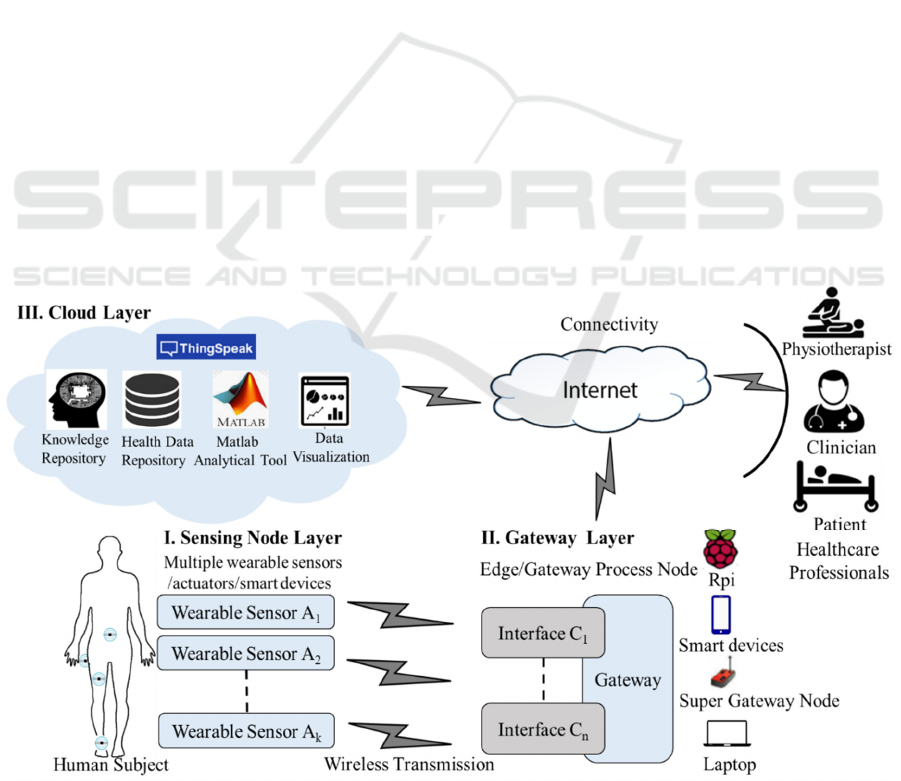
The architecture for the proposed human movement
activity monitoring IoT testbed is illustrated by
Figure 1. The design is based on three main layers.
These are Wireless Sensing layer, Gateway layer and
Cloud layer. Each layer has its own unique role in the
overall movement monitoring process.
Figure 1: Activity movement monitoring testbed design.
ICT4AWE 2020 - 6th International Conference on Information and Communication Technologies for Ageing Well and e-Health
62
The wearable sensors report to a gateway through
embedded protocol(s) such as Bluetooth, Wi-Fi or
ZigBee. Other customized protocol may also be
facilitated. The rate of data acquisition and reporting
could be configured to suit the application. This may
involve one or more sensing types and the gateway
may handle one or more wireless sensors. These may
relate to multiple users or multiple wearable sensors
on the same subject. Both wearable sensor and
gateway offers the role of communicating the data.
They could be involved in edge computing and
backup storage. Hence, this could be handled as
generic solution.
Alternatively the two network components
(wearable sensor and the gateway level) could be
driven as a software defined functions. This could be
done by utilising the two components for data
processing, compression and some level of activity
recognition. It will significantly help in relieving the
cloud from detailed signal processing and in reducing
the data size. At the Cloud, real-time and history data
will be managed. Visualization modelling and more
involved processing take place. The Cloud facilitates
the key interaction with the various types of users
including the subject, health service providers such as
caretaker, physiotherapist, clinician etc.
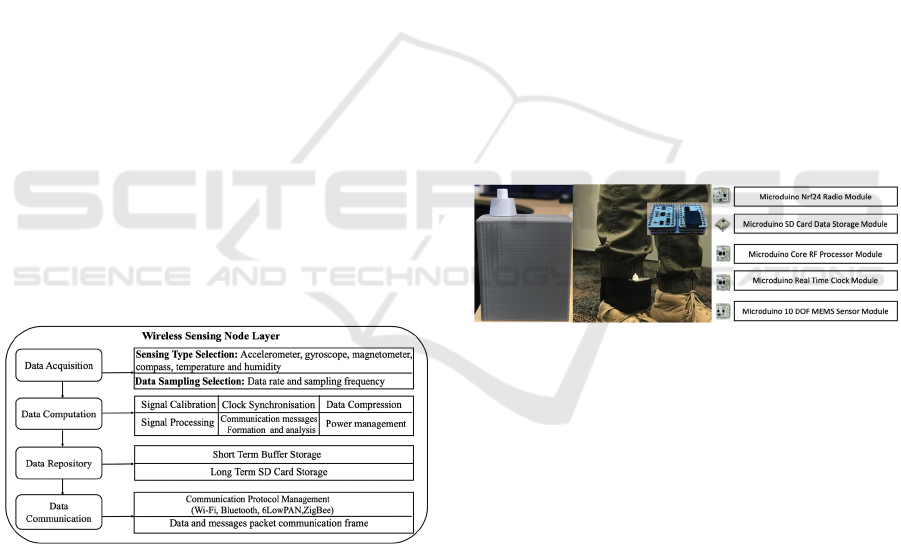
2.1 Wearable Sensor Function
The wearable sensor function can be seen by Figure
2. It involves four key functionalities for offering a
software driven configurable system.
Figure 2: Wearable sensing node layer involved
components.
First, data acquisition that is responsible for
sensing type selection (such as accelerometer,
gyroscope, magnetometer, compass, temperature and
humidity), data sampling selection (such as data rate
and sampling frequency). Second, data computation
that encompasses signal calibration, signal process-
ing, data compression, communication messages
formation and analysis, clock synchronisation,
operational modes and power management. Third is
data repository for short term buffer at main memory
and long-term back storage (SD card). Last is the
communication which involves data and messages
frames and communication protocol management.
In this research, a wearable monitoring device
prototype is designed based on Microduino system.
The main components involved are Microduino
CoreRF, SD card, Real Time Clock, and Microduino
nRF board holding the Nordic nRF24Lo1+
transceiver, Microduino 10 DOF sensor board
comprising MPU6050 that contains triaxial
accelerometer and gyroscope, magnetic field strength
(HMMC583L) and barometer sensor (BMP180). A
Microduino Real time clock for capturing the human
subject activity movement event period and Core RF
processor for computational purposes. The device is
battery powered through a rechargeable battery.
Figure 3 shows the proposed wearable device and
its placement at ankle location along with the device
components stack. Ankle location is selected as
favourable location for recognising post hip-fracture
rehabilitation movements activities (Gupta, Al-
Anbuky et al. 2018). Moreover, commercial fabric
strip is tailored based on the wearable sensor design
to make it comfortable for the user wearing the
sensor.
Figure 3: Wearable device placed on the right ankle and its
components stack.
Among all the available sensors within the
proposed device, only triaxial accelerometer sensor is
used in this article which is responsible for sensing
real-time human activity data. The data is collected at
a sampling frequency of 128 Hz. It offers four
different ranges of acceleration ±2g, ±4g, ±8g, ±16g
where g is the acceleration due to gravity in m/s
2
.
Acceleration range of ±2g is considered sufficient for
appreciating ambulatory activities (Gupta, Al-
Anbuky et al. 2018).As part of testing, data is
collected for a time period of two hours where
different set of post-operative hip-fracture
rehabilitation activities like lying on stomach , lifting
thigh upwards, slow and fast walking are performed
in an ad-hoc manner only during the first five minutes
and for the remaining time the device is in static state
to investigate the operational reliability and
continuity in data collection.
IoT based Testbed for Human Movement Activity Monitoring and Presentation
63
Two storage space has been provided within a
wearable device. A circular buffer has been used for
short term storage of the continually processed data
whereas SD card is used as a long-term storage
purpose here. Firstly, it can be used for long-term
storage of the continuous raw activity accelerometer
data. SD card of 16GB was used in this research
which can store data for around 10 days when run
continually for 24 hours a day. However, any size SD
card can be used for extending the longevity of the
data storage depending on the application need.
Secondly, the availability of the data can help
researchers or clinicians for carrying out further
detailed intelligent computational analysis. Also, it
act as a backup in the event of misconnection of
connectivity to the gateway and the cloud.
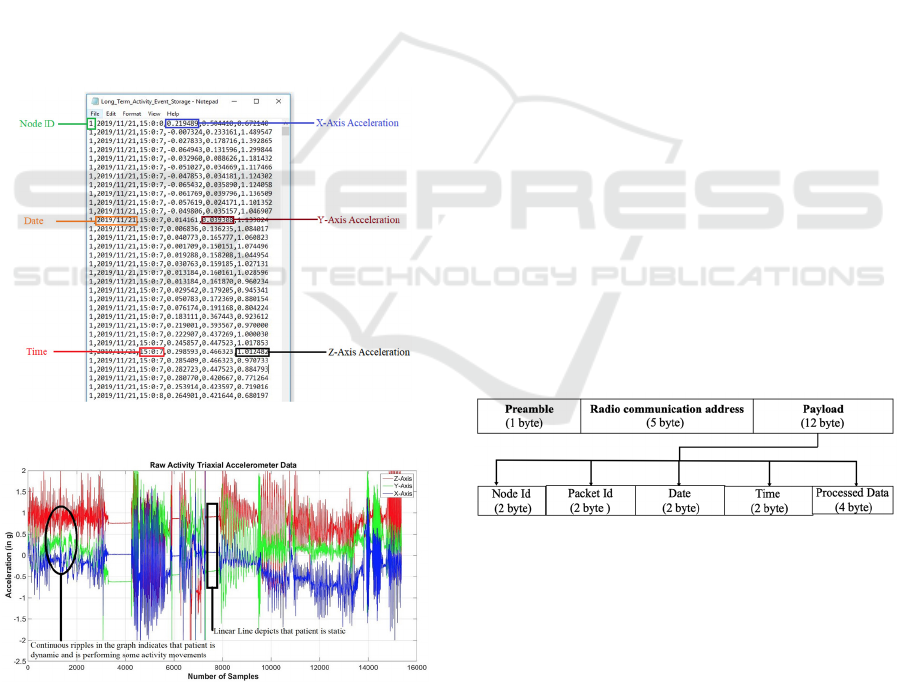
The screenshot and trend of the sample or
unfiltered activity data stored in the SD card can be
seen from Figure 4 and 5. Figure 4 sample the
unfiltered type of activity data stored in the SD card
i.e. node id, date, timestamp and 3 axis (x, y and z
axis) accelerometer readings.
Figure 4: Sample activity movement SD stored data.
Figure 5: Sample trend of the activity movement data.
Whereas in Figure 5, the continuous ripples
portray that human subject is dynamic and is
performing some type of activity movements.
However, there are scenarios when the accelerometer
data is steady at fixed value which means that subject
is static (exercise no movements).
After capturing the raw activity data, one option
is to then subject the raw data to filtering methods.
This is done by combining all the three axis samples,
taking the mean, removing the DC offset and taking
average of every four samples, down-sizing the
sampling rate to 32 Hz (Gupta, Al-Anbuky et al.
2018) to comply with the 20 Hz suggested for
everyday activities by (Sharma, Purwar et al. 2008).
In order to establish a communication between the
wearable device and gateway node different
communication protocols can be used for instance
Wi-Fi, Bluetooth and ZigBee.
However, f
or data
packet transmission and reception, Nordic nrf24
chipset has been used that works on an enhanced
shock burst protocol. It supports three air data rate i.e.
250kbps, 1Mbps and 2 Mbps and is suitable for ultra-
low power wireless applications.
For preliminary testing purpose, point to point
communication is established for transmission of data
packet once every four seconds from the wearable
node to the gateway. A portable Raspberry Pi
attached with a Microduino nrf24 radio module is
acting as a gateway here.
The transmission of radio data packet from node
to the gateway takes place at a data rate of 250kbps.
It has a 5 byte radio pipe address for transmission and
reception, 2 byte for node id, 2 byte for packet
transmission id for packet trace, 2 byte for date, 2 byte
for time and 4 byte for the processed data as portrayed
in Figure 6. In total, one reading has a data packet size
of 12 byte and 128 such reading are send to the
gateway layer accommodating a total of 1536 byte of
data.
Figure 6: Data packet communication frame.
Considering the radio packet transmission in
mind, analysing the energy consumption and how
long the wearable device would last is essential. This
is done by studying the device in idle mode and that
of fully functional. As the Microduino hardware can
run on 3.3 V, the wearable nodes are powered by a ½
AA rechargeable battery of 700 mAh at 3.7V where
the cut-off voltage is 2.75 V. This is a random
selection of the battery so that the device can almost
cover a day. The current in idle and operational (op)
mode of each module can be seen from Table 1.
ICT4AWE 2020 - 6th International Conference on Information and Communication Technologies for Ageing Well and e-Health
64
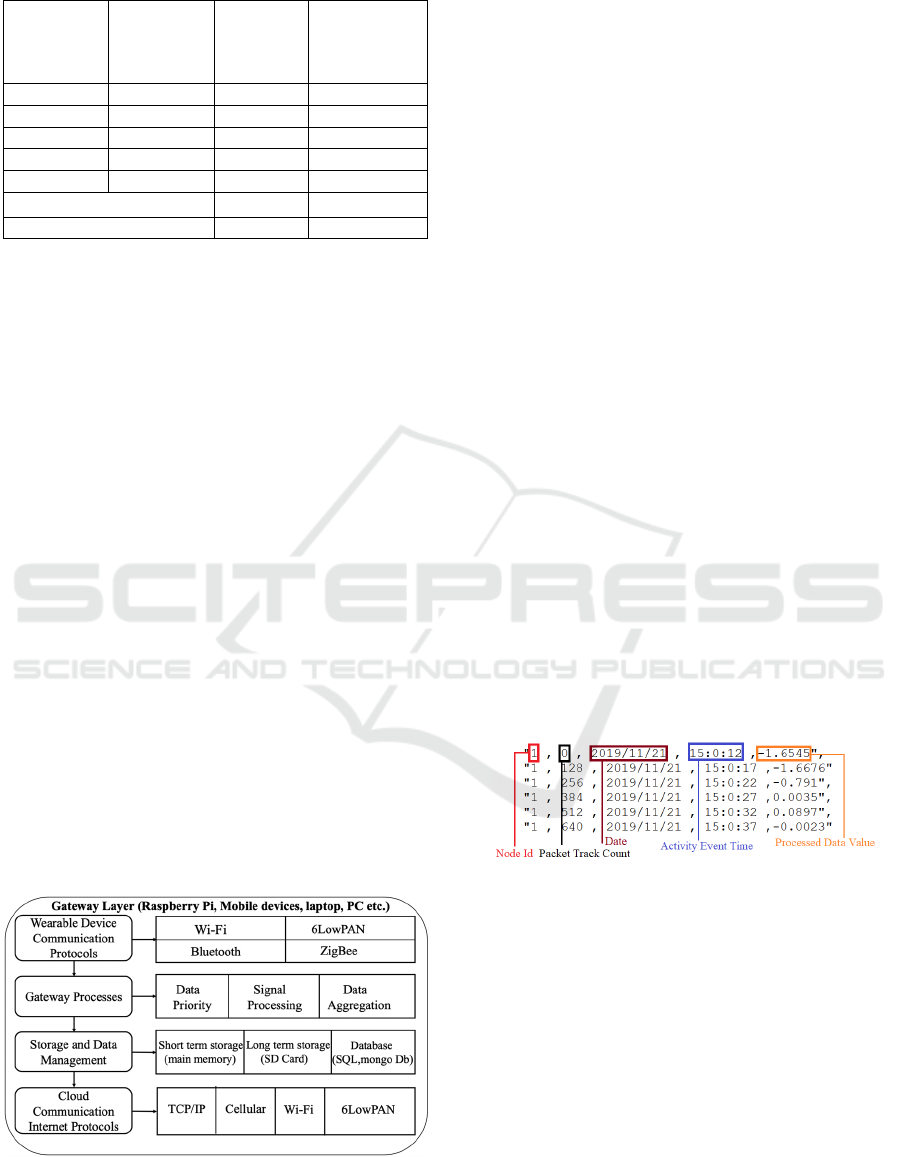
Table 1: Current consumption of the node components.
S.no Sensing
Board
Idle
Mode
Current
(mA)
Operational
Mode
Current
(mA)
1
Core RF
22
22
-
24
2
10 DOF
0.01
0.02
-
0.06
3
SD card
1.5
5
-
7
4
Nrf24
2.8
3
-
4.5
5
RTC
0.032
0.05
-
0.1
Total Current Consumed 26.3 mA 30-36 mA
Total Power Consumed
97.4 mW 111-132 mW
From the practical measurement of the device, a
total current of 26.33 mA and between 30-36 mA in
idle and operating mode is used by the device.
Whereas, a total power consumption of 97.4 mW and
between 111-132 mW has been used for both the
modes.
However, a slight fluctuation in the current is
observed during transmission and reception and the
variation is mostly between 30-36 mA. This could be
due to several reasons for example when the data is
stored in the SD card, it draws more current. Based
on our calculations and as shown by Table 1, battery
capacity is sufficient to collect, store and transmit
data continuously for a time period of 20 hrs and
needs to be recharged using a USB cable when human
subject is going to bed.
2.2 Gateway Function
A portable Raspberry Pi is attached with a
Microduino nrf24 radio module and the
functionalities involved at the gateway layer is
represented in Figure 7.
There are four key functionalities involved. First
is the wearable device communication interface. This
relate to the protocol used and act as the protocol
convertor.
It
will
help
receiving
the
data
through
Figure 7: Gateway layer involved components.
wireless and pass it through serial communication.
Example for a gateway could be a raspberry pi,
smartphone or laptop. Second is the incoming data
from the wearable device and locally processed data
storage and management. This can be short term
storage available within the main memory (1GB
RAM), long-term storage at SD card (16 GB) and
data can be managed using database like SQL and
MongoDB. Third is the computational capability
analysed locally at gateway layer like signal
processing, data aggregation and priority before
connecting to the cloud and transmitting using
internet protocols like TCP-IP, 6LowPAN, Cellular.
In this research, the main purpose of making the
device portable is to allow subject to carry it
anywhere and with ease if they move out of the
allocated residence. The radio module used is
attached serially to raspberry pi for data reception
using serial peripheral interface (SPI).
A complete packet of 128 pieces of data is
received regularly (representing the 4 second data
acquired by the wearable sensor) by Raspberry Pi
(Rpi) . This data packet is stored continually in the SD
card residing within Rpi in form of a text file. The
screenshot of the data packet received at raspberry pi
is shown in Figure 8. Here “1” represents the node id,
“0” is the packet track count that increments by 1
whenever the new packet is received. This is to keep
a track which packet has been received or lost during
the transmission. 2019/11/21 represents the date and
“15:0:12” represents the time and “-1.6545”
represents the processed data at wearable sensor node
level.
Figure 8: Wearable sensor processed data packet format
received at Raspberry Pi.
The representation of the wearable sensor
processed/filtered data vs the one minute activity time
period event stored in the raspberry pi is represented
in Figure 9. In contrast to the raw graph as shown in
Figure 5, the graph below is smoother and consistent
due to cleaned pre-processing. Moreover, based on
the ripples observed at different point in the graph
marked with different coloured circles, indicates
subject has performed different types of activity
movements instead of being static all the time. Red
circle indicates that subject was static whereas other
different circles portrays different sets of activities
IoT based Testbed for Human Movement Activity Monitoring and Presentation
65
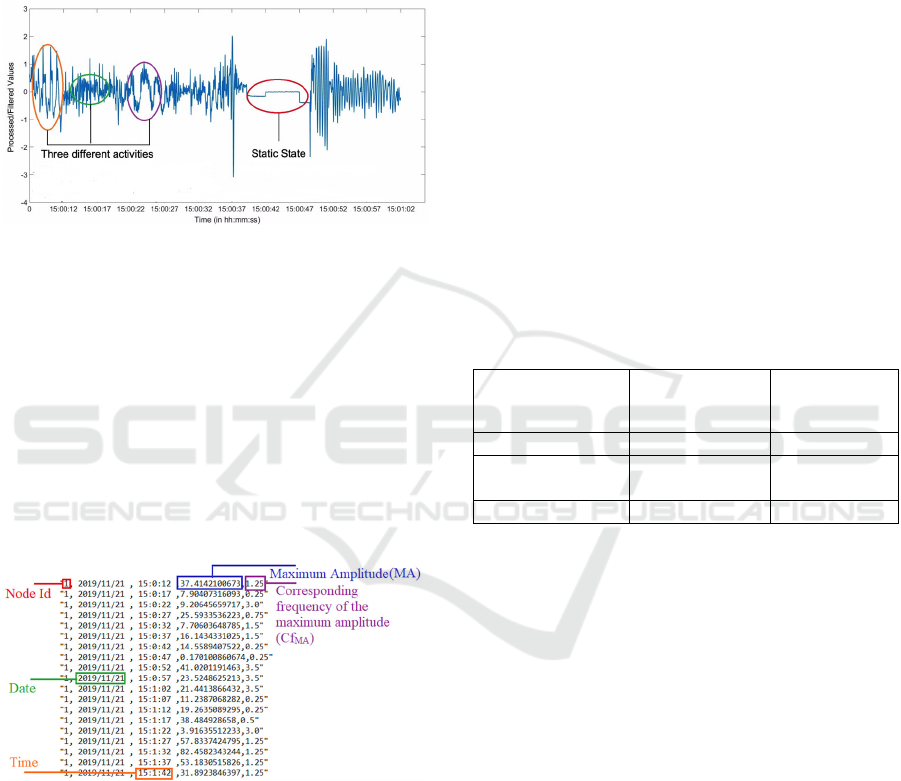
that cannot be recognised on the basis of this data.
Therefore, it is difficult to discriminate the activities
based on the wearable sensor processed data and
require further data compression. Compressing of the
data acquired by the wearable sensor taken place by
Raspberry Pi gateway using FFT based signal
processing as discussed by (Gupta, Al-Anbuky et al.
2018).
Figure 9: 1-min filtered values vs activity time period event
plot received at the Raspberry Pi.
The process identifies the dominant amplitude
and the corresponding frequency of the maximum
amplitude (Cf
MA
) for each of the 4 seconds data batch.
The timestamp is associated with the end time of that
sampling snap. In fact, the final compressed long-
term data is stored in the Rpi SD card in form of a text
file due to following reasons. First, to validate the
data packet loss. Second in case of connectivity to the
cloud is lost but the activity recognition data can still
be recovered. The screenshot of the FFT process data
packet format is shown in Figure 10:
Figure 10: Gateway FFT based signal processing data
packet.
Each activity threshold condition is set based on
the if-else condition for a user as depicted by (Gupta,
Al-Anbuky et al. 2018) in table: Activity
classification overall summary at the ankle location.
Therefore, activity recognition is performed at
gateway level based only on maximum amplitude and
corresponding spectrum. On recognising an activity,
maximum amplitude, corresponding spectrum and
the recognised activity code is sent to the cloud. Here,
the recognised activity code is a number that ranges
from 0-8 and is respectively identified as static state,
slow walking, fast walking, leg movement, lifting
thigh upwards, swinging leg to a side, lying on back,
lying on stomach and unrecognised activity. For
example, if a recognised activity is slow walking, the
gateway will send a value 1 to the cloud. The
visualisation of all these data is represented in Figure
13. Moreover, communication between the
Raspberry Pi and ThingSpeak cloud platform is
established using TCP-IP internet protocol.
The research investigated power consumption of
the portable device theoretically based on the
information available from the datasheet. In this
research, gateway device is powered by two AA
battery of 2500 mAh (equivalent to 5000 mAh) at
3.6V. The recommended input voltage for Rpi is 5V
with a ±5% tolerance. This means the voltage could
be supplied between 4.75-5.25V. Table 2 represents
the current and power consumption of the Rpi3 when
it is in idle mode versus to its fully operational mode.
Table 2: Current and power consumption of the Rpi3 in idle
and operation modes.
Raspberry Pi3
Current
Consumption
(mA)
Power
Consumption
(W)
Idle Mode 260 1.3
Storing/opening
File from SD Card
285 1.425
Operational Mode 670 3.35
If we consider the fully operational mode current
consumption of Rpi3. The calculations shows that
battery capacity is sufficient to collect, store and
transmit data continuously for a time period of only 7
hrs. Considering that the battery power is only needed
when the subject is outdoor, the 7 hours should be
sufficient to cover the data collection time before
recharging again.
2.3 Cloud Function
The key involved functions within the cloud layer are
represented in Figure 11. At cloud layer, the
“ThingSpeak” open source IoT based platform has
been used. This platform provides the capability of
collecting and storing the data in real time and allows
for developing IoT based processing and
visualization for the application. Importantly, Matlab
data tools are available to process, elaborate and
analyse the data further. The data is transmitted from
the Raspberry Pi using HTTP protocol to the
ThingSpeak cloud. The data is stored in the
ThingSpeak
cloud
(in
JSON,
XML
and
CSV
format)
ICT4AWE 2020 - 6th International Conference on Information and Communication Technologies for Ageing Well and e-Health
66
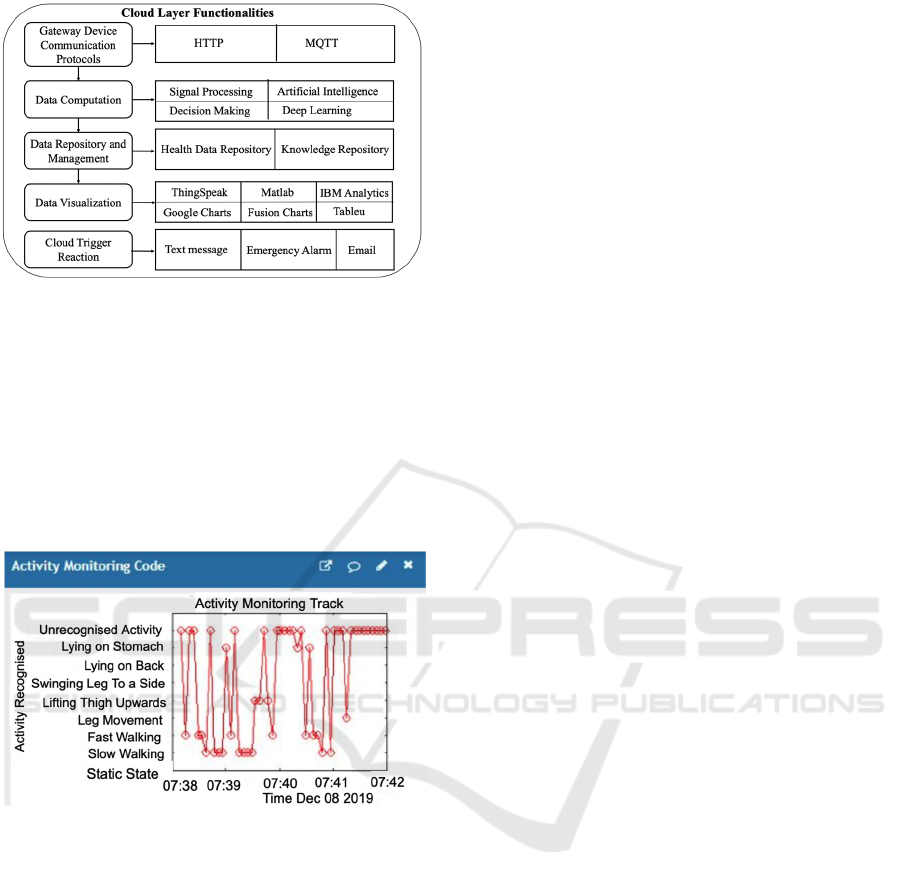
Figure 11: Cloud layer involved components.
repository across six different fields (Field 1: Node
Id, Field 2: Date, Field 3: Time, Field 4: Maximum
Amplitude, Field 5: Spectrum with Peak Intensity,
Field 6: Preliminary Recognition ID
).
Utilising Matlab analytical tools provided within
ThingSpeak for computational purpose, a human
subject activity monitoring track vs time visualisation
has been created (refer Figure 12) from the data
available within the cloud repository.
Figure 12: Activity monitoring track Vs time using Matlab
analytical tools.
This plot provides the overall view of the different
type of activity movements performed (represented
by red coloured circles) by a subject vs time. Findings
shows that patient has performed lifting thigh
upwards, lying on stomach, slow and fast walking
whereas some of the activities was not recognised.
The approach we used at this stage is simply rule-
based approach using the FFT outcome. There are
areas of overlap among activities and further and
more involved recognition approach is needed.
3 TESTBED PERFORMANCE
This section reflects the testbed performance by
considering the examples of activities related to post-
operative hip fracture rehabilitation activity
movement as a use case.
Hip fracture is a common incident among older
adults and results in poor outcomes. Although, many
rehabilitation programmes are available that focus on
improving the physical functionality, mobility and
help in returning back to their daily life routine
activities. But, the effectiveness of the program is still
uncertain (Pol, ter Riet et al. 2019). In fact, most of
the rehabilitation occurs when the patient has been
discharged from the hospital and is living
independently or in rehabilitation homes. As a result,
healthcare professionals lacks real time precise data
of the daily functioning of the patient activity
movements. This prevents the person to achieve their
personalised and realistic goals. This is due to the
non-existence of remote activity movement
monitoring system using wearable sensors that can
track patient’s activity movement levels in long-term
(Pol, ter Riet et al. 2019).Therefore, by addressing it,
the gap can be filled.
For hip fracture rehabilitation monitoring, the
activities that need to be recognised are similar to the
ones proposed by (Gupta, Al-Anbuky et al. 2018).
These are leg movement (while sitting), lifting thigh
upwards, swinging leg to a side, lying on back and
stomach, slow and fast walking and static state i.e.
sitting and standing. Patients are advised to perform
these activity movements at least two times a day by
repeating each movement 5 to 10 times (Buyya and
Srirama 2019). We make use of the proposed testbed
architecture in designing and implementing the
complete system at each layer. As part of our
preliminary testing, a healthy young individual was
asked to perform few activities like slow and fast
walking, lifting thigh upwards and lying on stomach
in any order and based on their comfortability.
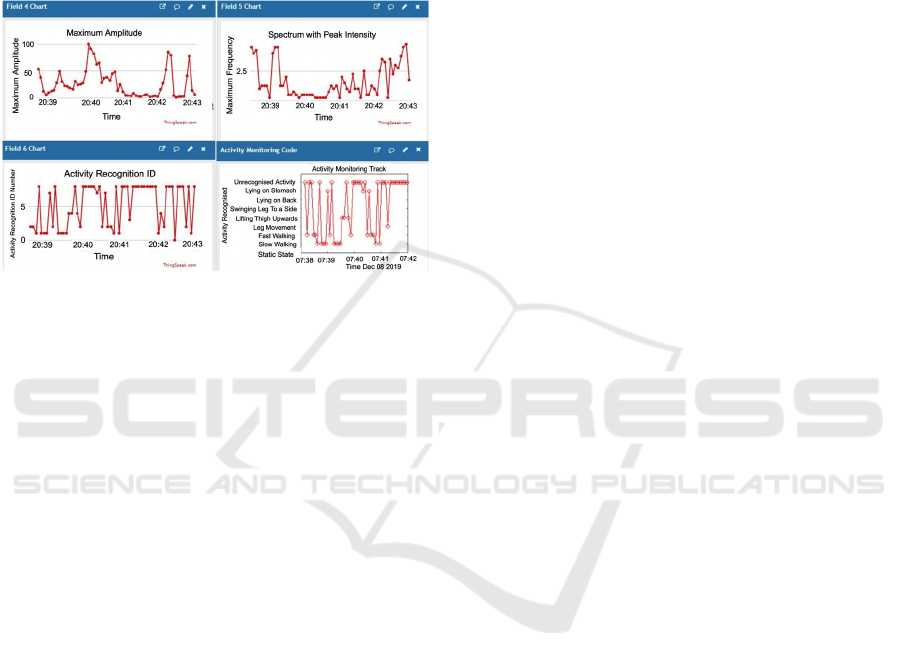
Findings shows that the testbed was successful in
implementing the functionalities at each layer and
based on the activity movement data collected and
analysed. No concerns with the data storage across
different layers has been observed. The system was
able to recognise some of the performed activities in
real time that can be seen from Figure 13. The rule
based approach used is limited at this stage and
require further support through either additional
sensing or more involved deep learning.
Apart from that, further research work is required
to enhance the testbed functionality so that system
can be implemented on large scale like hospitals,
rehabilitation home etc. This include establishment of
multiple wireless sensor connectivity, multiple sensor
sending data to gateway and then to cloud, investigate
packet loss, data drop rate when multiple sensors are
IoT based Testbed for Human Movement Activity Monitoring and Presentation
67
involved, investigate what is the suitable number of
sensors that can accommodate with a single gateway
in establishing secure connectivity and in data
transmission and reception, how to optimize data
traffic and process, overall system communication
performance, more involved activity movement
recognition with the use of machine and deep
learning. Also, how the system can be personalised
and adaptive to a particular subject automatically.
Figure 13: Data presentation of maximum amplitude,
corresponding frequency of the maximum amplitude,
activity recognition ID and activity monitoring track.
4 CONCLUSIONS
This paper proposed a generic IoT test-bed
architectural design for human movement activity
monitoring. The design is driven towards modular
structure that allow both hardware and software
modules to be tested and can be applied to wide range
of healthcare applications. The paper implemented
the proposed testbed functionality pragmatically by
considering post-operative hip fracture rehabilitation
activity movement recognition as one of the use case.
Experimental results represent that the system was
able to implement the testbed functionalities across
all layers and also in recognising most of the
activities. Further involvement will look into testing
the performance measures on activity classification
recognition accuracy, users acceptability and
usability of the proposed device. It will also look into
the compliance of the system with IIOT or Industry
4.0 direction and ability for software defined
infrastructure.
REFERENCES
Buyya, R. and S. N. Srirama (2019). Fog and edge com-
puting: principles and paradigms, John Wiley & Sons.
Cabra, J., D. Castro, J. Colorado, D. Mendez and L. Trujillo
(2017). An IoT approach for wireless sensor networks
applied to e-health environmental monitoring. 2017
IEEE International Conference on Internet of Things
(iThings), 21-23 June 2017, Exeter, UK,
10.1109/iThings-GreenCom-CPSCom-
SmartData.2017.91
Dang, L. M., M. Piran, D. Han, K. Min and H. Moon
(2019). "A Survey on Internet of Things and Cloud
Computing for Healthcare." Electronics 8(7): 768.
Farahani, B., F. Firouzi, V. Chang, M. Badaroglu, N.
Constant and K. Mankodiya (2018). "Towards fog-
driven IoT eHealth: Promises and challenges of IoT in
medicine and healthcare." Future Generation Computer
Systems 78: 659-676.
Gupta, A., A. Al-Anbuky and P. McNair (2018). "Activity
Classification Feasibility Using Wearables:
Considerations for Hip Fracture." Journal of Sensor and
Actuator Networks 7(4): 54.
Kowal, J., A. Kuzio, J. Mäkiö, G. Paliwoda-Pękosz, P. Soja
and R. Sonntag "ICT Management for Global
Competitiveness and Economic Growth in Emerging
Economies (ICTM)."
Kumari, P., M. López-Benítez, G. M. Lee, T.-S. Kim and
A. S. Minhas (2017). Wearable Internet of Things-from
human activity tracking to clinical integration. 2017
39th Annual International Conference of the IEEE
Engineering in Medicine and Biology Society (EMBC),
IEEE.
Lee, I. and K. Lee (2015). "The Internet of Things (IoT):
Applications, investments, and challenges for
enterprises." Business Horizons 58(4): 431-440.
Mocnej, J., W. K. Seah, A. Pekar and I. Zolotova (2018).
"Decentralised IoT architecture for efficient resources
utilisation." IFAC-PapersOnLine 51(6): 168-173.
Pol, M. C., G. ter Riet, M. van Hartingsveldt, B. Kröse and
B. M. Buurman (2019). "Effectiveness of sensor
monitoring in a rehabilitation programme for older
patients after hip fracture: a three-arm stepped wedge
randomised trial." Age and ageing.
Salunke, P. and R. Nerkar (2017). "IoT driven healthcare
system for remote monitoring of patients." International
journal for modern trends in science and technology
3(6): 100-103.
Sharma, A., A. Purwar, Y.-D. Lee, Y.-S. Lee and W.-Y.
Chung (2008). Frequency based classification of
activities using accelerometer data. 2008 IEEE
international conference on Multisensor Fusion and
Integration for Intelligent Systems, IEEE.
ThingSpeak. "ThingSpeak." Retrieved 12 December 2019,
from http://www.thingspeak.com
Verma, S., Y. Kawamoto, Z. M. Fadlullah, H. Nishiyama
and N. Kato (2017). "A survey on network
methodologies for real-time analytics of massive IoT
data and open research issues." IEEE Communications
Surveys & Tutorials 19(3): 1457-1477.
ICT4AWE 2020 - 6th International Conference on Information and Communication Technologies for Ageing Well and e-Health
68
