
Machine Learning based Malware Traffic Detection on IoT Devices using
Summarized Packet Data
Masataka Nakahara, Norihiro Okui, Yasuaki Kobayashi and Yutaka Miyake
KDDI Research, Inc., 3–10–10, Iidabashi, Chiyoda-ku, Tokyo, Japan
Keywords:
IoT Security, Anomaly Detection, Machine Learning.
Abstract:
As the number of IoT (Internet of Things) devices increases, the countermeasures against cyberattacks caused
by IoT devices become more important. Although mechanisms to prevent malware infection to IoT devices
are important, such prevention becomes hard due to sophisticated infection steps and lack of computational
resource for security software in IoT devices. Therefore, detecting malware infection of devices is also impor-
tant to suppress malware spread. As the types of IoT devices and malwares are increasing, advanced anomaly
detection technology like machine learning is required to find malware infected devices. Because IoT devices
cannot analyze own behavior by using machine learning due to limited computing resources, such analysis
should be executed at gateway devices to the Internet. This paper proposes an architecture for detecting mal-
ware traffic using summarized statistical data of packets instead of whole packet information. As this proposal
only uses information of amount of traffic and destination addresses for each IoT device, it can reduce the
storage space taken up by data and can analyze number of IoT devices with low computational resources.
We performed the malware traffic detection on proposed architecture by using machine learning algorithms of
Isolation Forest and K-means clustering, and show that high accuracy can be achieved with the summarized
statistical data. In the evaluation, we collected the statistical data from 26 IoT devices (9 categories), and
obtained the result that the data size required for analysis is reduced over 90% with keeping high accuracy.
1 INTRODUCTION
The number of electronic devices that can be con-
nected to the Internet (Internet of Things) is rapidly
increasing, with 8.4 billion devices to be connected
by 2020 and 20.4 billion devices to be connected by
2022 (Hassija et al., 2019). While IoT devices pro-
vide useful functions in people’s lives, security mea-
sures are not sufficient compared to personal comput-
ers or smartphones, which have been the main termi-
nals connected to the Internet so far. For example, in
2016, a malware botnet consisting of 2.5 million IoT
devices was constructed by Mirai, and a DDoS (Dis-
tributed Denial of Service) attack occurred. In addi-
tion, Mirai’s source code has been published, and at-
tacks by variant malwares based on it have been gen-
erated one after another.
As countermeasures for threats to IoT devices, se-
curity vendors provide various solutions. These solu-
tions have functions for preventing infection, such as
preventing intrusion attempts and preventing access to
malicious sites using a blacklist. On the other hand,
existing solutions have limitations. For example, in
the case of security software for a home network, it
can only detect DoS attacks using TCP packets, and
those using UDP cannot be detected. Also, it can-
not detect communications that attempt to spread in-
fection like host scans or communications with C&C
(Command and Control) servers that give commands
to infected devices. As described above, there are
still many problems in detecting malware infection of
IoT devices, and many studies for improving accuracy
have been conducted.
One of the reasons why it is difficult to detect
malware infections in IoT devices is the limitation
of the processing performance of the device (Zhang
et al., 2014; Nguyen et al., 2019). Conventional de-
vices such as PCs, servers, and smartphones are well-
developed with anti-virus software and intrusion de-
tection systems (Bekerman et al., 2015; Canfora et al.,
2015). On the other hand, IoT devices have low pro-
cessing power, it is difficult to detect infections in
real time on each device using conventional methods.
Therefore, it is necessary to have a mechanism that
can collect and analyze packets not by the IoT device
itself but by other equipment. Therefore, packet ag-
78
Nakahara, M., Okui, N., Kobayashi, Y. and Miyake, Y.
Machine Learning based Malware Traffic Detection on IoT Devices using Summarized Packet Data.
DOI: 10.5220/0009345300780087
In Proceedings of the 5th International Conference on Internet of Things, Big Data and Security (IoTBDS 2020), pages 78-87
ISBN: 978-989-758-426-8
Copyright
c
2020 by SCITEPRESS – Science and Technology Publications, Lda. All rights reserved

gregation and analysis may be performed at the home
gateway through which IoT device packets flow to
the Internet (Nguyen et al., 2019; Santoso and Vun,
2015). However, the home gateway cannot execute
high-load processing such as packet payload analy-
sis due to restrictions on the processing performance.
From the above, it is desirable to detect malware in-
fection of IoT devices under the constraints of low
load on the home gateway.
In this paper, an anomaly detection system that
satisfies such requirements is proposed. The proposed
system converts packets passing through the home
gateway into statistical data, sends them to the analy-
sis server, and detects anomalies at the analysis server.
Sending all packets that pass through the home gate-
way to the analysis server, including the payload, is
not realistic from the viewpoint of processing load
and traffic. However, statistical data is lightweight
and can be sent to the analysis server. But an issue is
whether or not anomalies can be detected accurately
based only on statistical data.
Therefore, in this paper, we focused on the behav-
ior of IoT devices before and after malware infection.
By learning the behavior of IoT devices before mal-
ware infection, we could detectt malware traffic be-
havior. We then evaluated the anomaly detection per-
formance.
The contributions of this paper are followings:
• System architecture applicable for home network
anomaly detection.
• Anomaly detection using lightweight data and un-
supervised algorithm.
• Experiments for various type of IoT devices and
malwares.
2 BACKGROUND
In this section, as a background to this paper, we in-
troduce the trend of IoT security and malware, and
related works.
2.1 IoT Security
Currently, IoT devices are spreading rapidly and the
number of devices is increasing. Compared to PCs
or smartphones that have been connected to the In-
ternet, there are many different types of IoT devices.
Therefore, security measures need to be taken from
various viewpoints (Zhang et al., 2014; Hassan et al.,
2019). For example, in the case of a smart camera
installed in the home, measures against data leakage
are important from the viewpoint of privacy protec-
tion. For devices equipped with Android OS, it is
necessary to deal with Android vulnerabilities as well
as software vulnerabilities. In addition, the common
problem with many devices is authentication. There
are many cases where passwords are broken because
the password has not been changed by the user on a
device that is set with a simple password at the time of
shipment. And malware is considered as the biggest
threat. IoT devices often have lower processing capa-
bility than existing devices, and it may not be possible
to secure the resources necessary for the original pro-
cessing due to the operation of malware. Also, as rep-
resented by the large-scale DDoS attack by Mirai in
2016, various types of malware are currently appear-
ing and becoming threats. Therefore, many malware
detection methods have been studied.
2.2 Malware
The first IoT malware was Linux.Darlloz, discov-
ered by Symantec in 2013 (Zhang et al., 2014).
Linux.Darlloz is a worm that spreads by accessing a
randomly generated IP address using a list of com-
monly used IDs and passwords and downloading
samples. Not only did Linux-based surveillance cam-
eras become infected and privacy protection problems
became apparent, but subsequently another OS-based
variant such as Android also emerged, so the impor-
tance and urgency of malware countermeasures in IoT
security were increased.
The most representative malware for IoT is Mirai,
which appeared in 2016 (Kolias et al., 2017). Like
Darlloz, Mirai uses a list of frequently used IDs and
passwords to spread and construct a botnet that oper-
ates in response to commands from the C&C server.
The IoT device that becomes part of the botnet re-
ceives instructions from the C&C server and conducts
further infection spread and DDoS attacks. In October
2016, attacks on websites with 620Gbps traffic and
attacks on cloud hosting services with 1.1Tbps traffic
occurred almost simultaneously. Later, Mirai’s source
code was published, and variants such as Hajime also
appeared. While Mirai is a centralized architecture,
Hajime is a distributed architecture, making it more
difficult to detect malicious behavior. As countermea-
sures against malware infection, manual countermea-
sures such as frequently changing passwords are also
taken, but there are limits to the number of IoT de-
vices that continue to increase, and many automatic
countermeasures are being considered.
Machine Learning based Malware Traffic Detection on IoT Devices using Summarized Packet Data
79

2.3 Related Works
There are two types of malware countermeasures in
IoT security: a method to prevent infection and a
method to detect behavior after infection. Of these,
the security products for home networks are currently
being distributed to prevent infection. For example, if
the user tries to access a malicious site such as a mal-
ware download destination, it can be blocked. On the
other hand, detection of behavior after infection is not
sup- ported by currently distributed security products.
In addition, malware infection routes are diverse, and
it is difficult to take countermeasures just by prevent-
ing infection, and quick detection after infection is
required. Therefore, a lot of researches on behavior
detection after infection are carried out.
For example, (Mizuno et al., 2017) distinguish de-
sign and malware from a HTTP header using machine
learning like SVM (Support Vector Machine), Ran-
dom Forest, and deep learning. In (Su et al., 2018),
a DDoS attack is detected using CNN (Convolutional
Neural Network) by translation binary to an 8bit se-
quence and gray scale image. In (Alam and Vuong,
2013), Mirai scan, affection, and attack are detected
using Random Forest and Ada Boost. (Meidan et al.,
2017) recognizes which IoT device sends captured
data using Random Forest and GBM (Gradient Boost-
ing Machine). Furthermore, there are many studies of
anomaly detection with supervised machine learning
algorithms such as (Madeira and Nunes, 2016; Hasan
et al., 2019; Doshi et al., 2018; Zolanvari et al., 2019;
Kumar and Lim, 2019; Ding and Fei, 2013).
As introduced above, there are many researches
that analyze IoT device communication by machine
learning, but most of these use overall packet or super-
vised learning which have anomalies in training data.
On the other hand, for anomaly detection on a home
network, it is difficult to use overall packets includ-
ing payload because of the restriction of processing
resources of the home gateway. If the user’s devices
were not infected by malware, the anomaly packet is
not included in the training period, so unsupervised
learning is required. In order to detect anomalies with
unsupervised learning, we need to focus on benign
packets and learn their features. IoT device behavior
is relatively limited, so learning normal behavior for
each device enables us to detect anomalies without a
supervisor.
Considering the above, we propose an anomaly
detection system for the home network under the fol-
lowing conditions:
• Overall packet is not used.
• Unsupervised learning is used.
• Normal behavior is learned for each device.
3 PROPOSED SYSTEM
This section presents the proposed system for home
network anomaly detection system. Figure 1 is an
overview of the proposed system.
3.1 Home Gateway
IoT devices are connected to the home network,
and each device sends packets to the public network
through the home gateway. For example, a certain
camera device sends the state of the home to an ex-
ternal server at regular intervals, and the state of the
home can be confirmed from outside through a smart-
phone. Separately, it has communication to confirm
the presence of the firmware update. All these com-
munications go through the home gateway, so if the
home gateway has a packet monitoring function, de-
tecting an anomaly in the behavior of IoT devices is
possible.
However, as described in Section 1, it is impos-
sible to inspect all the packets in detail on the home
gateway due to resource restriction. Therefore, the
proposed system aggregates statistical data of pack-
ets, and reduces the processing load of the home gate-
way. An example of the statistical data is shown in
Table 1.
During one statistical cycle, all packets with the
same source and destination MAC address, IP ad-
dress, and port number are aggregated into a single
record. This record is called the statistical record. In
a statistical record, “count” shows the number of ag-
gregated packets, and “length” shows the summation
of the length of aggregated packets. In this example,
the statistical cycle is 10 seconds. The record on the
first line indicates that 294 bytes of packets are being
sent in 10 seconds for one combination of source and
destination. As the records in the 4th and 5th lines
show, even if the statistical period is the same, if it
is sent to another address or port, it will be another
record.
The statistical cycle can be adjusted considering
the processing load of the home gateway. The shorter
the statistical cycle becomes, the more the processing
load increases, but anomalies can be detected earlier.
In this paper, the statistical cycle is set to 10 seconds
so that attacks such as DoS and Hostscan could be
detected early.
In the proposed system, these statistical packet
records are sent to the analysis server in every sta-
tistical period. The analysis server detects anomalies
for each received record, and if an anomaly record
is found, notification is sent to the home gateway. If
the home gateway receives an anomaly notification, it
IoTBDS 2020 - 5th International Conference on Internet of Things, Big Data and Security
80
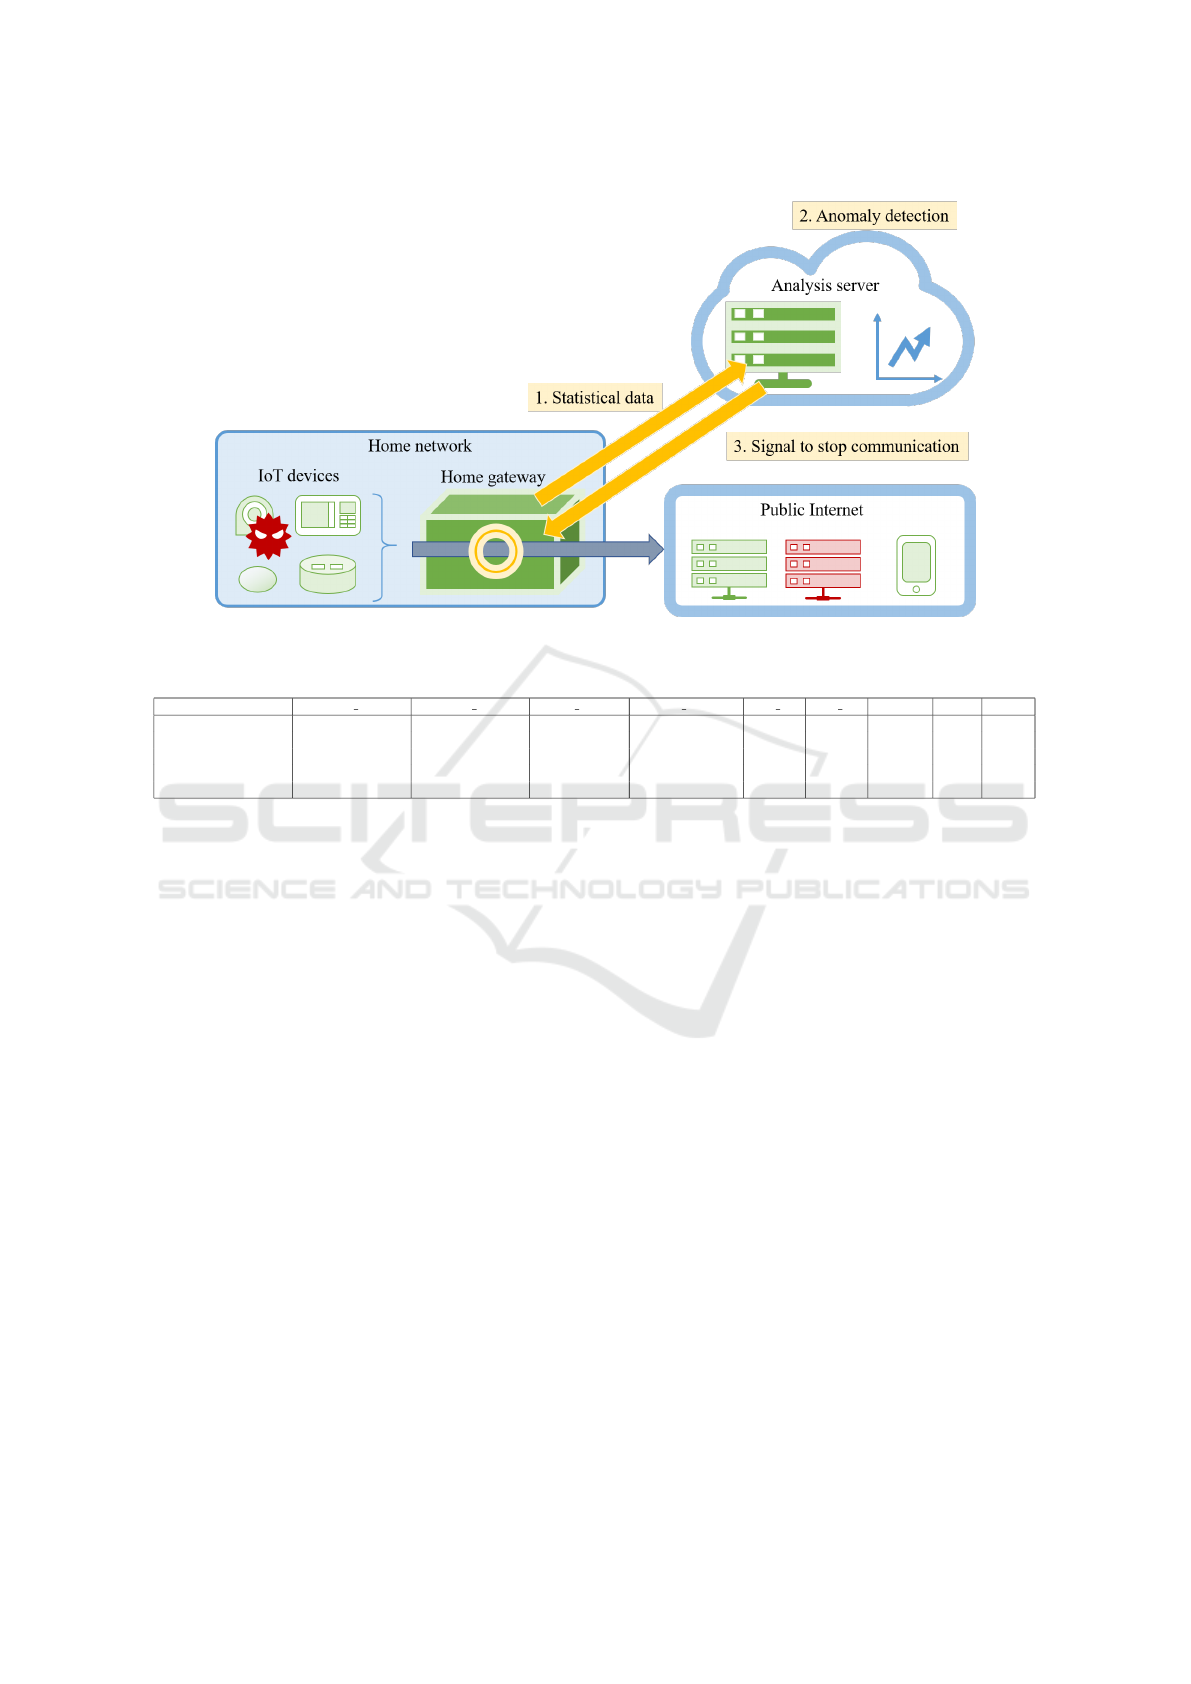
Figure 1: System model.
Table 1: An example of statistical information of packets.
Timestamp mac src mac dst ip src ip dst port src port dst protocol count length
2019-06-30 15:00:10 a1:b1:c1:d1:e1:f1 a3:b3:c3:d3:e3:f3 192.168.1.121 239.255.255.xxx 48993 1900 udp 2 294
2019-06-30 15:00:10 a2:b2:c2:d2:e2:f2 a4:b4:c4:d4:e4:f4 192.168.1.122 239.255.255.yyy 48993 1900 udp 1 76
2019-06-30 15:00:10 a2:b2:c2:d2:e2:f2 a4:b4:c4:d4:e4:f4 192.168.1.122 239.255.255.yyy 8883 53612 tcp 1 91
2019-06-30 15:00:20 a2:b2:c2:d2:e2:f2 a4:b4:c4:d4:e4:f4 192.168.1.122 239.255.255.yyy 8883 53612 tcp 1 156
2019-06-30 15:00:20 a2:b2:c2:d2:e2:f2 a5:b5:c5:d5:e5:f5 192.168.1.122 239.255.255.zzz 48993 1900 udp 1 173
sends notification to the user or stops communication
of the device, and so forth.
3.2 Analysis Server
The analysis server receives statistical data processed
by the home gateway as described in Section 3.1, and
detects anomaly packets. Since the analysis server
is deployed outside the home network, such as in
the cloud, processing with a heavy load that can-
not be performed by the home gateway can be per-
formed. Thus, we used the machine learning ap-
proach in anomaly detection on the analysis server.
For a certain period after the device is connected
to the home network, the home gateway sends statis-
tical data to the analysis server as training data. At
this point, we assume that the device is not infected
by malware during the training period and only the
device’s original communication is performed. Using
training data, the analysis server learns benign com-
munication of the device, and creates the model. Con-
crete features and learning algorithms are described in
Section 4.
After the training period, the home gateway
sends statistical data for detection, and the analysis
server judges whether the received data are benign or
anomalous. If anomaly records are found, it notifies
the home gateway.
4 DETECTION METHOD
This section presents anomaly detection on the analy-
sis server which is described in Section 3.
4.1 Feature Vector
As described in Section 3, in this paper, we use ma-
chine learning for anomaly detection on the analysis
server. For machine learning, we need to generate fea-
ture vectors from statistical data sent from the home
gateway. In this paper, 21 dimensional features are
generated from the destination IP address, number of
packets, protocol, etc. included in the statistical data.
Description of the features are shown in Table 2.
Thresholds of the “Num of packets” and “Length
of packets” have several variations. The num-
ber of packets is below average, average+standard
deviationσ, average+2σ, average+3σ, and more than
average+3σ. Length thresholds are set as the same.
In order to clarify the features of each record, each
feature was encoded as a binary value of 0 or 1. For
Machine Learning based Malware Traffic Detection on IoT Devices using Summarized Packet Data
81

Table 2: Feature vectors.
Feature Definition
Dest IP Destination IP address is included in dictionary data.
Dest IP (24bit) The first 24 bit of destination IP is included in dictionary data.
Dest port Destination port is included in dictionary data.
Dest IP&port pair Pair of destination IP and port is included in dictionary data.
Well known port Destination port number is below 1024.
Protocol Protocol is TCP.
Has response It has same source IP& port pair as destination IP& port pair.
Response count The number of response packets is larger than the record.
Response length The length of response packets is larger than the record.
Has similar packet There are different packets only for the destination port or source port.
Num of packets The number of packets is below threshold
Length of packets The length of packets is below threshold
Outbound It is from internal network to outside.
example, in the case of Dest IP, a method of linking
one number to one address is also conceivable. How-
ever, the linked number and the address value have no
relation, so it leads to erroneous learning. Therefore,
we used one hot encoding with the definitions shown
in Table 2.
As for Dest IP or port, we created a list of desti-
nations during a particular period, and if the IP in one
record is included in the list, Dest IP of the record is
set to 1, otherwise, 0. Here, the list is called a dictio-
nary data, and the period used to create the dictionary
data is called the dictionary period. The dictionary
period is different from the training term of machine
learning. It is a part of the training term or a period be-
fore the training term. By using the dictionary period,
it becomes possible to train considering the jitter of
destination during the training term, and it contributes
to reduction of the false detection rate. For example,
in the case of a smart speaker, it is assumed to com-
municate with a new destination because of new us-
age even if it is a benign communication. Unless it is a
dictionary period, the benign communication with the
new destination can be judged as an anomaly. How-
ever, using the dictionary period, it becomes possible
to learn the communication with the new destination
as benign behavior because there are both communi-
cations that are included in the dictionary data and
that are not included during the training term. Thus
we adopted the dictionary period for generating fea-
tures.
4.2 Classifier
Based on the features generated above, the analysis
sever distinguishes between benign and anomalous
statistical records. One method adopted in this paper
is Isolation Forest. Isolation Forest builds an ensem-
ble of trees for a given data set, then anomalies are
detected as instances which have short average path
lengths on the trees (Liu et al., 2008). The depth of the
trees means the number of partitions required to sepa-
rate instances. Anomaly instances should be far from
other instances, so a smaller number of partitions is
needed and path length on the tree is short. Isola-
tion Forest focuses on the property whereby anoma-
lies have attribute-values that are very different from
those of normal instances. Therefore, it matches our
approach that creates a model from the normal behav-
ior of IoT devices.
Isolation Forest can detect anomaly from test data
even if anomaly data is not included in the training
term. Other algorithms need anomaly data in the
training term because they classify test data based on
classes that appeared in the training term. Further-
more, as Isolation Forest works at high speed, we
adopted Isolation Forest in this paper.
Isolation Forest has the following parameters: the
sub-sampling size and the number of trees. Accord-
ing to (Liu et al., 2008), even if the number of trees
were larger than 10, average path length means the
anomaly score would not greatly change, so we set
the numbers of trees as 10. As for the sub-sampling
size, we used 10, 50, 90 and 100% of each of the sta-
tistical records. As a result, the case of 90% showed
the best performance, so the results shown on follow-
ing session is those of 90%.
4.3 Clustering
As for unsupervised learning, clustering is still one of
the popular algorithms for classification tasks. Clus-
tering groups similar data into partitions which are
called clusters and several algorithms are proposed.
We selected K-Means clustering (MacQueen et al.,
1967) which is one of the most popular clustering
methods and applied it to anomaly detection.
In the training phase, clusters of normal data are
created from train data which contains only benign
IoTBDS 2020 - 5th International Conference on Internet of Things, Big Data and Security
82
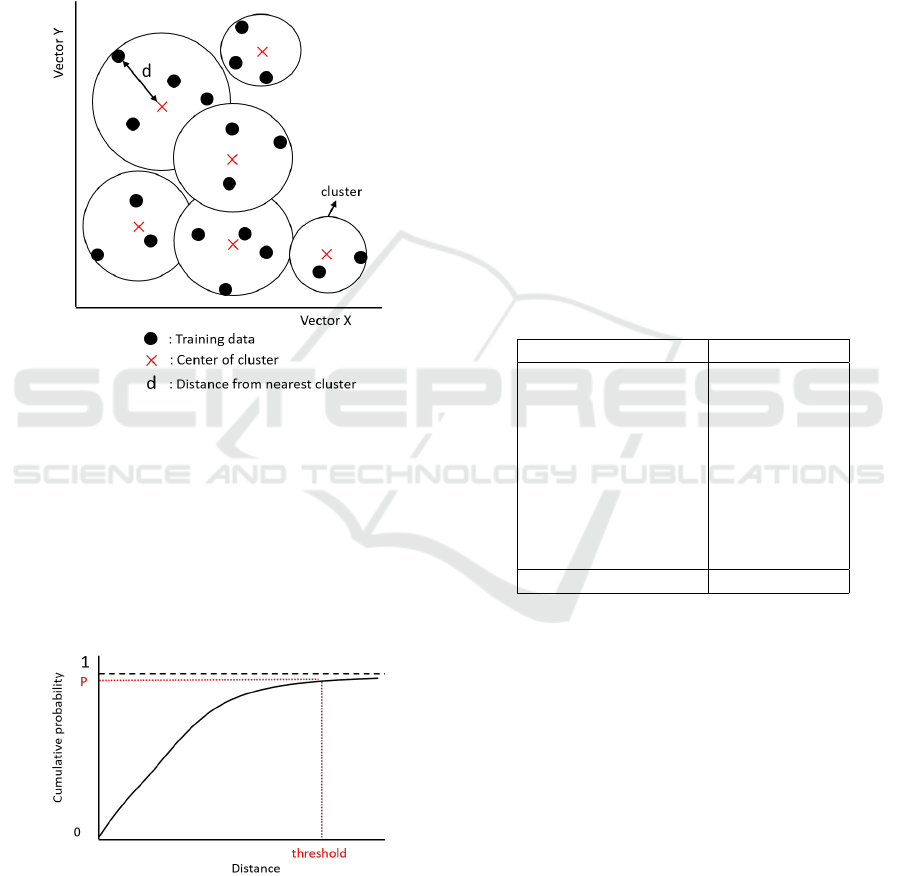
data. Since packet contents differ from device to de-
vice, cluster configurations such as the size of each
cluster or the number of clusters also differ from de-
vice to device. The training phase is shown in Figure
2.
In the case of K-Means, the number of clusters
is needed to set as a parameter before the training
of K-Means and we use silhouette score (Rousseeuw,
1987) to determine the best number of clusters.
Figure 2: Training phase of K-Means.
After the training phase, we calculate distances
between each data and the center of the nearest clus-
ter from the data. One of the distances is indicated by
d in Figure 2. The distance included up to a certain
value of cumulative probability is used as a threshold
to separate benign data and anomaly data. The val-
ues also differ from device to device. P indicates the
values in Figure 3.
Figure 3: Threshold of Distance.
In the test phase, the distance between each data
and the center of the nearest cluster from the data is
calculated. If the distance is farther than the threshold,
the data is regarded as anomaly data.
5 PERFORMANCE EVALUATION
This section presents how to evaluate the performance
of the proposed anomaly detection system and its re-
sults.
5.1 Evaluation Data
In order to evaluate the performance of anomaly de-
tection, both benign and anomaly communication are
required. In this section, we describe how to prepare
each data.
5.1.1 Benign Data
For benign data, we operated actual IoT devices about
twice a week, and captured their packets. For exam-
ple, in the case of a smart camera, we took or browsed
a picture through a smart phone, and in the case of a
smart speaker, we listened to the weather of the cur-
rent location or ask translation of some words. The
categories of the IoT device are shown in Table 3.
Table 3: IoT device list.
Category No. of devices
Smart camera 7
Smart speaker 5
IoT device controller 4
Door phone 3
Environment sensor 2
Light 2
Cleaner 1
Smart TV 1
Remote controller 1
Total 26
In our experiment environment, there are some
gateways. Some of these gateways are associated with
the IoT device and they translate the IoT device’s
specific communication protocol into an IP packet.
These gateways are categorized as the original device.
For example, the category “Door phone” includes the
actual door phone and gateway for the door phone.
Other gateways integrate communications of several
IoT devices, and they are categorized as the “IoT de-
vice controller”.
For our evaluation, one-month data was extracted
from the captured packets, and processed into statis-
tical records as described in Section 3. Among them,
the statistical records for the first two weeks were
used as training data, and the remainder were com-
bined with the anomaly communications as test data.
The dictionary period described in Section 4 is set as
the first week in ther training term.
Machine Learning based Malware Traffic Detection on IoT Devices using Summarized Packet Data
83
Here, the size of raw packet data is 42GB. It in-
cludes packets of 26 devices for one-month. After
processing into statistical records, the data size was
reduced to 2.9GB. We succeeded in reducing the data
size by 93%.
5.1.2 Anomaly Data
As anomaly data, we created packets and their sta-
tistical records that simulate the major behavior of
malware in IoT devices; communication with a C&C
server, host scan, and DoS attack. Simulated mal-
wares are shown in Table 4.
Table 4: Malware list.
Type Cycle No. of records
0.33[sec] 56506
1[min] 43287
C&C 1[hour] 721
12[hour] 61
24[hour] 31
Type No. of dest per sec No. of records
100 120000
200 120000
Host scan 500 120000
1000 120000
3000 120000
Type No. of packets per sec No. of records
100 103740
500 103740
DoS 1000 103740
1500 103740
3000 103740
In order to evaluate the performance of detection
in detail, we created 5 patterns for each type of behav-
ior so that the detection difficulty differed.
As for C&C, the cycle of communication is var-
ied. For a host scan, the number of scan targets is
varied. The values in the above table shows the num-
ber of targets in one second. As for DoS, the number
of packets is varied.
At the timing of evaluation, one of these 15 types
of malware behaviors is selected and combined into
benign communication of test data, and it is deter-
mined whether the system can detect an anomaly cor-
rectly or not.
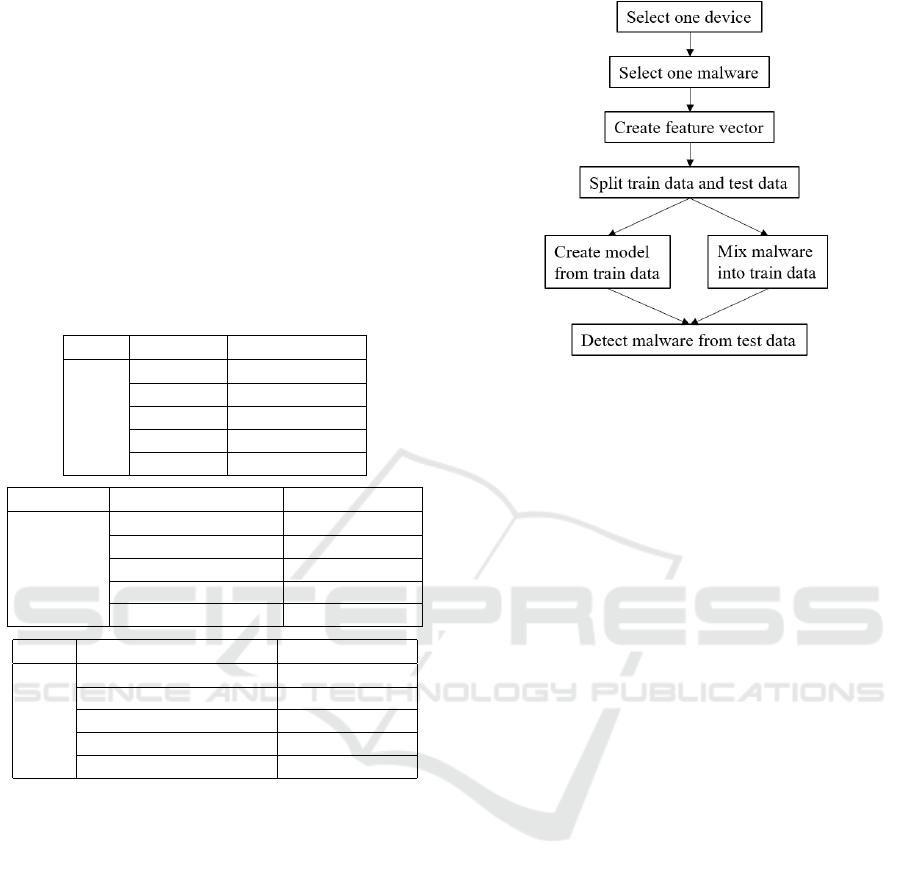
5.2 Evaluation Flow
The evaluation flow is shown in Figure 4.
First, normal communications of the IoT devices
and malware communications are prepared as de-
Figure 4: Evaluation flow.
scribed above. Next, we extracted all communica-
tions of one device and all communications of one
malware from the input data. At this time, 0 is as-
signed to the record of normal communication and 1
is assigned to the record of abnormal communication
as correct labels for training and accuracy evaluation.
Then, we created features using the IP address and
protocol and so on as described in Section 4. After
that, these data were divided into training data and
test data, and a model is generated from the train-
ing data. Malware communications were then mixed
into the test data, and created a state where the device
was infected with malware. Test data was input to
the model, and it was judged whether each statistical
record is benign or anomalous.
Next, the malware to be mixed was changed to
another type and the above operation was performed.
For example, if C&C communication with a commu-
nication cycle of 0.33s was targeted, C&C commu-
nication with another cycle or the host scan will be
mixed instead. The above operation was repeated for
all the devices to be evaluated, and the detection re-
sults were obtained.
The detection results were obtained in the form of
a confusion matrix. Here, the anomaly to be detected
is Positive, and benign is Negative. For the evalua-
tion metric, we used TPR (True Positive Rate), FPR
(False Positive Rate), and MCC (Matthew’s Correla-
tion Coefficient). MCC is a metric used for prediction
accuracy evaluation when the ratio of normal data and
abnormal data is unbalanced (Matthews, 1975). In
this evaluation, we used many types of devices and
malwares, and in many cases, the number of data is
unbalanced. For example, in the case of a device with
a small number of communications, the ratio of ab-
normal communication becomes large, so even if all
IoTBDS 2020 - 5th International Conference on Internet of Things, Big Data and Security
84

communications are judged abnormal, the accuracy
increases. Therefore, we used MCC instead of preci-
sion or accuracy. MCC takes a value of 1 if the predic-
tion results are all correct and -1 if they are all incor-
rect. Using TP (True Positive), FN (False Negative),
FP (False Positive), TN (True Negative) in the confu-
sion matrix, these metrics are defined as the following
equations:
• T PR =
T P
T P + FN
• FPR =
FP
FP+ T N
• MCC =
(T P × T N) − (FP × FN)
p
(T P + T P) × (T P + FN) × (T N + FP) × (T N +FN)
5.3 Evaluation Result for Isolation
Forest
First, we mixed one smart camera with C&C commu-
nication whose cycle is 0.33 seconds. The result of
anomaly detection is shown in Table 5.
Table 5: Result of C&C detection from one smart camera.
Prediction
Malware Benign
Answer Malware 56506 0
Benign 1587 115714
The number of records of the original device is
117301, and that of malware is 56506. Here, TPR is
1 and FPR is 0.014. As the MCC is 0.980, it indicates
a high detection accuracy even when data imbalance
is taken into account.
Next, the above evaluation was performed on 15
types of malware and 26 devices, and the results of
averaging TPR and FPR in each device for each mal-
ware type are shown in Table 6.
Time Evaluation. Anomaly detection should finish
within the statistical cycle. In this paper, the statis-
tical cycle is 10 seconds, so detection should finish
within 10 seconds. Then, we measured the detection
time for data in which the normal communication of
each device was mixed with host scan communica-
tion with 3000 destinations per second. As the tar-
get, we chose 10 seconds with the highest number of
statistical records during the test period. And consid-
ering the specification of the statistical record which
counts communications with different destinations as
different records, host scan has the largest number of
records in malware behavior. The number of target
records is 30,027 on average per device. As a result,
the maximum time to detect for one device was 0.37
Table 6: Result of detection for all devices.
Type Cycle TPR FPR
0.33s 1.000 0.078
1m 0.965 0.078
C&C 1h 0.965 0.078
12h 0.977 0.078
1d 0.965 0.078
Type No. of dest per sec TPR FPR
100 1.000 0.078
500 1.000 0.078
Host scan 1000 1.000 0.078
1500 1.000 0.078
3000 1.000 0.078
Type No. of packets per sec TPR FPR
100 1.000 0.078
200 1.000 0.078
DoS 500 1.000 0.078
1000 1.000 0.078
3000 1.000 0.078
seconds, and total time for all devices was 3.22 sec-
onds, indicating the possibility of detection within the
statistical cycle.
Accuracy Evaluation. As for TPR, results of the
host scan and DoS are 1, so all malwares are detected.
As for C&C, TPR is over 0.95, but did not achieve 1.
As for FPR, all the results are the same, because
the benign records are common. They are 0.078, but
it is higher than the result of Table 5. The average
MCC was 0.755, because there are many false pos-
itive on some devices. So it is doubtful that a suc-
cessful model can be generated only in particular con-
ditions. Then, in order to evaluate each device, the
detection results of all malware were aggregated for
each device type. Average TPR and FPR are shown
in Table 7.
Table 7: Result of malware detection for each device type.
Device type No. of dev TPR FPR
Smart camera 7 1.000 0.033
Smart speaker 5 1.000 0.163
IoT device controller 4 0.945 0.062
Door phone 3 1.000 0.066
Environment sensor 2 0.999 0.055
Light 2 1.000 0.108
Cleaner 1 1.000 0.034
Smart TV 1 1.000 0.128
Remote controller 1 1.000 0.037
This result shows that malwares can be detected
on many devices with high TPR, but smart speakers
and smart TV are higher FPR. These devices have
many patterns of behavior, so it is difficult to distin-
guish malwares and new benign behavior.
Machine Learning based Malware Traffic Detection on IoT Devices using Summarized Packet Data
85

5.4 Evaluation Result for K-means
Clustering
Subsequently, we performed the same evaluation as
above with K-means clustering. The results of aver-
aging TPR, FPR for 26 devices and 15 types of mal-
ware detection are shown in Table 8.
Table 8: Result of detection for all devices (K-means).
Type Cycle TPR FPR
0.33s 1.000 0.003
1m 0.999 0.003
C&C 1h 0.999 0.003
12h 0.997 0.003
1d 0.995 0.003
Type No. of dest per sec TPR FPR
100 0.856 0.003
500 0.856 0.003
Host scan 1000 0.856 0.003
1500 0.856 0.003
3000 0.856 0.003
Type No. of packets per sec TPR FPR
100 1.000 0.003
200 1.000 0.003
DoS 500 1.000 0.003
1000 1.000 0.003
3000 1.000 0.003
Time Evaluation. Similar to the Isolation Forest,
we measured the time for detection of records in 10
seconds.
Time required depends on the number of clusters:
the case of 40 clusters, the total time for detection of
all devices was 8.4 seconds. The average number of
clusters used here is 34, so it is also possible to detect
malware within the statistical cycle.
Accuracy Evaluation. FPR is 0.003, and it is much
better than the results of the Isolation Forest.
As for TPR, the results of DoS is 1, but host scan
result is lower than that of Isolation Forest. This can
be attributed to some devices having similar length
and count records as the host scan packets. Both
benign and anomaly records use a well-known port.
Therefore, the distance between benign and anomaly
records is shortened. On the other hand, for C&C,
TPR is over 0.99 even in the case of longer cycles.
The distance between C&C and benign records seems
to be long.
The average MCC is 0.816, which is higher than
that of the Isolation Forest. MCC of Isolation Forest
was low in C&C detection, but K-means succeeded
in detecting C&C without false positive, so MCC be-
came higher.
Next, the aggregated result of all malware detec-
tion for each device type is shown in Table 9.
Table 9: Result of malware detection for each device type
(K-means).
Device type No. of dev TPR FPR
Smart camera 7 0.915 0.002
Smart speaker 5 0.917 0.007
IoT device controller 4 1.000 0.0005
Door phone 3 0.972 0.0006
Environment sensor 2 0.958 0.0001
Light 2 0.958 0.0007
Cleaner 1 1.000 0.0002
Smart TV 1 1.000 0.025
Remote controller 1 1.000 0.0004
For almost all device types, FPRs are lower than
0.001. Only smart TV is higher than 0.01. As de-
scribed above, smart TV has many patterns of behav-
ior, so it is difficult to distinguish.
Finally, a comparison of the result between Isola-
tion Forest and K-means is summarized in Table 10.
Table 10: Comparison of two methods).
Isolation K-means
TPR O X
FPR X O
MCC X O
C&C detection X O
Host scan detection O X
DoS detection O O
Speed O O
Isolation Forest was better in TPR. On the con-
trary, FPR and MCC were much better in K-means.
C&C was difficult for Isolation Forest, but K-means
showed good detection. However, Isolation Forest
could detect the host scan better than K-means. Both
methods could detect DoS attack. Speed was suffi-
cient for detecting within the statistical cycle in both
methods.
6 CONCLUSIONS
In this paper, we proposed a system to detect the ab-
normalities of IoT devices in the home network by
sending the statistical information at the home gate-
way to the analysis server. Although the informa-
tion that used in anomaly detection is reduced in the
statistical information, we confirmed that anomalies
of many devices in the experiment can be detected.
Proposed system could reduce the data size required
for analysis over 90% and still able to achieve high
accuracy with Isolation Forest and K-means cluster-
ing. Future issues include improved detection per-
formance for more devices such as smart speakers or
IoTBDS 2020 - 5th International Conference on Internet of Things, Big Data and Security
86

smart TVs, improved detection performance for de-
vices with less data during the learning period, and
countermeasures when devices are infected with mal-
ware during the learning period. And the evaluation
of load and latency on the home gateway is important.
Additionally, the IoT traffic dataset we used in this pa-
per includes limited use case. If we use more realistic
dataset such as collected from several actual homes,
our proposed system becomes more significant.
REFERENCES
Alam, M. S. and Vuong, S. T. (2013). Random forest
classification for detecting android malware. In 2013
IEEE International Conference on Green Computing
and Communications and IEEE Internet of Things and
IEEE Cyber, Physical and Social Computing, pages
663–669. IEEE.
Bekerman, D., Shapira, B., Rokach, L., and Bar, A. (2015).
Unknown malware detection using network traffic
classification. In 2015 IEEE Conference on Communi-
cations and Network Security (CNS), pages 134–142.
IEEE.
Canfora, G., De Lorenzo, A., Medvet, E., Mercaldo, F.,
and Visaggio, C. A. (2015). Effectiveness of opcode
ngrams for detection of multi family android malware.
In 2015 10th International Conference on Availability,
Reliability and Security, pages 333–340. IEEE.
Ding, Z. and Fei, M. (2013). An anomaly detection ap-
proach based on isolation forest algorithm for stream-
ing data using sliding window. IFAC Proceedings Vol-
umes, 46(20):12–17.
Doshi, R., Apthorpe, N., and Feamster, N. (2018). Ma-
chine learning ddos detection for consumer internet of
things devices. In 2018 IEEE Security and Privacy
Workshops (SPW), pages 29–35.
Hasan, M., Islam, M. M., Zarif, M. I. I., and Hashem, M.
(2019). Attack and anomaly detection in iot sensors in
iot sites using machine learning approaches. Internet
of Things, 7:100059.
Hassan, W. H. et al. (2019). Current research on internet of
things (iot) security: A survey. Computer Networks,
148:283–294.
Hassija, V., Chamola, V., Saxena, V., Jain, D., Goyal, P., and
Sikdar, B. (2019). A survey on iot cecurity: Applica-
tion areas, security threats, and solution architectures.
IEEE Access, 7:82721–82743.
Kolias, C., Kambourakis, G., Stavrou, A., and Voas, J.
(2017). Ddos in the iot: Mirai and other botnets. Com-
puter, 50(7):80–84.
Kumar, A. and Lim, T. J. (2019). Edima: Early detection
of iot malware network activity using machine learn-
ing techniques. In 2019 IEEE 5th World Forum on
Internet of Things (WF-IoT), pages 289–294.
Liu, F. T., Ting, K. M., and Zhou, Z.-H. (2008). Isolation
forest. In 2008 Eighth IEEE International Conference
on Data Mining, pages 413–422. IEEE.
MacQueen, J. et al. (1967). Some methods for classification
and analysis of multivariate observations. In Proceed-
ings of the fifth Berkeley Symposium on Mathematical
Statistics and Probability, volume 1, pages 281–297.
Oakland, CA, USA.
Madeira, R. and Nunes, L. (2016). In 2016 Eleventh Inter-
national Conference on Digital Information Manage-
ment (ICDIM), pages 145–150.
Matthews, B. W. (1975). Comparison of the predicted and
observed secondary structure of t4 phage lysozyme.
Biochimica et Biophysica Acta (BBA)-Protein Struc-
ture, 405(2):442–451.
Meidan, Y., Bohadana, M., Shabtai, A., Guarnizo, J. D.,
Ochoa, M., Tippenhauer, N. O., and Elovici, Y.
(2017). Profiliot: A machine learning approach for
iot device identification based on network traffic anal-
ysis. In Proceedings of the Symposium on Applied
Computing, pages 506–509. ACM.
Mizuno, S., Hatada, M., Mori, T., and Goto, S. (2017).
Botdetector: A robust and scalable approach toward
detecting malware-infected devices. In 2017 IEEE
International Conference on Communications (ICC),
pages 1–7. IEEE.
Nguyen, T. D., Marchal, S., Miettinen, M., Fereidooni, H.,
Asokan, N., and Sadeghi, A.-R. (2019). D
¨
ıot: A
federated self-learning anomaly detection system for
iot. In 2019 IEEE 39th International Conference on
Distributed Computing Systems (ICDCS), pages 756–
767. IEEE.
Rousseeuw, P. (1987). Silhouettes: A graphical aid to the in-
terpretation and validation of cluster analysis. J. Com-
put. Appl. Math., 20(1):53–65.
Santoso, F. K. and Vun, N. C. (2015). Securing iot for smart
home system. In 2015 International Symposium on
Consumer Electronics (ISCE), pages 1–2. IEEE.
Su, J., Vasconcellos, V. D., Prasad, S., Daniele, S., Feng,
Y., and Sakurai, K. (2018). Lightweight classifica-
tion of iot malware based on image recognition. In
2018 IEEE 42nd Annual Computer Software and Ap-
plications Conference (COMPSAC), volume 2, pages
664–669. IEEE.
Zhang, Z.-K., Cho, M. C. Y., Wang, C.-W., Hsu, C.-W.,
Chen, C.-K., and Shieh, S. (2014). Iot security:
Ongoing challenges and research opportunities. In
2014 IEEE 7th International Conference on Service-
Oriented Computing and Applications, pages 230–
234. IEEE.
Zolanvari, M., Teixeira, M. A., Gupta, L., Khan, K. M.,
and Jain, R. (2019). Machine learning-based network
vulnerability analysis of industrial internet of things.
IEEE Internet of Things Journal, 6(4):6822–6834.
Machine Learning based Malware Traffic Detection on IoT Devices using Summarized Packet Data
87
