
Geolocation Prediction from Tweets: A Case Study of Influenza-like
Illness in Australia
Bingnan Li
a
, Zi Chen
b
and Samsung Lim
c
School of Civil and Environmental Engineering, University of New South Wales, Sydney, Australia
Keywords: Social Media, Geolocation Prediction, Tweets, Influenza-like Illness, Data Mining.
Abstract: Twitter has become an effective platform for gathering massive event-related data from growing popularity.
It provides an approach to monitoring and analysis of the emergence and devolvement of events. In the field
of data mining and social media analysis, geographic information is an important element to be factored in.
However, only nearly 2% of tweets contain accurate geographic information because of various concerns e.g.
complexity and privacy. In order to overcome this restriction, devising methods of geolocation prediction has
become the main topic in this filed. Geographic information plays a valuable role in responding to the control
and surveillance of epidemic diseases. In this study, we constructed a geolocation prediction method based
on potential location-related tweet metadata. Coordinate information can be calculated from the bounding box,
while location information can be extracted from the text content, the user’s location at the time of use and
the labelled place names using the Named Entity Recognition technique. Three types of coordinate sets of
Australian suburbs are defined and used to construct coordinates references from the place names. Models
with different parameters have been applied to predict geolocations of influenza-like illness from the tweets
of the 2019 flu season in Australia. The results show that the proposed models with four parameters perform
better than the existing models. When the area threshold is set to 4,500 km
2
, the best model can successfully
predict influenza-like illness with the mean error distance of 4.65 km and the median error distance of 2.57
km. Hence the proposed method is shown to enhance the geographic information associated with the tweets
and make the emergency response to influenza-like illness more effective and efficient.
1 INTRODUCTION
Over the last decade, with the development of the web
2.0, now the Internet is becoming a channel to spread
personal daily information instead of being used as an
information source (Prieto et al., 2014; Paul and
Dredze, 2011). Moreover, the technology of mobile
devices makes sending digital information easier.
Meanwhile, online social networks have experienced
an unprecedented development. The common social
media platforms such as Twitter and Facebook only
provide general services, but some other platforms
are specialized, e.g. location-based service (Gowalla
and Foursquare), photo sharing (Instagram, Pinterest
and Flickr), as well as other domains (Fitbit and
LinkedIn). Users with similar interests can develop
a
https://orcid.org/0000-0003-3417-3295
b
https://orcid.org/0000-0001-5100-8393
c
https://orcid.org/0000-0001-9838-8960
online friendship based on those platforms and share
their everyday lives with texts, pictures and videos.
Supported by previous researches (Steiger et al.,
2015; Prieto et al., 2014), Twitter outshines others for
social media analysis and events detection among
those online social networks, because of not only the
design itself, but also its wide basis of the masses. Its
monthly active users are almost 0.34 billion (23% of
cyber citizens) and daily generated tweets are as
many as 0.5 billion (Ahlgren, 2019). Different from
Instagram and Snapchat which attract mostly young
users, Twitter is widely used by different age groups
and around 63% of Twitter users are from 35 to 65
years old (Lin, 2019). The large amount of user-
generated contents provides more resources for data
mining in different fields (Prieto et al., 2014). Tweets
with accurate geolocation can provide immense
160
Li, B., Chen, Z. and Lim, S.
Geolocation Prediction from Tweets: A Case Study of Influenza-like Illness in Australia.
DOI: 10.5220/0009345101600167
In Proceedings of the 6th International Conference on Geographical Information Systems Theory, Applications and Management (GISTAM 2020), pages 160-167
ISBN: 978-989-758-425-1
Copyright
c
2020 by SCITEPRESS – Science and Technology Publications, Lda. All rights reserved

benefits to emergency response and monitoring.
Geolocation prediction of tweets can expedite the
rescue action in emergency events (Ajao et al., 2015).
With the development of GPS enabled devices,
users can share their locations with geographic
coordinates. However, due to the consideration of
inconvenience or privacy, most users choose to hide
this function (Huang et al., 2019). As Laylavi et al.
(2016) illustrated, only about 2% of tweets are geo-
tagged. Therefore, identifying geolocation of tweets
became an urgent problem to be solved in this
research field.
Timely geographic information plays a key role in
surveillance of epidemic disease (Allen et al., 2016;
Gao et al., 2018). In other words, surveillance of
epidemic disease needs information which is in real
time and from location with accurate or roughly
accurate coordinate information. Based on metadata,
every tweet contains its created time, while in most
cases does not contain its coordinates. Up-to-date
information without any geographic details can be
nearly useless for surveillance of epidemic disease.
Thus, discovering a new way to predict geolocation
can be a practicable plan.
With the development of Natural Language
Processing (NLP) and Named Entity Recognition
(NER) techniques, location entities can be extracted
from location related. Gazetteer of Australia and
digital boundaries of Australia are two ways to get
coordinates information of suburbs.
In this paper we developed models based on
different priorities of four location related attributes
(textual content, user location, labelled place and
bounding box) of tweets. All relevant information has
been fully used for the prediction of the geolocation
of tweets without geo-tagging.
Major contributions of the study can be outlined
in the following way: 1) exploring potential attributes
of location related information within a tweet and
extracting location entity information based on NER
technique; 2) three coordinate sets of suburbs are
provided to predict geolocation and models are
designed based on location related attributes.
The rest part of this paper is organized as follows.
Firstly, relevant research works are described in
Section 2. A brief introduction to the structure of
Twitter data and explanation of the proposed models
are provided in Sections 3 and 4, respectively. In
Section 5, a case study of influenza-like illness (ILI)
in Australia is introduced by applying the proposed
models. Finally, discussion, conclusion and
perspectives of future work are placed in Section 6.
2 RELATED WORKS
Even though Twitter users often mention geographic
information either by hand or GPS, sometimes it is
still incomplete and inaccurate. Various approaches
and algorithms have been utilized to increase the
accuracy of geolocation prediction. As techniques
such as machine learning, NLP, statistics as well as
GIS have matured, more and more breakthroughs
have been made in this field (Ajao et al., 2015).
In the past few years, various research works have
been studied in geolocation prediction of Twitter
data. Ajao et al. (2015) surveyed previous research
about geolocation prediction on Twitter and
summarized relevant methods as well as evaluation
metrics of inferring location on Twitter. Cheng et al.
(2013) discovered that only one fifth of Twitter users
in America show the city they live in their profiles,
and just one twentieth of them provide coordinate
information. However, Hecht et al. (2011) observed
that some self-described addresses of their profiles
are not accurate or even not valid, and only 0.77% of
tweets have geo-tagged information, while this value
is 0.4% in the observation of Ryoo et al. (2014). In
studies of Hawelka et al. (2014) and Priedhorsky et
al. (2014), they also provided the similar proportions
of tweets with geo-tags. Moreover, geolocation
prediction of tweets is the foundation of other social
media analysis and relevant studies, therefore, further
study of this field is necessary.
When users post tweets, they might add places in
the text and this information can help us understand
those contents. Chandra et al. (2011) have used the
textual content to predict the geolocation of tweets.
However, the issue that some users always mention a
place far away from where they are is described by
Ikawa et al. (2013) in their research. Abrol et al.
(2010) studied the social network relationships
among online friends. Information of user profiles
can also provide potential contributions for
geolocation prediction of tweets, as can be seen in the
studies of Backstrom et al. (2010) and Bouillot et al.
(2012).
As the NLP technique is fully developed, more
and more related techniques have been used in the
fields of information extraction and geolocation
prediction. Lingad et al. (2013) introduced NER and
part-of-speech tagging in their research. Li et al.
(2012) used machine learning and probabilistic
methods, and Takhteyev et al. (2012) used gazetteers
and location databases. Huang et al. (2019) applied
deep learning models to location prediction for
tweets.
Geolocation Prediction from Tweets: A Case Study of Influenza-like Illness in Australia
161
3 STRUCTURE OF TWITTER
Twitter allows users to update their statuses called
tweets. In the past, the limit of tweet characters was
140, but that limit has been increased to 280 in 2017.
Therefore, a tweet can provide more information than
before. The metadata of a tweet can provide rich
information which is invisible to normal users. Data
are collected from Twitter Application Programming
Interface (API) and stored in the format of JavaScript
Object Notation (JSON), which is easy to read by
humans and easy to parse by computers. JSON is built
on a collection of key/value pairs, and every specific
key is described by the relevant value. The structure
of Twitter consists of objects like Tweets, Users,
Geos and all of them are encoded in the JSON format.
In general, there are more than 150 attributes built in
every single tweet. But in our research, we only
choose attributes related to spatial and temporal
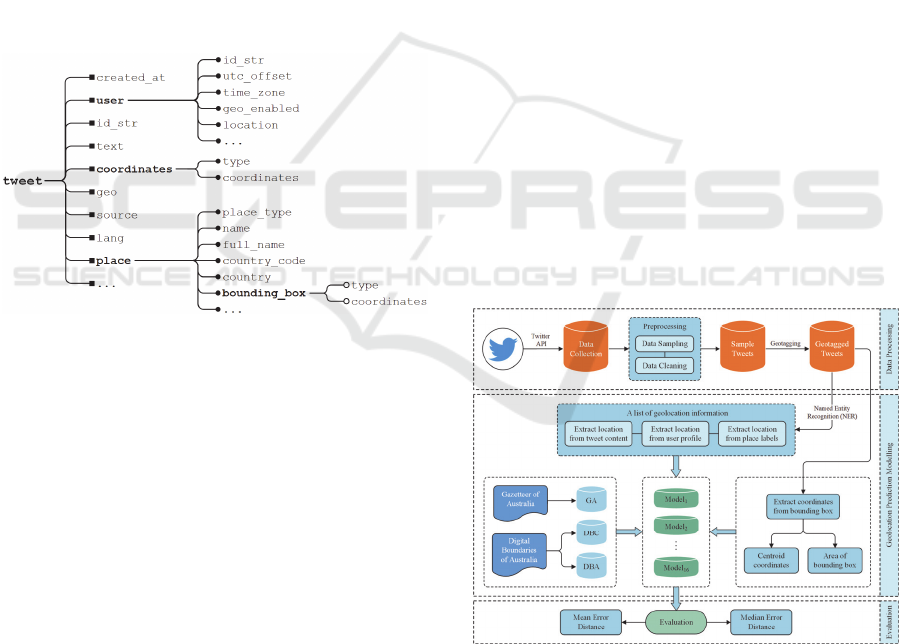
information which are shown in Figure 1.
Figure 1: Spatio-temporal attributes of a tweet.
From Figure 1, we can see that there are several
location related attributes in a tweet. The first one is
the field “location” of the attribute “user”. This field
is defined by users and shown on their profiles. It’s
not exactly accurate or machine-parseable. Therefore,
we should extract location related entities instead of
using it directly. Another geographic information
related field is called “geo_enabled” which indicates
whether the location information can be shown.
Both “coordinates” and “geo” can provide the
same information. They can represent the specific
longitude and latitude of the geographic location.
Since “geo” is a deprecated attribute for developers
as illustrated on the twitter official document, we use
“coordinates” field to obtain the accurate coordinate
information of a tweet.
Attribute of “place” has several fields related to
location information. “place_type” represents the
type of location of the place and typical values are
point-of-interest (POI), neighborhood, city, admin,
and country. As for POI, it means the place is a
specific location while the other four types contain a
certain area, thus we only use POI and neigborhood
in this research. “Name” and “full_name” provide
short and full readable names of the place.
“Country_code” and “country” represent shortened
country code and name of the country containing this
place. “Bounding_box” is a bounding box with
coordinates that encloses the place. This field
contains longitude and latitude of four points of the
bounding box.
4 METHODOLOY
Figure 2 illustrates the workflow of the design and
architecture of the proposed geolocation prediction
method. Firstly, we use Twitter API to collect the real
time tweets and then stored in text files. Following the
data processing phase, including data sampling and
data cleaning, we obtain a new geo-tagged sample
tweets dataset. Then location related information is
extracted from the textual content, user location and
place labelling by the NER technique. Combining the
place’s bounding box, a list of geolocation related
information is established. The last phase is the
geolocation prediction part, gazetteer of Australia and
information of Australian suburbs are used as a
database for geographic location query. Finally, 16
models are used to predict tweets’ geolocation and
two metrics are designed to evaluate those models.
Figure 2: Workflow of geolocation prediction for tweets.
4.1 Data Collection
Tweets can be collected from either commercial
companies or free access of Twitter API. Commercial
data vendors can provide both historical and real time
GISTAM 2020 - 6th International Conference on Geographical Information Systems Theory, Applications and Management
162
data, but very expensive. Twitter API can provide
free data collection but only for real time data which
means it takes several months to collect data. In our
study, we used Twitter API to collect real time tweets.
Data were collected during the 2019 Australian flu
season and we collected 4,802,808 unduplicated
tweets. The collected tweets are within the bounding
box of longitudes from 112°E to 154°E and latitudes
from 9°S to 44°S.
4.2 Data Pre-processing
4.2.1 Data Sampling
In this study, we designed a procedure for filtering out
unwanted tweets from our original dataset and obtain
a sample of dataset to apply to our models. There are
many tweets posted outside Australia, which should
be taken out of the dataset. Another issue of the
Twitter data is that there are many unrelated tweets,
such as commercials, advertisers, spambots and so
on. All the above accounts are usually operated in
computers, so we only kept tweets posted by mobile
devices and this can be done based on the attribute of
“source” (Laylavi et al., 2016; Singh et al., 2017). For
the next stage, we filtered out the tweets without geo-
tags which can be achieved based on the attribute of
“coordinates”. At the last stage, we find tweets related
to ILI and use a series of keywords to match textual
content of every tweet. To achieve this, term
frequency-inverse document frequency (TF-IDF) is
used to extract keywords from news reports about
Australian flu season 2019.
Supported by previous studies (Gao et al., 2018;
Signorini et al., 2011) and the TF-IDF technique, we
used keywords as follows: “flu”, “influenza”,
“cough”, “sore throat”, “fever”, “runny nose”, “stuffy
nose”, “headache” and “cold” to extract possible ILI-
related information. After data sampling, 1,730
corresponding tweets are retrieved from the collected
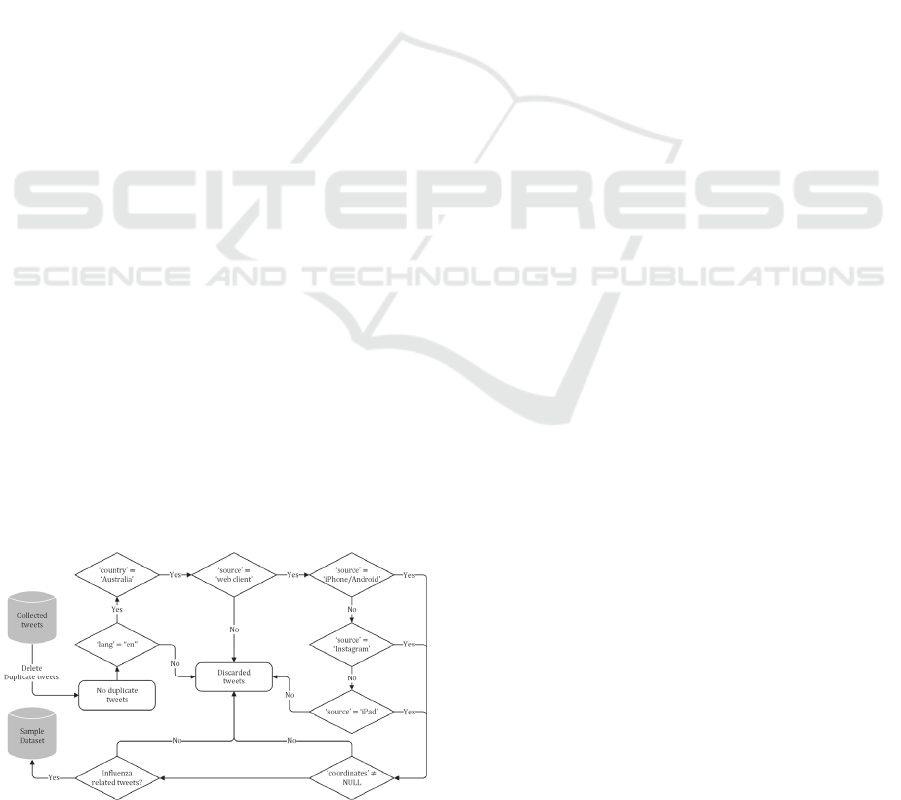
tweets. The whole process of data sampling is shown
in Figure 3.
Figure 3: Flowchart of Twitter data sampling.
4.2.2 Data Cleaning
The text of tweets contains various kinds of noises
such as emojis, hashtags, user mentions and URL
links, therefore, it is necessary to pre-process them at
first. Unnecessary punctuation marks were deleted,
and consecutive spaces were replaced with one.
Marks of users’ mentions and hashtags were also
deleted. Non-English letters and stop words were all
deleted, since they do not contain useful information
(Singh et al., 2017). This data cleaning method has
also been applied to location fields of user profile
since it can be freely modified by users.
4.3 Location Information Extraction
4.3.1 Named Entity Recognition
NER is a technique to identify and categorize
different kinds of entities such as locations, people or
organisations from the textural content. In the field of
NLP, it has been widely researched over the past
decade and achieved good performance in formal
text. However, it does not perform well on social
media messages such as tweets because those
messages tend to be more informal and NER tools are
normally built based on formal articles or reports
(Lingad et al., 2013). In this study, we introduced
tools of Stanford NER and spaCy to extract location
entity information from textual content, location of
user profile and place labels
4.3.2 Bounding Box
Unlike location related information, bounding box
contains specific longitudes and latitudes of four
points which enclose the place of a tweet. The area
can be calculated by the points and the centroid
coordinates of the bounding box can be used to
predict the tweet’s geolocation, so a smaller size can
provide a more accurate prediction (e.g., POI and
neighbourhood). However, bounding box of city,
administration and country cannot provide the fine
detail of geolocation granularity.
4.4 Modelling
Location related information can be extracted from
four potential attributes: text, use location, labelled
place and bounding box. The pre-defined coordinate
sets of Australian suburbs are built by gazetteer of
Australia (GA) and digital boundaries of Australian
suburbs.
Geolocation Prediction from Tweets: A Case Study of Influenza-like Illness in Australia
163
4.4.1 Gazetteer of Australia
The national gazetteer of Australia was used as the
data source. It is a dictionary of suburbs’ names and
relevant geographic information of Australia. In the
gazetteer of 2012, there are around 375,000 place
names in Australia. This data is provided by the
Geoscience Australia and can be freely downloaded.
The whole dataset has 20 fields, and important ones
are shown in Table 1. The “Name” field may provide
duplicate names, but we can use “Feature Code” field
to restrict the type of feature to “SUB” which means
suburb. The “Longitude” and “Latitude” fields
contain coordinates of the feature and then can be
used to predict geolocation of tweets.
Table 1: Gazetteer data fields.
Field Description
State ID State or territory identifier.
Name Name of the feature.
Feature Code Code indicating the type of feature.
Longitude Longitude of the feature.
Latitude Latitude of the feature.
4.4.2 Digital Boundaries of Australia
Digital boundaries of Australia are in the format of
ESRI shapefile and can be freely downloaded from
the Australian Bureau Statistics. In our study, we only
focus on the suburb level since levels of city and
administrative can only predict geolocation with
coarse granularity. As for the coordinates of every
suburb, we used two methods to calculate them and
named them DBC and DBA. DBC is based on the
geometry property of the suburb’s polygon, and its
coordinates are considered as the latitude and
longitude of the polygon’s centroid. While DBA is
based on the geo-tagged tweets located in the specific
suburb and the average longitude and latitude of those
tweets are reckoned as the location of this suburb.
4.4.3 Modelling
As shown in Figure 2, the geolocation prediction is
based on four main sources: text (T, for short), user
location (U, for short), place labels (P, for short) and
bounding box of place (B, for short). The first three
sources are checked against GA and digital
boundaries of Australia to investigate whether
location entities of them corresponds to any suburb
within the above two data sets. Based on the NER
technique, suburbs information in T, U and P is
extracted, and then query the information from GA,
DBC and DBA. Equation (1) shows us how to
calculate three predicted matrices:
⎩
⎪
⎪
⎪
⎪
⎪
⎪
⎪
⎪
⎪
⎨
⎪
⎪
⎪
⎪
⎪
⎪
⎪
⎪
⎪
⎧
⎣
⎢
⎢
⎢
⎡
𝑇𝑒𝑥𝑡
𝑈𝑠𝑒𝑟𝐿𝑜𝑐
𝑃𝑙𝑎𝑐𝑒
⋮
𝑇𝑒𝑥𝑡
⋮
⋮
𝑈𝑠𝑒𝑟𝐿𝑜𝑐
⋮
⋮
𝑃𝑙𝑎𝑐𝑒
⋮
𝑇𝑒𝑥𝑡
𝑈𝑠𝑒𝑟𝐿𝑜𝑐
𝑃𝑙𝑎𝑐𝑒
⎦
⎥
⎥
⎥
⎤
⇒
⎩
⎪
⎨
⎪
⎧
𝑀
𝑀
𝑀
𝑀
⎣
⎢
⎢
⎢
⎡
𝑇
𝑈
𝑃
⋮
𝑇
⋮
⋮
𝑈
⋮
⋮
𝑃
⋮
𝑇
𝑈
𝑃
⎦
⎥
⎥
⎥
⎤
𝑀
⎣
⎢
⎢
⎢
⎡
𝑇
𝑈
𝑃
⋮
𝑇
⋮
⋮
𝑈
⋮
⋮
𝑃
⋮
𝑇
𝑈
𝑃
⎦
⎥
⎥
⎥
⎤
𝑀
⎣
⎢
⎢
⎢
⎡
𝑇
𝑈
𝑃
⋮
𝑇
⋮
⋮
𝑈
⋮
⋮
𝑃
⋮
𝑇
𝑈
𝑃
⎦
⎥
⎥
⎥
⎤
(1)
where 𝑇𝑒𝑥𝑡
, 𝑈𝑠𝑒𝑟𝐿𝑜𝑐
and 𝑃𝑙𝑎𝑐𝑒
respectively are
text, user location and place label of a tweet 𝑡
; 𝑀
,
𝑀
and 𝑀
are predicted matrices based on GA,
DBC and DBA.
Equation (2) is used to calculate the area and
centroid coordinates of every tweet’s bounding box.
⎣
⎢
⎢
⎢
⎡
𝐵𝐵𝑜𝑥
⋮
𝐵𝐵𝑜𝑥
⋮
𝐵𝐵𝑜𝑥
⎦
⎥
⎥
⎥
⎤
⇒
⎣
⎢
⎢
⎢
⎡
𝐵
⋮
𝐵
𝐵
⋮
𝐵
⋮⋮
𝐵
𝐵
⎦
⎥
⎥
⎥
⎤
(2)
where 𝐵𝐵𝑜𝑥
is the place’s bounding box of a tweet
𝑡
; 𝐵
is the area of 𝐵𝐵𝑜𝑥
; 𝐵
is the
centroid’s coordinate of 𝐵𝐵𝑜𝑥
;
Since all the tweets have bounding box
information, our models always put bounding box in
the end. The first model is called TUPB, and designed
with the order of T, U, P, B. This model can predict
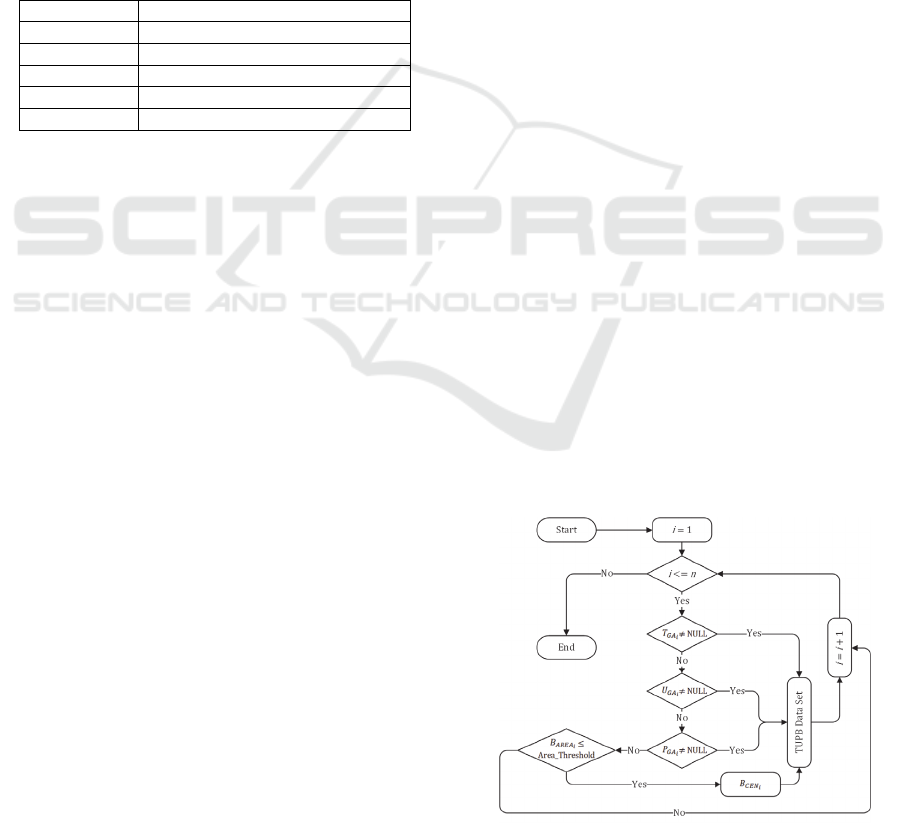
three results based on GA, DBC and DBA. Figure 4
shows how TUPB works based on GA.
Figure 4: Flowchart of TUPB.
GISTAM 2020 - 6th International Conference on Geographical Information Systems Theory, Applications and Management
164
From this flowchart, we can see that there is a loop
of n elements at first. If 𝑇
is not null, this value will
be stored as the predicted result, otherwise will be
determined by the value of 𝑈
. If 𝑈
is not null,
this value will be stored as the predicted result,
otherwise will be determined by the value of 𝑃
. If
𝑃
is not null, it will be stored in TUPB data set,
otherwise will be determined by the value of 𝐵
.
If 𝐵
is less than or equal to 5,400 km
2
, the value
of 𝐵
will be the predicted result and then a new
loop will start, otherwise a new loop will start directly.
Other models use the same way to implement. In
this study, we have six models (TUPB, TPUB, UTPB,
PUTB, PTUB) with four sources, six models (TUB,
TPB, UTB, UPB, PTB, PUB) with three sources,
three models (TB, UB, PB) with two sources and one
model (B) with only one source.
5 EXPERIMENTS AND RESULTS
5.1 Data
We collected tweets from March 28, 2019 to October
9, 2019 which covers the whole flu season of
Australia. Around 4.8 million tweets have been
collected and nearly 9% of them are geo-tagged. The
number of tweets related to influenza and with geo-
tags is 1,730, and models described in Section 4 are
applied to those data.
5.2 Evaluation Metrics
To evaluate the performance of methods, the error
distance can be considered as the great circle distance
between the predicted coordinates and the actual
coordinates of every tweet. For example, two points
are 𝑝
𝜆
,𝜑
and 𝑝
𝜆
,𝜑
, then the great
circle distance (
𝐷
) between these two points can
be calculated by Equation (3).
𝑎
𝑠𝑖𝑛
𝜑
𝜑
2
⁄
𝑎
𝑐𝑜𝑠 𝜑
∙𝑐𝑜𝑠 𝜑
∙𝑠𝑖𝑛
𝜆
𝜆
2
⁄
𝐷
𝑝
,𝑝
2∙𝑅∙𝑎𝑟𝑐𝑠𝑖𝑛
𝑎
𝑎
(3)
where R represents the earth radius and its length is
set to 6,371 kilometres.
Evaluation metrics in this study are MED and
MDED. They are implemented by Equation (4) and
(5) based on the estimated GPS-point (𝑝̂
) and the
original GPS-point (𝑝
) of a tweet (𝑡
).
𝑀𝐸𝐷
1
𝑛
𝐷
𝑝̂
,𝑝
(4)
𝑀𝐷𝐸𝐷𝑚𝑒𝑑𝑖𝑎𝑛
𝐷
𝑝̂
,𝑝
(5)
As we mentioned before, every tweet has the
attribute of bounding box which means we can get a
predicted point only using the bounding box. But the
size of bounding box’s area can affect the error
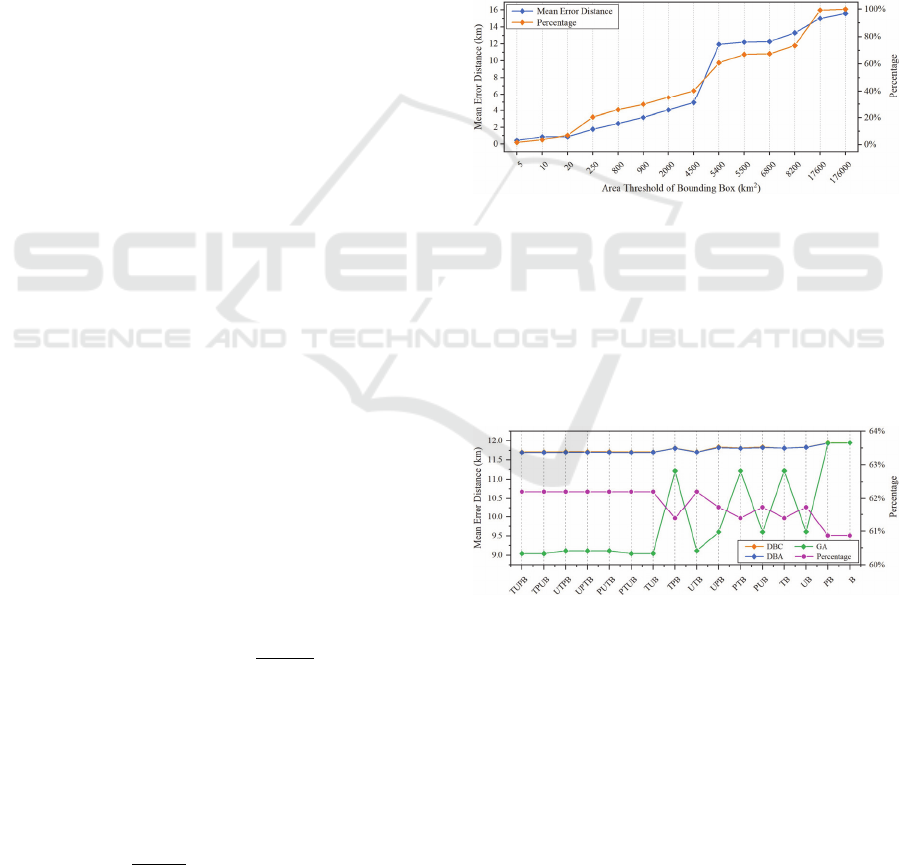
distance dramatically. Figure 5 shows MED and
percentage changing trends based on different area
thresholds of bounding box. For instance, when the
area threshold is set to 5400 km
2
, almost 80% of
tweets can be used, and MED improves to 12 km.
While the area threshold is set to 4,500 km
2
, MED
improves a lot, but less tweets can be used. Therefore,
5,400 km
2
and 4,500 km
2
are two important area
thresholds and we choose these two values to perform
the following experiment in this study.
Figure 5: MED and Percentage Based on Different Area
Thresholds.
5.3 Results
Using Equation (4), MED can be calculated.
Combining models and three coordinate sets of
suburbs, MED and percentage (PCT) of data (𝐵
≤ 5,400 km
2
) are shown in Figure 6.
Figure 6: MED and PCT of Models (𝐵
≤ 5,400 km
2
).
From Figure 6, we can see that DBC and DBA
have the roughly similar performance, all the MED
focus between 11.5 km and 12.0 km. GA has a
significantly better performance, especially for
models with four sources whose MED are almost 9
km. For other models, the line fluctuates between 9.0
and 11.5, however, we can see that when models
contain source of U, the performance is better.
When bounding box’s area threshold is set to
4,500 km
2
, Figure 7 shows MED and PCT of data.
Geolocation Prediction from Tweets: A Case Study of Influenza-like Illness in Australia
165
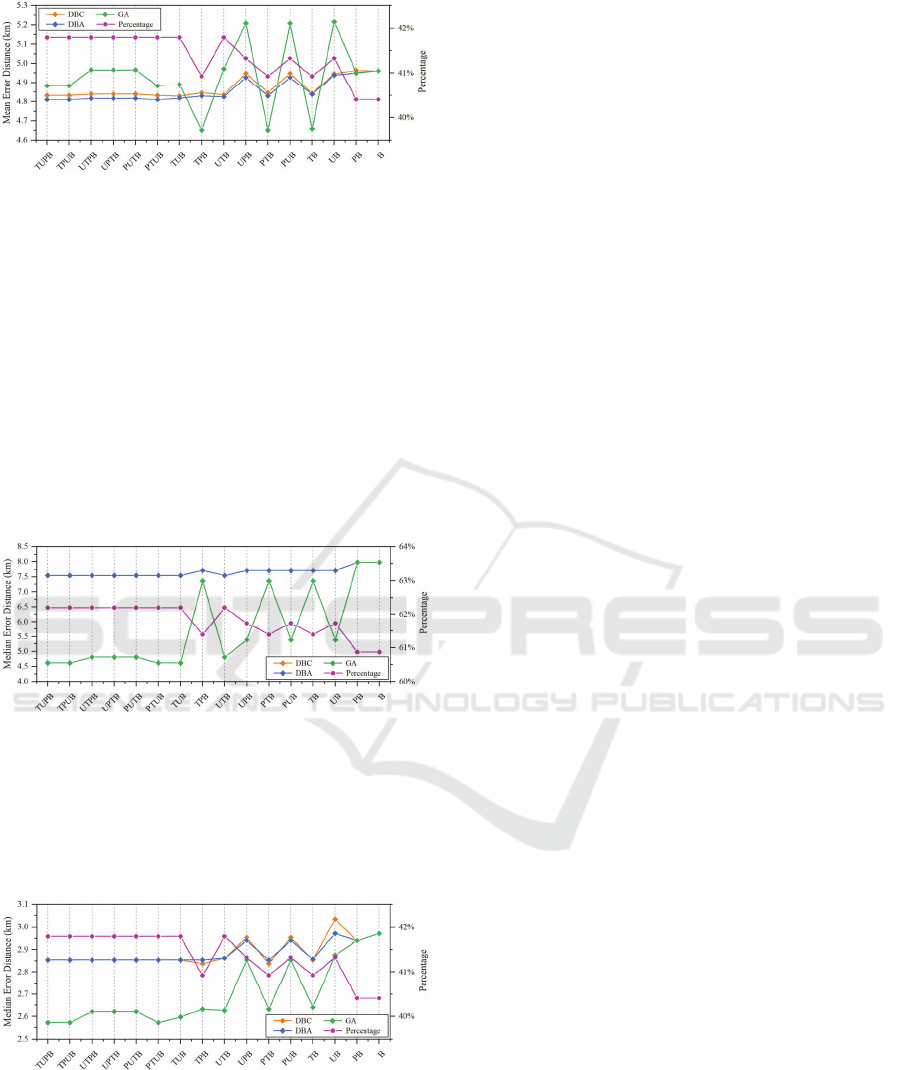
Figure 7: MED and PCT of Models (𝐵
≤ 4500 km
2
).
From Figure 7, we can see that DBC and DBA
still have the similar performance, but DBA is a little
better than DBC. Both DBC and DBA with four
sources have relatively stable performance. While
GA has a fluctuant performance, some perform better,
while some perform worse.
Among the whole dataset of results, there are
some extreme values which can affect mean value
dramatically, so from this point of view, median value
can provide a relatively better performance for the
dataset. Figure 8 show MDED and PCT of data with
the bounding box’s area of 5,400 km
2
. Note that DBC
and DBA have the same performance in Figure 8.
Figure 8: MDED and PCT of Models (𝐵
≤ 5400 km
2
).
Figure 6 (MED) and Figure 8 (MDED have the
similar trends based on different models. MDED has
smaller error distances for the whole models.
Figure 9 show MDED and PCT of data with the
bounding box’s area of 4,500 km
2
.
Figure 9: MDED and PCT of Models (𝐵
≤ 4500 km
2
).
From Figure 7 (MED) and Figure 9 (MDED), we
can see that DBC and DBA have the similar trends
based on different models. While GA has a better
performance compared to the other ones, MDED has
smaller error distances for the whole models. Figures
7-9 show that the models with four sources can
predict higher percentages of data.
6 DISCUSSION, CONCLUSION
AND FUTURE WORK
In this study, we proposed a method to predict
geolocation from tweets as follows: 1) data collection
based on Twitter API; 2) extract tweets with specific
keywords and geo-tags; 3) extract named location
entity from textual content, user location and labelled
place by NER; 4) build three referenced coordinates
sets of suburbs based on GA, DBC and DBA; 5) apply
models to data based on different size thresholds of
bounding box; 6) evaluate performance of models
based on MED and MDED.
The proposed models fully utilize all the possible
location related attributes to predict the geolocation
of tweets without geo-tagging. This method improved
the results in comparison to the reviewed methods.
There are still some limitations that should be
acknowledged in this study. Firstly, some suburbs’
names are not included in the library of NER, which
leads to information loss. Secondly, for some contents
of tweets, there exist several named location entities,
but in this study, we only focus on the first shown one
and ignore others.
In the future, the proposed models in this study
will be implemented to other types of datasets related
to various kinds of events, such as typhoon, bushfire,
earthquake and so on. When calculating average
coordinates of geo-tagged tweets in the specific
suburb, we can apply different weights to different
tweets. Furthermore, other techniques such as NLP
and deep learning models can be used in the text
analysis and considered as further research of
geolocation prediction.
ACKNOWLEDGEMENTS
This research is sponsored by China Scholarship
Council (CSC).
REFERENCES
Abrol, S. & Khan, L. Tweethood: Agglomerative clustering
on fuzzy k-closest friends with variable depth for
location mining. 2010 IEEE Second International
Conference on Social Computing, 2010. IEEE, 153-
160.
GISTAM 2020 - 6th International Conference on Geographical Information Systems Theory, Applications and Management
166

Ahlgren, M. 2019. 40+ Twitter Statistics & Facts For 2019
[Online]. Available: https://www.websitehosting
rating.com/twitter-statistics/ [Accessed 2019/11/30].
Ajao, O., Hong, J. & LIU, W. 2015. A survey of location
inference techniques on Twitter. Journal of Information
Science, 41, 855-864.
Allen, C., Tsou, M.-H., Aslam, A., Nagel, A. & GAWRON,
J.-M. 2016. Applying GIS and machine learning
methods to Twitter data for multiscale surveillance of
influenza. PloS one, 11, e0157734.
Australia, G. 2013. Gazetteer of Australia 2012 Release
[Online]. Available: https://ecat.ga.gov.au/geonetwork/
srv/eng/catalog.search#/metadata/76695 [Accessed
2019/12/2].
Backstrom, L., Sun, E. & Marlow, C. Find me if you can:
improving geographical prediction with social and
spatial proximity. Proceedings of the 19th international
conference on World wide web, 2010. ACM, 61-70.
Bouillot, F., Poncelet, P. & Roche, M. How and why exploit
tweet's location information? AGILE'2012: 15th
International Conference on Geographic Information
Science, 2012. N/A.
Chandra, S., Khan, L. & Muhaya, F. B. Estimating twitter
user location using social interactions--a content based
approach. 2011 IEEE Third International Conference
on Privacy, Security, Risk and Trust and 2011 IEEE
Third International Conference on Social Computing,
2011. IEEE, 838-843.
Cheng, Z., Caverlee, J. & Lee, K. 2013. A content-driven
framework for geolocating microblog users. ACM
Transactions on Intelligent Systems and Technology
(TIST), 4, 2.
Gao, Y., Wang, S., Padmanabhan, A., Yin, J. & Cao, G.
2018. Mapping spatiotemporal patterns of events using
social media: a case study of influenza trends.
International Journal of Geographical Information
Science, 32, 425-449.
Hawelka, B., Sitko, I., Beinat, E., Sobolevsky, S.,
Kazakopoulos, P. & Ratti, C. 2014. Geo-located
Twitter as proxy for global mobility patterns.
Cartography and Geographic Information Science, 41,
260-271.
Hecht, B., Hong, L., Suh, B. & Chi, E. H. Tweets from
Justin Bieber's heart: the dynamics of the location field
in user profiles. Proceedings of the SIGCHI conference
on human factors in computing systems, 2011. ACM,
237-246.
Huang, C., Tong, H., He, J. & Maciejewski, R. 2019.
Location Prediction for Tweets. Front. Big Data 2: 5.
doi: 10.3389/fdata.
Ikawa, Y., Vukovic, M., Rogstadius, J. & Murakami, A.
Location-based insights from the social web.
Proceedings of the 22nd international conference on
World Wide Web, 2013. ACM, 1013-1016.
Laylavi, F., Rajabifard, A. & Kalantari, M. 2016. A multi-
element approach to location inference of twitter: A
case for emergency response. ISPRS International
Journal of Geo-Information, 5, 56.
Li, R., Wang, S., Deng, H., Wang, R. & Chang, K. C.-C.
Towards social user profiling: unified and
discriminative influence model for inferring home
locations.
Proceedings of the 18th ACM SIGKDD
international conference on Knowledge discovery and
data mining, 2012. ACM, 1023-1031.
Lin, Y. 2019. 10 Twitter Statistics Every Marketer Should
Know in 2019 [Infographic] [Online]. Available:
https://au.oberlo.com/blog/twitter-statistics [Accessed
2019/11/30].
Lingad, J., Karimi, S. & Yin, J. Location extraction from
disaster-related microblogs. Proceedings of the 22nd
international conference on world wide web, 2013.
ACM, 1017-1020.
Paul, M. J. & Dredze, M. You are what you tweet:
Analyzing twitter for public health. Fifth International
AAAI Conference on Weblogs and Social Media, 2011.
Priedhorsky, R., Culotta, A. & Del Valle, S. Y. Inferring the
origin locations of tweets with quantitative confidence.
Proceedings of the 17th ACM conference on Computer
supported cooperative work & social computing, 2014.
ACM, 1523-1536.
Prieto, V. M., Matos, S., Alvarez, M., Cacheda, F. &
Oliveira, J. L. 2014. Twitter: a good place to detect
health conditions. PloS one, 9, e86191.
Rosen, A. 2017. Tweeting Made Easier [Online].
Available: https://blog.twitter.com/official/en_us/
topics/product/2017/tweetingmadeeasier.html
[Accessed 2019/12/9].
Ryoo, K. & Moon, S. Inferring twitter user locations with
10 km accuracy. Proceedings of the 23rd International
Conference on World Wide Web, 2014. ACM, 643-648.
Signorini, A., Segre, A. M. & Polgreen, P. M. 2011. The
use of Twitter to track levels of disease activity and
public concern in the US during the influenza A H1N1
pandemic. PloS one, 6, e19467.
Singh, J. P., Dwivedi, Y. K., Rana, N. P., Kumar, A. &
Kapoor, K. K. 2017. Event classification and location
prediction from tweets during disasters. Annals of
Operations Research, 1-21.
Statistics, A. B. O. 2016. 1270.0.55.001 - Australian
Statistical Geography Standard (ASGS): Volume 1 -
Main Structure and Greater Capital City Statistical
Areas, July 2016 [Online]. Available: https://
www.abs.gov.au/AUSSTATS/abs@.nsf/DetailsPage/1
270.0.55.001July%202016?OpenDocument [Accessed
2019/12/2].
Steiger, E., De Albuquerque, J. P. & Zipf, A. 2015. An
Advanced Systematic Literature Review on
Spatiotemporal Analyses of T witter Data. Transactions
in GIS, 19, 809-834.
Takhteyev, Y., Gruzd, A. & Wellman, B. 2012. Geography
of Twitter networks. Social networks, 34, 73-81.
Geolocation Prediction from Tweets: A Case Study of Influenza-like Illness in Australia
167
