
Towards the Automatic Visual Monitoring of Electricity Pylons from
Aerial Images
Anicetus Odo
1
, Stephen McKenna
1
, David Flynn
2
and Jan Vorstius
1
1
School of Science & Engineering, University of Dundee, Dundee, DD1 4HN, Scotland, U.K.
2
School of Engineering & Physical Sciences, Heriot-Watt University, Edinburgh, EH14 4AS, Scotland, U.K.
Keywords:
Visual Inspection, Electricity Pylons, Transfer Learning, Unmanned Aerial Vehicles.
Abstract:
Visual inspection of electricity transmission and distribution networks relies on flying a helicopter around
energized high voltage towers for image collection. The sensed data is taken offline and screened by skilled
personnel for faults. This poses high risk to the pilot and crew and is highly expensive and inefficient. This
paper reviews work targeted at detecting components of electricity transmission and distribution lines with
attention to unmanned aerial vehicle (UAV) platforms. The potential of deep learning as the backbone of
image data analysis was explored. For this, we used a new dataset of high resolution aerial images of medium-
to-low voltage electricity towers. We demonstrated that reliable classification of towers is feasible using deep
learning methods with very good results.
1 INTRODUCTION
Aerial surveillance of electricity network components
is currently an active area of research. We review
recent work on vision-based inspection of electric-
ity network components from aerial images. We then
demonstrate a novel application of deep learning for
tower image classification. Specifically, we classify
towers as being either suspension (S-type) or ten-
sion (T-type) towers. This classification, in terms of
tower configuration, will be useful as a step in the in-
spection of other tower parameters, e.g., components
around the cross-arm (insulators, clamps, shackles,
etc.). Tower classification is achieved by first clas-
sifying each of the multiple images of a tower and
then using voting to determine the tower class. Since
many images do not contain the relevant part of the
tower, we introduce a third unknown (U) image class,
and train 3-class image classifiers. Identification of U
images, which tend to be of the body and leg regions
of a tower, is a useful step in the inspection of con-
crete muffs, warning signs, vegetation cover and anti-
climbing devices, which are localized around these re-
gions.
2 MOTIVATION
Globally, societies depend on continuity of service
from critical systems such as electrical networks.
Electrical networks support other critical services like
transportation, telecommunications, food, water and
healthcare. Electricity is generated and transmitted
over a system of transmission and distribution net-
work infrastructure. The networks are made up of
high rising metal towers or pylons and span hundreds
of thousands of kilometres (Andersson et al., 2005;
Jones, 2005) along rivers, lakes, hills and lowlands
and sometimes across dense vegetation (Liu et al.,
2015). To ensure effective management , a set of stan-
dards is put in place and regulated. One such regulator
is the Office of Gas and Electricity Markets (Ofgem)
in the UK. The major role of this body is to ensure the
enforcement of a uniform level of performance from
all the distribution network operators (DNOs) within
the industry (McGonigle, 2017).
To operate within these standards, DNOs make
huge investment in asset acquisition and management.
The United States alone requires about $2 trillion in-
vestment for upgrades by 2030 (Bronski et al., 2015).
There was over £16 billion of investment on elec-
tricity networks from 2010 and £34 billion needed
up to 2020 (DECC, 2015). This trend is likely to
continue in the coming decade as most of the trans-
mission and distribution network infrastructure has
served the better part of its lifespan. Disruptions re-
ported in Europe, Asia and America within the last
fifteen years (Bakshi, A., Velayutham, A., Srivastava,
2012; Schmidthaler & Reichl, 2016) point to the fact
that electricity assets are aging and in need of constant
monitoring. Making this situation worse is the in-
creasing demand for energy. To mitigate the huge loss
566
Odo, A., McKenna, S., Flynn, D. and Vorstius, J.
Towards the Automatic Visual Monitoring of Electricity Pylons from Aerial Images.
DOI: 10.5220/0009345005660573
In Proceedings of the 15th International Joint Conference on Computer Vision, Imaging and Computer Graphics Theory and Applications (VISIGRAPP 2020) - Volume 5: VISAPP, pages
566-573
ISBN: 978-989-758-402-2; ISSN: 2184-4321
Copyright
c
2022 by SCITEPRESS – Science and Technology Publications, Lda. All rights reserved

in finances and patronage associated with such fail-
ures, evolving new and effective management tools
has become inevitable.
The current state-of-the-art for inspection of elec-
tricity transmission and distribution assets relies on
visual aerial images. These are usually collected from
helicopters (Matikainen et al., 2016). Other sensing
alternatives like light detection and ranging (LiDAR)
are in use. The deployment on helicopters has safety
shortcomings and high operational costs. The current
advancement in UAV technology for remote sensing
offers advantages and has increasingly gained pop-
ularity in aerial photography and surveillance. The
benefits of UAVs include their flexibility (Herwitz
et al., 2004) and low cost of operation (Cai & Walker,
2010).
Given the large numbers of components and in-
spection parameters, a robust data management archi-
tecture is needed. Solutions should combine histor-
ical data, current conditions and energy demand to
advise on a preferred course of action. There is an
ongoing discussion towards Big Data architecture for
smart grid (IEEE-Smart-Grid, 2017) and the role of
machine learning and artificial intelligence is promi-
nent.
3 LITERATURE REVIEW
Electricity assets are the valuable components (tan-
gible and intangible) of the network, which are in-
tegral to the profitable delivery of the services that
businesses depend upon (Clarke, 2011). These in-
clude transformers, high voltage towers, conductors,
insulators, suspension clamps, connecting links, etc.
For an asset to remain relevant, its health state should
be inspected for signs of failure or degradation, so
as to maximize availability, performance and reliabil-
ity. Eyre-Walker et al. (2015) presented application
of advanced condition assessment and asset manage-
ment techniques for overhead electricity network as-
set monitoring to involve data acquisition and analy-
sis.
Regular and effective inspection and management
requires high financial commitment from owners and
operators in the industry. This has triggered increased
collaboration with researchers to find improved and
cost-effective ways of conducting power-line inspec-
tion (Martinez et al., 2014). A major direction is im-
provement of alternative sensing platforms and the
drive to automate the process (Matikainen et al.,
2016).
Various events along power distribution lines may
lead to power outages. The most common causes
of outages are: (1) failure of power-line components
(Larsson & Ek, 2004) and (2) interference with sur-
rounding vegetation (Andersson et al., 2005). Causes
of the 2003 major grid blackouts in North America
and Europe included inadequate vegetation manage-
ment (i.e. tree trimming). The use of line men for
checking the encroachment of trees along power dis-
tribution lines is still practiced today. This is not only
costly but inefficient. Remote alternatives have been
introduced (Ahmad et al., 2015; Zhang et al., 017b).
The inspection of specific components accounts
for the largest propotion of inspection tasks. These
include conductors (Zhang et al., 017a; Chen et al.,
2016; Sharma et al., 2014; Li et al., 2010), tow-
ers (Martinez et al., 2014) and insulators (Oberweger
et al., 2014; Li et al., 2012; Salustiano et al., 2014).
3.1 UAV Navigation
Safe flight of a UAV along a power-line corridor is key
to successful inspection. Although a pilot is dedicated
to this task, there have been crashes due to system,
human or environmental factors. System and human
errors can be controlled but environmental impacts
could come from several sources, e.g. gust wind.
To solve the problem posed by gust wind, Liu et al.
(2015) proposed the creation of a no-fly-zone along
the distribution network corridor using GPS coordi-
nates of the towers.
Sa et al. (2015) demonstrated the use of vertical
take-off and landing of UAVs for the inspection of
pole-like structures. They combined monocular, in-
ertia and sonar data for navigation information and
Extended Kalman Filters to maintain a safe distance
from the pole even in the presence of environmental
disturbances. Essentially, this is a detect and follow
algorithm.
Golightly & Jones (2005) combined Hough trans-
form and Kalman filters to guide a rotorcraft along
detected powerlines. A follow-up study (Jones et al.,
2006) used an air vehicle simulator (AVS) to demon-
strate that visual data can be used to determine, and
hence regulate vehicle position relative to the over-
head lines. Cer
´
on et al. (2018) developed a system
that detects and follows powerlines from images.
3.2 Obstacle Detection and Avoidance
The detection of obstacles such as vegetation and
buildings along powerlines has been investigated
(Zhang et al., 2012, 017a,b). Low altitude photogram-
metry has been explored in these studies to extract
3D point clouds of the power-line corridor. The dis-
tance between the powerlines and the 3D point cloud
Towards the Automatic Visual Monitoring of Electricity Pylons from Aerial Images
567

is taken as a criterion for automatically locating ob-
stacles. Zhang et al. (2012) used monocular measure-
ment and inertia to estimate the position of landmarks
as well as the position and orientation of the UAVs.
3.3 Detection of Towers
Detection of electricity pylons was studied by (Dutta
et al., 2015) and (Jiang et al., 2017). The main
contribution of (Dutta et al., 2015) was to mini-
mize clutter due to heterogeneous background using
optimized mean shift-based segmentation. The re-
sulting image was divided into a grid of rectangu-
lar patches called granules. The best granules were
selected using gradient density and cluster density-
based thresholding. The clusters corresponding to py-
lon regions within key granules were merged through
shared boundary criterion. Finally, pylons were de-
tected using context information. Results were en-
couraging. On the other hand, Jiang et al. (2017) ex-
plored the use of an unmanned aerial vehicle (UAV)
for outdoor data acquisition. They achieved this using
an oblique photogrammetric system integrated with a
low-cost double-camera imaging system, an on-board
dual-frequency Global Navigation Satellite System
(GNSS) receiver and a ground master GNSS station
in fixed position.
The use of UAVs in a cooperative way was pro-
posed by (Pirbodaghi et al., 2015). This system used
two robotic platforms that were heterogeneous and
cooperative in executing tasks. While a rob-on-wire
inspected the lines by moving on them, an octocopter
served as a wireless relay node establishing data trans-
fer between rob-on-wire and the ground station and
carried out inspection at the same time on the towers.
In addition to the detection of towers, there is a
need to identify defects in its components. A method
for estimating corrosion on towers was presented in
(Tsutsumi et al., 2009). It was based on a support
vector machine using the radial basis function kernel.
Some synthetic images using colour temperature and
brightness were added to augment the training data.
This was evaluated using 1,427 images of 8 towers.
Detection of other defects on towers has not been ad-
equately explored.
3.4 Detection of Insulators
Detection of insulators and insulator defects has been
studied (Oberweger et al., 2014; Zhai et al., 2017;
Liu et al., 2017). Saliency and adaptive morphol-
ogy were the bases for insulator fault detection. Liu
et al. (2017) detected insulators and hammers using
a multi-layer perceptron. Jabid & Ahsan (2018) de-
tected insulators using rotation invariant local direc-
tional pattern (RI-LDP) features. These features were
used by an SVM to classify regions of insulator and
predict their faults.
3.5 Detection of Conductors
The detection of conductors has been addressed in
several studies. In (Yang et al., 2012), video frames
were binarised through an adaptive thresholding ap-
proach and a Hough transform was used to detect
line candidates. This was followed by a fuzzy C-
means clustering algorithm to discriminate the con-
ductor lines from other detected line patterns like
roads, river banks and vegetation. Li et al. (2008) used
a pulse coupled neural network filter to remove back-
ground noise from images prior to Hough transform
being employed to detect straight lines. Thereafter,
knowledge-based line clustering was applied to re-
fine the detection results. Bhujade (2013) and Sharma
et al. (2014) suppressed the natural surroundings (re-
gions of sky and vegetation) and used a Hough trans-
form. In (Tian et al., 2015), conductors were extracted
based on directional constraints using a double-side
filter, and an improved Hough transform with parallel
constraint was used for conductor recognition. Their
results show significant improvement because of the
addition of direction and parallelism constraints. Sim-
ilarly, Zhu et al. (2013) presented a double-side filter-
based conductor recognition method for a UAV vi-
sion system. This method was based on linear ob-
ject enhancement and parallel lines constraints as in
(Tian et al., 2015). A Radon transform was used to
find the parallel lines. Real-time detection of con-
ductors from video was presented in (Liu & Mejias,
2012). Ippolito et al. (2016) also showed a real-time
method but with 3D scanning using LiDAR. This uti-
lized a voxel-based method with a series of classifiers
to identify and reconstruct conductors. A mini UAV
mounted with LiDAR was proposed in (Santos et al.,
2017) for sensing the powerline corridor.
Most studies reviewed in this section focus on de-
tecting conductors without considering defect detec-
tion or analysis. Zhang, F. et al. (2016) presented a
technique to detect and remove fog from an image
to enhance detection. Zhai et al. (2017) compared
the capability of three edge detection algorithms us-
ing images of towers. Xie et al. (2017) suggested the
use of multiple sensors from a large UAV. Qin et al.
(2018) based their approach on a cable inspection
robot to improve the payload and power capabilities
of their inspection platform. Menendez et al. (2016)
presented a simulation of a UAV-based line tracking
system and mounted a visual sensor on a robotic arm
VISAPP 2020 - 15th International Conference on Computer Vision Theory and Applications
568
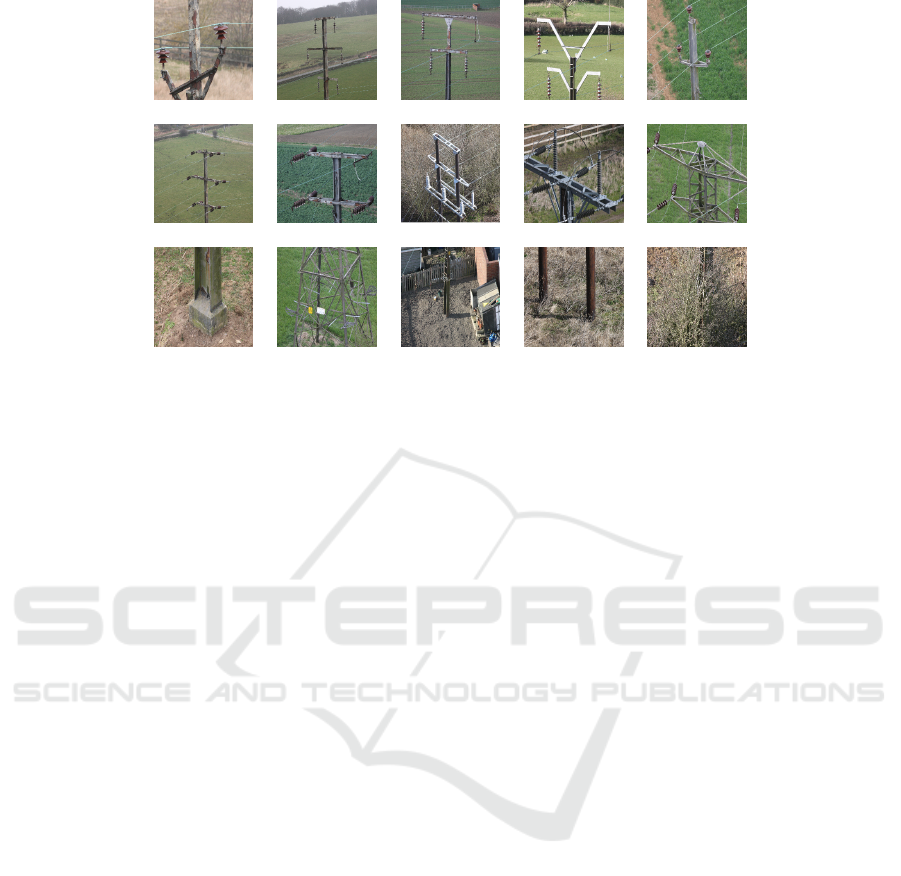
Figure 1: Top: images of S-type towers. Middle: images of T-type towers. Bottom: images from which tower type is not
apparent.
that detected and tracked lines.
In summary, some components of the power-line
corridor including towers, insulators and conductors
have been studied in the literature. The use of com-
puter vision techniques is popular and several ma-
chine learning algorithms (e.g. multi-layer percep-
tron, pulse coupled neural network) have been used.
The potential of deep learning as the backbone for
analyzing the sensed data has not been sufficiently
covered partly due to lack of suitably labelled data.
Nguyen et al. (2018) and Zhang et al. (2018) have
highlighted the huge potential of this approach. Re-
cent success of deep learning for the detection and
classification of objects directly from images presents
an exciting opportunity for real-time inspection of
components of electricity transmission and distribu-
tion networks.
4 CLASSIFICATION OF TOWERS
FROM AERIAL IMAGES
4.1 Data Formation
The dataset used for this study was collected using he-
licopters mounted with high resolution cameras. Each
image has 5616x3744 pixels. The images are of tow-
ers from low-to-medium voltage lines. Each line is
identified by a unique line number (e.g. A54, A74).
Along each line are multiple towers (e.g. A54(002),
A54(003), etc).
Images are taken of each tower from different
views (e.g. right and left circuit) across the crossarm,
body and foot regions. All the images of a tower are
grouped into a tower ’bag’ with a unique identifier
(tower number). Each tower bag has been inspected
and labelled by an expert. It is important to empha-
size that although multiple images of each tower were
acquired, a single label has been assigned to the entire
bag. Some suspension (S-type) towers are shown in
Figure 1 (row 1), i.e., different tower structures with
suspended cables. Row 2 of Figure 1 shows some
T-type (tension) towers. These towers also have dif-
ferent structures with cables pulling on the structure.
With respect to how the data is formed, most image-
based classification and detection problems (datasets)
have one label per image. Here, tower images were
captured to have good representation of the compo-
nents and conditions but labelled as a bag. This bulk
labelling presents the following challenges: (1) In
each tower bag there are a mix of cross-arm images
(rows 1 and 2 of Figure 1) and images of body and
leg regions (row 3 of Figure 1); (2) Images of tower
body or leg regions (row 3 of Figure 1) have no fea-
tures identifying them as S-type or T-type. Therefore,
attempting to classify such images independently as
being of S-type or T-type towers will cause errors.
To address the problem of bulk label assignment,
all images of tower body/leg regions were labelled as
U images (unknown). At image level, there are thus
three class labels: S, T, and U.
It is required that images found in the training set
are not present in the testing set. Considering that in
our dataset each tower has several images (bag of ex-
amples), training and testing sets have been assigned
tower-wise.
There are 28231 images for training, 4593 for val-
idation and 4240 images for testing. The breakdown
of towers and images across class labels is presented
in Table 1.
Towards the Automatic Visual Monitoring of Electricity Pylons from Aerial Images
569
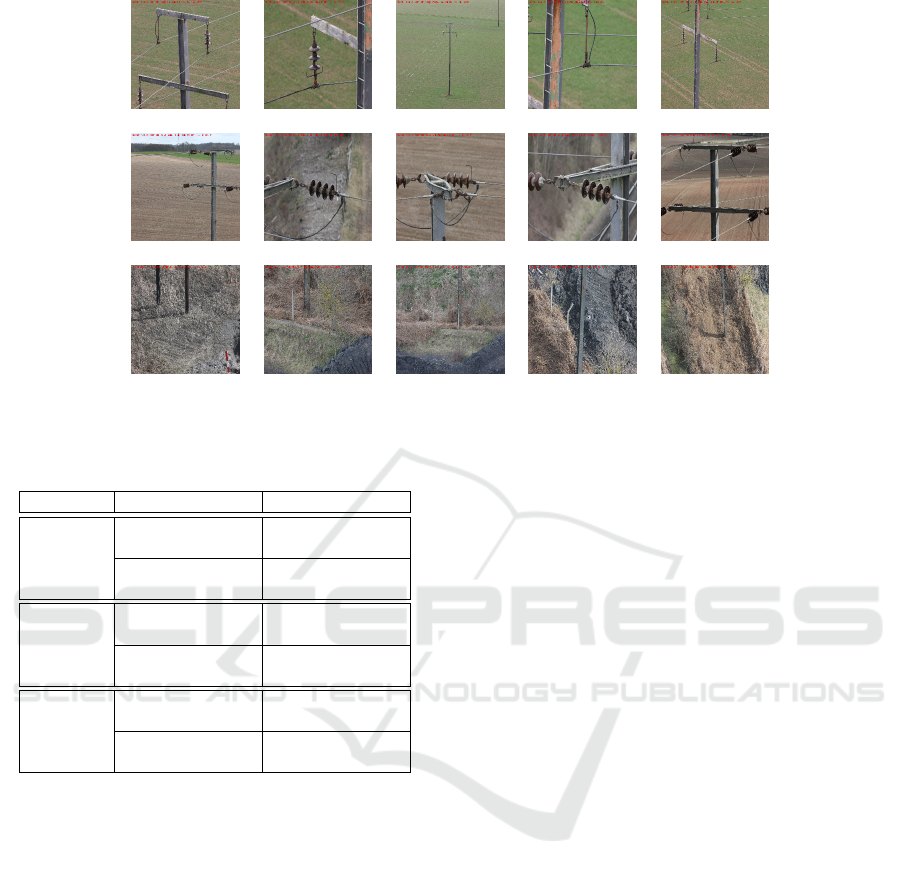
Figure 2: Examples of test images that were correctly classified. Top: S class. Middle: T class. Bottom: U class.
Table 1: Distribution of data for training, validation and
testing sets.
Towers (Number) Images (Number)
Training
S-type (519) S (12621)
U (3102)
T-type (270) T (9166)
U (3343)
Validation
S-type (79) S (1963)
U (709)
T-type (41) T (1469)
U (452)
Testing
S-type (80) S (1829)
U (551)
T-type (39) T (1215)
U (645)
4.2 Training
We fine-tuned a VGG16 network (Simonyan & Zis-
serman, 2015) using ImageNet weight initialization.
We replace the fully connected layers with a new fully
connected output layer with 3 nodes (3 classes). We
also trained from scratch, a ResNet with 86 layers and
based on pre-activation of residual modules (He et al.,
2016).
The images are 5616x3744x3 in size (colour).
They were resized to 244x244x3 to fit our target input
shape. The input images were randomly augmented
and fed into the model. To ensure that the model sees
different sets of images each time they were sampled,
we applied width and height shifts, zooming and flip-
ping. The model was optimized using Stochastic Gra-
dient Descent (SGD) with learning rate of 1e-3.
4.3 Evaluation
There are 118 towers comprising of 4240 images in
the test set. The distribution of towers and images for
testing is shown in Table 1. The VGG-based classifier
predicted 97.04%, 97.69% and 96.32% of S, T and U
test images correctly. The ResNet classified 96.99%,
96.54% and 95.65% of S, T and U test images cor-
rectly.
Figure 2 shows some examples of S, T, and U im-
ages that were correctly classified. Figure 3 shows
examples of incorrect classifications. Comparing the
results, one notices that close-range images with rel-
atively clean backgrounds are correctly classified.
Some characteristics of the incorrectly classified im-
ages are (1) long-range images, (2) heavy background
clutter, e.g. houses, trees, (3) instances of multiple ob-
jects e.g., Figure 3, row 1, image 3, and (4) cases of
wrong labels e.g., Figure 3, row 3, images 3, 4 and 5.
4.4 Voting Mechanism for Tower Level
Classification
An aim of this study is to classify towers as suspen-
sion (S-type) or tension (T-type). Each tower is pre-
sented as a bag of images. Within each bag are 20-
30 instances. We use a majority voting mechanism.
This samples all the image predictions for each bag
and counts the number of occurrences of S and T la-
bels. The label with the highest count is returned as
the final prediction for the bag (i.e. tower level classi-
fication). We envisaged a situation in which there is a
tie (equal predictions of targets). However, there was
no tie in our experiments. As shown in Table 2, the
VGG-based model misclassified one S-type tower as
VISAPP 2020 - 15th International Conference on Computer Vision Theory and Applications
570
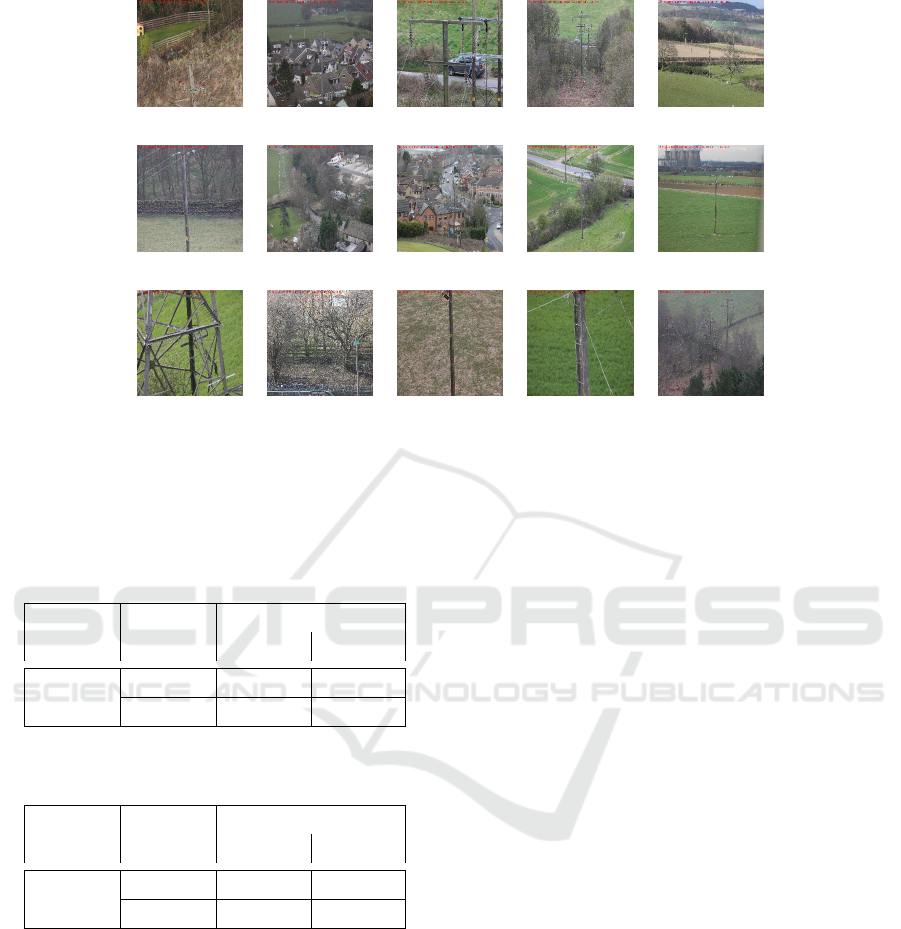
(a) S images misclassified as T
(b) T images misclassified as S
(c) U images misclassified as T
Figure 3: Examples of test images incorrectly classified.
T-type. On the other hand, ResNet predicted all the
towers correctly as shown in Table 3.
Table 2: Fine-tuned VGG model: Confusion matrix with
majority voting for tower level classification.
Predictions
S-type T-type
Actual
S-type 79 1
T-type 0 38
Table 3: ResNet: Confusion matrix with majority voting for
tower level classification.
Predictions
S-type T-type
Actual
S-type 80 0
T-type 0 38
5 CONCLUSION
We reviewed methods for electricity network asset in-
spection. This included the use of machine learning,
computer vision and the potential of deep learning.
We presented the classification of electricity towers
based on their configuration. To the best of our knowl-
edge, there is no previous report of a deep learning-
based classification of tower images. Our method
of electricity tower and image classification is a pre-
cursor for the inspection of other power-line com-
ponents and condition parameters: (1) inspection of
components around the cross-arm (insulators, clamps,
shackles, conductors, etc.), (2) inspection of concrete
muffs, DODs, tower name plates, etc.
ACKNOWLEDGEMENT
The authors would like to thank the Northern Pow-
ergrid for providing very useful data for this study.
Anicetus Odo is grateful to TETFund for the grant to-
wards his PhD.
REFERENCES
Ahmad, J., Malik, A. S., Abdullah, M. F., Kamel, N., &
Xia, L. (2015). A novel method for vegetation en-
croachment monitoring of transmission lines using a
single 2D camera. Pattern Analysis and Applications.
Andersson, G., Donalek, P., Farmer, R., Hatziargyriou,
N., Kamwa, I., Kundur, P., Martins, N., Paserba,
J., Pourbeik, P., Sanchez-Gasca, J., Schulz, R.,
Stankovic, A., Taylor, C., & Vittal, V. (2005). Causes
of the 2003 Major Grid Blackouts in North America
and Europe, and Recommended Means to Improve
System Dynamic Performance. IEEE Transactions on
Power Systems.
Bakshi, A., Velayutham, A., Srivastava, S. (2012). Re-
port of the Enquiry Committee on Grid disturbance
in Nothern Region. Technical report, New Delhi.
Bhujade, R. M. (2013). Detection of Power-Lines in Com-
plex Natural Surroundings. Computer Science.
Towards the Automatic Visual Monitoring of Electricity Pylons from Aerial Images
571

Bronski, P., Creyts, J., Crowdis, M., Doig, S., Glassmire,
J., Energy, H., Guccione, L., Lilienthal, P., Mandel,
J., Rader, B., & Seif, D. (2015). The Economics of
Load Defection. Technical report, Rocky Mountain
Institute.
Cai, J. & Walker, R. (2010). Height estimation from monoc-
ular image sequences using dynamic programming
with explicit occlusions. IET Computer Vision.
Cer
´
on, A., Mondrag
´
on, I., & Prieto, F. (2018). Onboard
visual-based navigation system for power line follow-
ing with UAV. Int. Journal of Adv. Robotic Systems.
Chen, Y., Li, Y., Zhang, H., Tong, L., Cao, Y., & Xue, Z.
(2016). Automatic power line extraction from high
resolution remote sensing imagery based on an im-
proved Radon transform. Pattern Recognition.
Clarke, N. (2011). Asset Monitoring, Management and Op-
timization. Technical report, Tessella plc.
DECC (2015). Delivering UK Energy Investment: Net-
works. Technical report, Department of Energy and
Climate Change.
Dutta, T., Sharma, H., Vellaiappan, A., & Balamuralidhar,
P. (2015). Image analysis-based automatic detection
of transmission towers using aerial imagery. Pattern
Recognition and Image Analysis.
Eyre-Walker, R., Howarth, G., Ahmed, R., Lewin, J., &
Higinbotham, W. (2015). Application of Adv. Condi-
tion Assessment and Asset Management Techniques
on Steel Tower Overhead Line Electricity Networks.
In Int. Conf. on Transmission and Distribution Con-
struction, Operation and Live-Line Maintenance”.
Golightly, I. & Jones, D. (2005). Visual control of an un-
manned aerial vehicle for power line inspection. In
Proc. 12th Int. Conf. on Adv. Robotics, 2005. IEEE.
He, K., Zhang, X., Ren, S., & Sun, J. (2016). Identity map-
pings in deep residual networks. CoRR.
Herwitz, S., Johnson, L., Dunagan, S., Higgins, R., Sulli-
van, D., Zheng, J., Lobitz, B., Leung, J., Gallmeyer,
B., Aoyagi, M., Slye, R., & Brass, J. (2004). Imaging
from an unmanned aerial vehicle: agricultural surveil-
lance and decision support. Computers and Electron-
ics in Agriculture.
IEEE-Smart-Grid (2017). Big Data Analytics, Machine
Learning and Artificial Intelligence in the Smart Grid:
Intro., Benefits, Challenges and Issues. IEEE.
Ippolito, C., Krishnakumar, K., & Hening, S. (2016). Pre-
liminary results of powerline reconstruction from air-
borne LiDAR for safe autonomous low-altitude urban
operations of small UAS. In 2016 IEEE SENSORS.
IEEE.
Jabid, T. & Ahsan, T. (2018). Insulator Detection and De-
fect Classification using Rotation Invariant Local Di-
rectional Pattern. Int. Journal of Adv. Computer Sci-
ence and Applications.
Jiang, S., Jiang, W., Huang, W., & Yang, L. (2017). Uav-
based oblique photogrammetry for outdoor data ac-
quisition and offsite visual inspection of transmission
line. Remote Sensing.
Jones, D. (2005). Power line inspection-a uav concept. In
Autonomous Systems. IET.
Jones, D., Golightly, I., Roberts, J., & Usher, K. (2006).
Modeling and control of a robotic power line inspec-
tion vehicle. In 2006 IEEE Conf. on Computer Aided
Control System Design, 2006 IEEE Int. Conf. on Con-
trol Applications, 2006 IEEE Int. Symposium on Intel-
ligent Control. IEEE.
Larsson, S. & Ek, E. (2004). The black-out in southern
Sweden and eastern Denmark, September 23, 2003.
In Power Engineering Society General Meeting, 2004.
IEEE. IEEE.
Li, B., Wu, D., Cong, Y., Xia, Y., & Tang, Y. (2012). A
Method of Insulator Detection from Video Sequence.
In Symp. on Info. Science and Engineering. IEEE.
Li, Z., Liu, Y., Hayward, R., Zhang, J., & Cai, J.
(2008). Knowledge-based power line detection for
UAV surveillance and inspection systems. In Proc.
23rd Int. Conf. Image and Vision Computing New
Zealand.
Li, Z., Liu, Y., Walker, R., Hayward, R., & Zhang, J. (2010).
Towards automatic power line detection for a UAV
surveillance system using pulse coupled neural filter
and an improved Hough transform. Machine Vision
and Applications.
Liu, C., Liu, Y., Wu, H., & Dong, R. (2015). A safe flight
approach of the uav in the electrical line inspection.
Int. Journal of Emerging Electric Power Systems.
Liu, Y., Li, J., Xu, W., & Liu, M. (2017). A method on rec-
ognizing transmission line structure based on multi-
level perception. Image and Graphics.
Liu, Y. & Mejias, L. (2012). Real-time power line extrac-
tion from Unmanned Aerial System video images. In
2012 2nd Int. Conf. on Applied Robotics for the Power
Industry (CARPI). IEEE.
Martinez, C., Sampedro, C., Chauhan, A., & Campoy, P.
(2014). Towards autonomous detection and tracking
of electric towers for aerial power line inspection. Int.
Conf. on Unmanned Aircraft Systems, ICUAS 2014 -
Conf. Proceedings.
Matikainen, L., Lehtom
¨
aki, M., Ahokas, E., Hyypp
¨
a,
J., Karjalainen, M., Jaakkola, A., Kukko, A., &
Heinonen, T. (2016). Remote sensing methods for
power line corridor surveys. Journal of Photogram-
metry and Remote Sensing.
McGonigle, S. (2017). RIIO ED1 Annual Report 2015 -
2016. Technical report, ofgem.
Menendez, O. A., Perez, M., & Cheein, F. A. A. (2016).
Vision based inspection of transmission lines using
unmanned aerial vehicles. In 2016 IEEE Int. Conf.
on Multisensor Fusion and Integration for Intelligent
Systems (MFI). IEEE.
Nguyen, V. N., Jenssen, R., & Roverso, D. (2018). Au-
tomatic autonomous vision-based power line inspec-
tion: A review of current status and the potential role
of deep learning. Int. Journal of Electrical Power and
Energy Systems.
Oberweger, M., Wendel, A., & Bischof, H. (2014). Visual
Recognition and Fault Detection for Power Line Insu-
lators. 19th Computer Vision Winter Workshop.
Pirbodaghi, S., Thangarajan, D., Teo Hung Liang, Shan-
mugavel, M., Ragavan, V., & Sequeira, J. S. (2015).
VISAPP 2020 - 15th International Conference on Computer Vision Theory and Applications
572

A cooperative heterogeneous Unmanned Autonomous
Systems solution for monitoring and inspecting power
distribution system. In 2015 Int. Conf. on Control,
Instrumentation, Communication and Computational
Technologies (ICCICCT). IEEE.
Qin, X., Wu, G., Lei, J., Fan, F., Ye, X., & Mei, Q. (2018).
A Novel Method of Autonomous Inspection for Trans-
mission Line based on Cable Inspection Robot LiDAR
Data. Sensors.
Sa, I., Hrabar, S., & Corke, P. (2015). Inspection of pole-
like structures using a visual-inertial aided vtol plat-
form with shared autonomy. Sensors.
Salustiano, R., Capelini, R. M., de Abreu, S. R., Martinez,
M. L. B., Tavares, I. C., Ferraz, G. M. F., & Romano,
M. A. A. (2014). Development of new methodology
for insulators inspections on aerial distribution lines
based on partial discharge detection tools. In Int. Conf.
on High Voltage Engineering and Application. IEEE.
Santos, T., Moreira, M., Almeida, J., Dias, A., Martins, A.,
Dinis, J., Formiga, J., & Silva, E. (2017). PLineD:
Vision-based power lines detection for Unmanned
Aerial Vehicles. In Int. Conf. on Autonomous Robot
Systems and Competitions (ICARSC). IEEE.
Schmidthaler, M. & Reichl, J. (2016). Assessing the socio-
economic effects of power outage. Computer Science
- Research and Development.
Sharma, H., Bhujade, R., Adithya, V., & Balamuralidhar,
P. (2014). Vision-based detection of power distribu-
tion lines in complex remote surroundings. In Proc.
Twentieth National Conf. Communications (NCC).
Simonyan, K. & Zisserman, A. (2015). Very Deep Conv.
Networks for Large-Scale Image Recognition. In
ICLR.
Tian, F., Wang, Y., & Zhu, L. (2015). Power line recogni-
tion and tracking method for uavs inspection. In Proc.
IEEE Int. Conf. Information and Automation.
Tsutsumi, F., Murata, H., Onoda, T., Oguri, O., & Tanaka,
H. (2009). Automatic corrosion estimation using gal-
vanized steel images on power transmission towers.
In 2009 Transmission & Distribution Conf. & Exposi-
tion: Asia and Pacific. IEEE.
Xie, X., Liu, Z., Xu, C., & Zhang, Y. (2017). A Multiple
Sensors Platform Method for Power Line Inspection
Based on a Large Unmanned Helicopter. Sensors.
Yang, T. W., Yin, H., Ruan, Q. Q., Han, J. D., Qi, J. T.,
Yong, Q., Wang, Z. T., & Sun, Z. Q. (2012). Overhead
power line detection from UAV video images. In Proc.
19th Int. Conf. Mechatronics and Machine Vision in
Practice (M2VIP).
Zhai, Y., Wang, D., Zhang, M., Wang, J., & Guo, F. (2017).
Fault detection of insulator based on saliency and
adaptive morphology. Multimedia Tools and Appli-
cations.
Zhai, Y., Wang, G., Yu, H., & Wei, G. (2017). Research
on the application of the edge detection method for
the UAVs icing monitoring of transmission lines. In
Int. Conf. on Mechatronics and Automation (ICMA).
IEEE.
Zhang, F., Goubran, R., & Straznicky, P. (2012). Obstacle
detection for low flying UAS using monocular cam-
era. In 2012 IEEE Int. Instrumentation and Measure-
ment Technology Conf. Proceedings. IEEE.
Zhang, W., Witharana, C., Li, W., Zhang, C., Li, X., & Par-
ent, J. (2018). Using deep learning to identify utility
poles with crossarms and estimate their locations from
google street view images. Sensor.
Zhang, Y., Yuan, X., Fang, Y., & Chen, S. (2017b). UAV
Low Altitude Photogrammetry for Power Line Inspec-
tion. ISPRS Int. Journal of Geo-Information.
Zhang, Y., Yuan, X., Li, W., & Chen, S. (2017a). Automatic
power line inspection using uav images. Remote Sens-
ing.
Zhang, F., Wang, W., Zhao, Z., Li, P., Lin, Q., & Jiang, L.
(2016). Automatic diagnosis system of transmission
line abnormalities and defects based on UAV. In 2016
4th Int. Conf. on Applied Robotics for the Power In-
dustry (CARPI). IEEE.
Zhu, L., Cao, W., Han, J., & Du, Y. (2013). A double-side
filter based power line recognition method for UAV
vision system. In 2013 IEEE Int. Conf. on Robotics
and Biomimetics (ROBIO). IEEE.
Towards the Automatic Visual Monitoring of Electricity Pylons from Aerial Images
573
