
A Study on Gamification Effectiveness
Petar Cvetkovic
1
, Charly Harbord
2 a
and Helmut Hlavacs
1 b
1
University of Vienna, Faculty of Computer Science, Vienna, Austria
2
Abertay University, School of Design and Informatics, Faculty of Games and Arts, Dundee, Scotland
Keywords:
Gamification, Effectiveness, Education, Feedback.
Abstract:
Studies have shown that gamification increases motivation and user experience when it comes to a certain
behavior or completing a process. Gamification is often deeply associated with na
¨
ıve animations and stylized
text. This paper addresses the effect that visual representation has on the motivation of a subject by measuring
their motivation after completing a mundane process, with both entertaining gamification elements as well as
gamification elements presented in plain text. For the purposes of this study a within subject design was used
to gather data. Participants completed the same mundane task three times, once without any gamification ele-
ments, once with pragmatic feedback and once with entertaining feedback. After completion, the participants
filled out the same Likert scale survey. The results, evaluated using the Wilcoxon Signed-Ranks test method,
indicated that there was not a significant difference in user motivation between the visually stylized and plain
text feedback. If conducted on a larger scale, this discovery could lead to a reduction in both time and cost for
gamification development.
1 INTRODUCTION
Gamification is the use of game design elements in
non-game settings to engage participants and encour-
age desired behaviors (Deterding et al., 2011) The
premise is that “to create an effect in non-game fields
by applying the game mechanics and game thinking
which make games fun; for example points, level-
up, ranking, achievements, competition, and rewards”
(Park and Bae, 2014). Gamification elements have
been used broadly in many different branches with
the goal to make processes more entertaining and eas-
ier to grasp (Deterding et al., 2011). However, it is
worth noting that “entertaining” motivational tricks
are subjective and are very much dependent on the
user’s perspective (Kuo and Chuang, 2016). In order
to motivate users; gamification inserts game mechan-
ics and dynamics into non-game contexts (de Marcos
et al., 2014). Within the field of motivation, they can
be seen to be two main branches: extrinsic and in-
trinsic. Extrinsic motivation refers to an action be-
ing completed with the knowledge that there will be
some defined reward at the end. Intrinsic motivation
however, refers to an action that is completed purely
a
https://orcid.org/0000-0001-7079-852X
b
https://orcid.org/0000-0001-6837-674X
for the joy of that action. It is this combination of
the intrinsic motivation of gameplay and educational
activities, which would normally be associated with
extrinsic motivation, that is of great interest to both
researchers and educators. Additionally, gamification
by way of increasing intrinsic motivation also has the
potential to improve engagement via the medium of
flow (Hamari, 2013; Huotari and Hamari, 2012; Csik-
szentmihalyi, 2009; Deci and Ryan, 1985). The re-
search described in this paper was designed as a case
study to investigate whether the visual presentation
of feedback has influence on the intrinsic motivation
when completing a process. The hypothesis being:
“Does visual representation improve user motivation
or just improve the over-all impression of the task?” If
the user motivation does not change drastically, then
the development time and cost of gamification ele-
ments would therefore be reduced. At present, within
the gamifiaction process a large proportion of time is
devoted to the design of visual elements. The efficacy
of gamification was measured by conducting a within
subject study with 10 participants and then evaluat-
ing the results using the Wilcoxon Signed Ranks Test
method.
This paper details the results of the experiment
carried out at the University of Vienna in 2019. The
remainder of the paper is organized as follows: Sec-
236
Cvetkovic, P., Harbord, C. and Hlavacs, H.
A Study on Gamification Effectiveness.
DOI: 10.5220/0009340102360244
In Proceedings of the 12th International Conference on Computer Supported Education (CSEDU 2020) - Volume 2, pages 236-244
ISBN: 978-989-758-417-6
Copyright
c
2020 by SCITEPRESS – Science and Technology Publications, Lda. All rights reserved

tion 2 provides information about studies which prove
that gamification overall improves the user motiva-
tion; Section 3 provides a description of the experi-
ment; Section 4 shares the results of findings; Sec-
tion 5 shows a detailed interpretation of the results
and Section 6 summarizes the findings and discusses
future work.
2 RELATED WORK
There have been an increasing number of scientific
papers that have described the analysis and applica-
tion of gamification and benefits from it. There has
been heavy focus on measuring and showing how
gamification elements improve user motivation and
according to (Vesa, 2017) more than 50 percent of the
organizations who manage an innovative process will
gamify their business. The subsections below serve as
examples for the application of gamification in differ-
ent professional situations.
2.1 Gamification in Education
Gamification plays a huge role in education. Games,
in any form, increase motivation through engagement,
participation, loyalty and competition (Alsawaier,
2018). The premise being that by employing the ‘en-
tertaining’ aspects of games and gameplay to a or-
dinary educational activities the student motivation
to complete those actions should increase (Kuo and
Chuang, 2016). According to Chou (Chou, 2019):
“...gamification is one of the methods that motivates
students to actively participate in class, learn through
entertainment by playing with their colleagues and
emphasize on the positive competition and also, to
make learning fun”. Gamification of within the field
education is often implemented within the classroom
setting during class time. One benefit of within class
use is that the students are able to follow their own
progress and achievements via instantaneous feed-
back allowing for an increase in motivation and en-
gagement (Kapp, 2012; Simoes et al., 2013)
2.2 Gamification in Medicine
Gamification is breaking the barriers of medicine by
using elements to increase motivation to become a
blood donor. “...development of applications that can
facilitate users to motivate each other doing voluntar-
ily and routinely blood donors, by gamification con-
cept.” (Prasetiantowibowo and Lusi-Ani, 2017).
2.3 Gamification in Sport
Gamification also influences the world of sports. As
stated in Chou (Chou, 2019): “people find it diffi-
cult to get time and interest for doing sports activ-
ities in the form of recreational sport...gamification
principles are used to enhance the experience in those
activities.” A good example of health and gamifica-
tion combined is the “Nike+ App”. This is a system
that calculates and transmits distance run and calo-
ries burned of a person by the utilization of a spe-
cially designed sensor attached to the running shoe
that syncs data with an iPod. By default, it promotes
social fun when used with friends, and aids the user
to plan, share, and complete exercise plans through
an app (Koivisto and Hamari, 2014). Feeding back to
the question that the paper aims answers of whether
or not the visual presentation of feedback elements
matter. Would the “Nike+ App” users run the same
distance if the feedback was presented in plain text,
or do the animation and pleasing visual design have a
motivational effect on performance?
3 DESCRIPTION OF THE
EXPERIMENT
The purpose of the research study was to explore the
impact of the representation of a single gamification
element – for the purposes of this study the gamifi-
cation element used was gamified feedback - on the
user’s intrinsic motivation and excitement in complet-
ing a mundane process. To conduct the study, a mun-
dane process was created and remained constant on
the left side of the screen, while the different feed-
back types changed on the right side.
3.1 Hypotheses
• Null hypotheses: The type of feedback has no in-
fluence on the intrinsic motivation of completing
a process.
• Alternate hypotheses 1: Showing only facts with-
out gamification elements motivate completing
the process less than using gamified feedback.
• Alternate hypotheses 2: Using a pragmatic gam-
ified feedback motivates completing the process
less (or more) than using entertaining feedback.
3.2 Experimental Participants
The study was conducted on June/July 2019. There
were no specific categories. The participants were
A Study on Gamification Effectiveness
237

taken from the general public. There were no restric-
tions to who the participants should be, the more di-
verse, the better. Among the participants, 6 out of 10
were female and 4 out of 10 were male. The average
age of the respondents were 22 years old.
3.3 Game Development
In order to develop the counting game (described in
the following section) and evaluate the experimental
results we used a number of software tools. “Bal-
samiq Mockups“
1
was used to draw the process and
feedback mock-ups during the game design. A screen
shot can be seen in Figure 1.
Figure 1: Screenshot of Balsamiq Mockups.
The game was developed using the popular game
engine “Unity 3D“
2
. Unity 3D is a general purpose
game engine which allows the launch of games on a
multitude of platforms, in our case the chosen plat-
form was Windows, a screen shot is shown in Figure
2.
Figure 2: Screenshot of Unity.
Finally, “IBM SPSS Statistics“
3
has been used to
derive statistical results.
1
https://balsamiq.com/
2
https://unity.com/
3
https://www.ibm.com/analytics/spss-statistics-
software
3.4 The Counting Game
For the purposes of the investigation, a mundane pro-
cess with three different variations of feedback was
developed and a questionnaire was designed. In the
game, the screen is split in the middle. The left side
displayed the mundane process and stayed constant
throughout. The right-side displayed the feedback
and changed depending on the feedback type. The
mundane process was defined to be subtracting the
number 11 from another given start number, as many
times as possible within 60 seconds. It was clear
that such a task soon becomes tedious and is gen-
erally considered not to be fun. The counting game
offered three levels, each of them representing a dif-
ferent feedback type. Figure 3 shows the game’s start
menu. At this point, the player can select one of three
levels of the game, each level representing one of the
three possible feedback types. In the following each
of the feedback types is described.
Figure 3: Main menu screen.
3.4.1 Level 1: No Feedback
There is no main goal or narrative of the game in this
level, the subject merely needed to answer as many
questions correctly as they could within 60 seconds.
The right-side of the screen shows a countdown timer
indicating the remaining time, correct answer count
and the correct/wrong text. Also, the decision was
made to not use sound effects. Figure 4 shows the
intro scene explaining how to play the game for the
no-feedback level. Figure 5 shows how the game pro-
gresses in the no-feedback level. The left upper im-
age, shows how the game starts, to the right, one an-
swer has been answered correctly. On the left lower
image, the game is shown after a number of correct
answers. On the lower right image, the case of a
wrong answer is shown.
CSEDU 2020 - 12th International Conference on Computer Supported Education
238
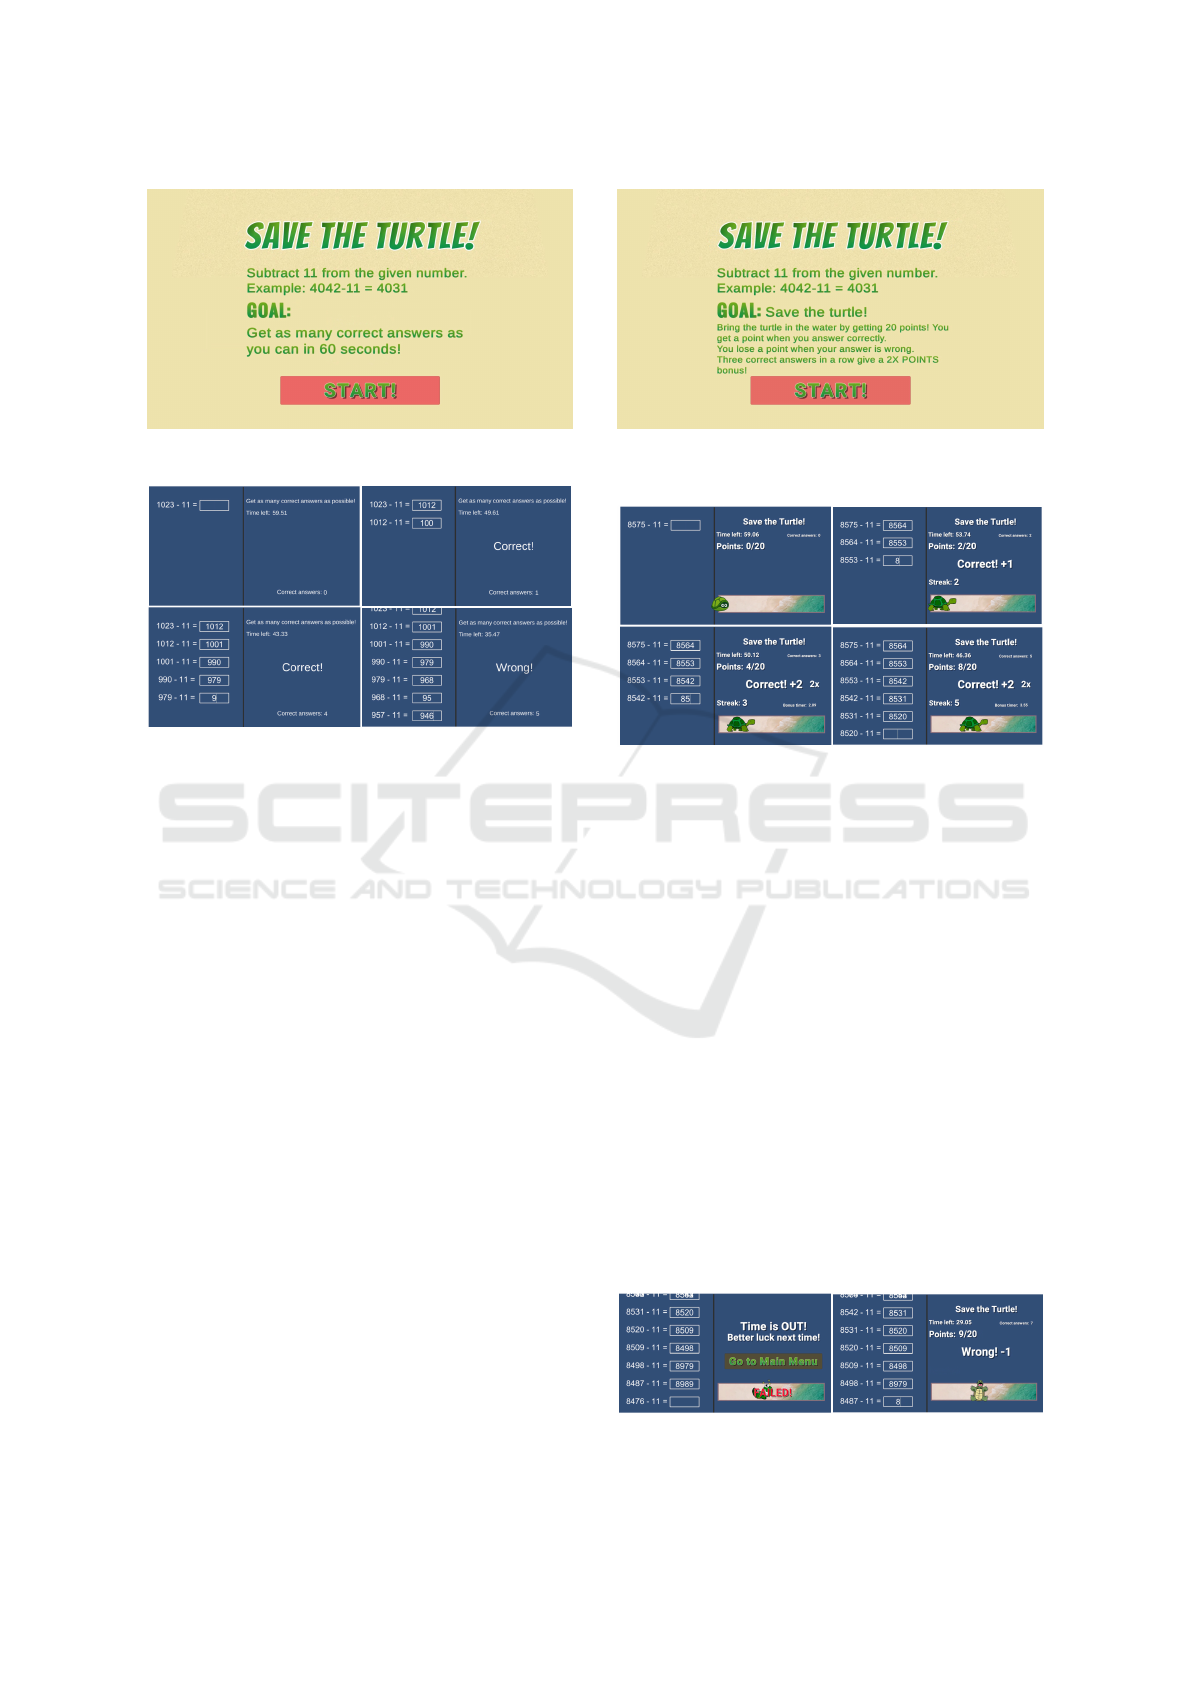
Figure 4: Intro scene no feedback.
Figure 5: Scenes from no feedback.
3.4.2 Level 2: Pragmatic Feedback
This level includes the introduction of a goal: to save
a turtle by leading it to the safety of the sea. The
goal can be achieved by reaching a total of 20 points.
Every correct answer counts as one point, and every
wrong answer reduces the score by a point. Depend-
ing on the amount of points, the turtle moves closer
to or further away from the sea, which is also graphi-
cally shown on the right feedback screen. After three
correct answers in a row, a double points bonus is
awarded. However, the bonus disappears if the user
does not submit another correct answer within 4 sec-
onds, or if the next answer is wrong. The feedback
is presented as plain text. There are also added sound
effects for the correct and wrong answers.
Due to the narrative, this level is considered to be
gamified, though only to a bare minimum. Depictions
of successes or failures are not exaggerated. Instead,
the additional motivation is given mainly due to the
narrative, something that gives meaning to the pro-
cess. Figure 6 shows the intro scene of the game for
pragmatic feedback, describing the game functions.
Figures 7 and 8 show a progression of this level. Fig-
ure 7 depicts the feedback of correct answers, while
Figure 8 shows the conquences of submitting wrong
answers or even failing to achieve the level goals.
Figure 6: Intro Scene from pragmatic and entertaining feed-
back.
Figure 7: Scenes from pragmatic feedback.
3.4.3 Level 3: Entertaining Feedback
The goal and mechanics of this level are kept the same
as the pragmatic feedback level. However, the feed-
back differs in two ways: firstly, it utilizes colorful
animation, and more sound effects. Secondly, the cre-
ation of tangible achievements in the form of medals
which can be gained by getting three, five and ten cor-
rect answers in a row. Sound effects are added for
typing, the correct answer, the wrong answer, bonus,
bonus loss, medals, and general background music.
The introduction to the ‘game’ was kept the same as
pragmatic feedback (Huotari and Hamari, 2012), as
depicted in Figure 6.
This level is considered to be strongly gamified, it
looks and feels like a computer game made for enter-
tainment purposes only. The gamification of feedback
here is exaggerated, and represents an extreme “sugar
coating” of the mundane counting process. Figure
[9] shows the feedback of correct answers, providing
Figure 8: Scenes from pragmatic feedback.
A Study on Gamification Effectiveness
239
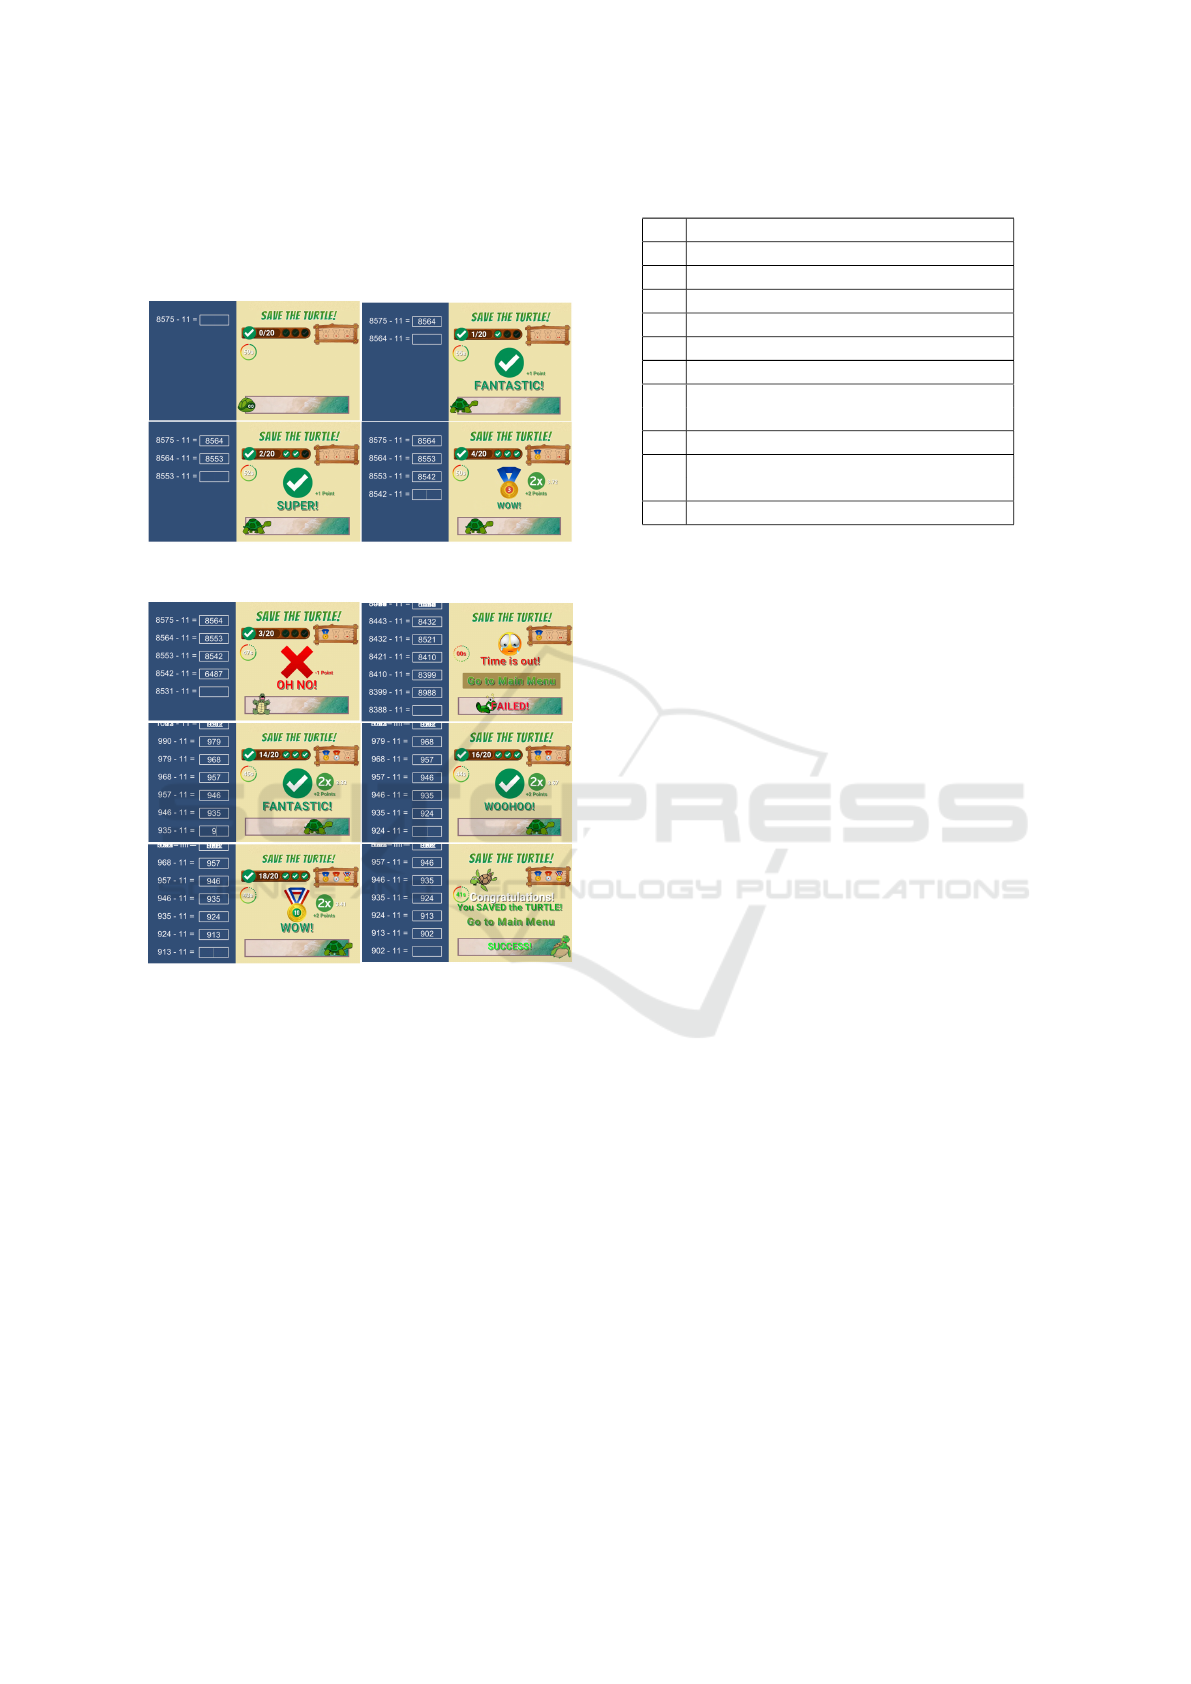
multiple positive reactions. Figure 10 on the upper
row shows the feeback for wrong answers or failure,
the rows below show feedback for success including
streaks and medals.
Figure 9: Scenes from childish feedback.
Figure 10: Scenes from childish feedback.
4 EXPERIMENTAL EVALUATION
Data was collected in person and there were no spe-
cial conditions required for running the project. A
within subject study design was used as this allowed
for the same users to test all conditions, complete
the process three times and fill out the same ques-
tionnaire after each completion. The feedback or-
der was randomized for preventing any particular or-
dering of introducing a bias to the results. The sur-
vey answers were rated with a Likert scale utilizing
5 levels: strongly disagree, weakly disagree, neu-
tral, weakly agree, and strongly agree. Values be-
tween -2 (strongly disagree) to +2 (strongly agree)
were awarded. The survey questions are due (Deter-
ding et al., 2011) and formulated in a positive way.
They can be found in the Table 1.
Table 1: List of questions from the survey.
Please rate the following statements.
1 Completing the process was fun
2 I felt excited
3 I never felt bored
4 I would complete the process again
5 I felt like a MATH GENIUS
6 I felt like I was really saving the turtle
7 I felt motivated to get as many correct
answers as possible
8 Answering correctly felt rewarding
9 I double checked my answer to make
sure I don‘t answer wrong
10 I forgot I was doing math
4.1 Experimental Results
A Wilcoxon signed-ranks test were used for result
evaluation, because the within subject design de-
mands that the same subjects test multiple times, and
it results in paired samples. The Wilcoxon signed-
rank test is a non-parametric hypothesis test decid-
ing whether two related samples stem from the same
population or not (Wilcoxon, 1945). Data comes in
pairs, and the null-hypothesis is that they come from
the same population. Each pair is chosen randomly
and independently,
To test the hypotheses, the Wilcoxon signed ranks
test was executed three times. First the “No feed-
back“ and “Pragmatic feedback” results were com-
pared. Followed by “no feedback” and “Entertaining
feedback”, and finally “Pragmatic feedback” and “En-
tertaining feedback”. The survey consists of 10 ques-
tions; for each question, the sum of values from all
participants was calculated, which resulted in 10 spe-
cific values - one value for each question. So, the sum
of all participants ratings for one answer was viewed
as one score. This in return gives 10 answers for each
feedback type, and the difference between them are
compared. Results were calculated using the SPSS
statistics tool. Significance level alpha for a Wilcoxon
signed ranks test was 0.05.
In order for there to be a significant difference be-
tween two median values, the p value has to be less
than significance level value, and if it is, the null hy-
pothesis which states that there is no difference is
rejected. The total scores that were calculated are
shown in Table 2, (Park and Bae, 2014).
Though for a Wilcoxon singed-ranks test an in-
terval scale is recommended, for within-pair compar-
isons an ordinal scale is sufficient. We can thus sub-
mit the data from Table 2 to this test.
CSEDU 2020 - 12th International Conference on Computer Supported Education
240

Table 2: Sum of scores for each question of the survey.
Question No feedb Pragmatic Entertaining
1 2 6 8
2 1 12 8
3 3 10 9
4 -5 6 4
5 -4 -5 -3
6 -11 -11 -1
7 10 16 12
8 -2 13 10
9 -11 -11 -10
10 -6 -6 -7
4.2 No Feedback vs. Pragmatic
Feedback
In this section we compare the results from “No feed-
back” to those of “Pragmatic feedback”. The null hy-
pothesis and its alternative are given by the following
statements:
Null Hypothesis: The type of feedback has no influ-
ence on the intrinsic motivation of completing a pro-
cess.
Alternative 1: Only facts without gamification ele-
ments motivate completing the process less than gam-
ified feedback. (the type of feedback HAS influence
on intrinsic motivation of completing a process)
Looking at the descriptive statistics shown in Ta-
ble 3, we can see that the mean value of all answers
for “No feedback” is negative (-2.30) and positive
(3.00) for the “Pragmatic feedback”, which already
shows that there is a difference between the two feed-
back types.
Table 3: Descriptive Statistics for “No feedback” and “Prag-
matic feedback”, including 25th, 50th (median), and 75th
percentiles.
Descriptive statistics
N Mean SDev Min Max 25th 50th 75th
No fb 10 -2.30 6.533 -11 10 -7.25 -3.00 2.25
Pragmatic 10 3.00 10.296 -11 16 -7.25 6.00 12.25
If we pay attention to the ranks shown in Table 4,
we notice that there is only one negative rank, mean-
ing only one from ten questions was in favor of “No
feedback“, six of them were in favor of “Pragmatic
feedback“ and three of them were tied.
Finally looking at the actual test statistics as de-
picted in Table 5, we notice that the Z value is -2.201
and the p value is 0.028.
As already stated, if the p value is smaller than the
alpha value, we reject the null hypothesis. In our case
0.028 is in fact smaller than 0.05 which means that
the type of feedback HAS influcence on the intrinsic
Table 4: Ranks table for “No feedback” and “Pragmatic
feedback”.
Ranks
N
Mean
Rank
Sum of
Ranks
Pragm. fb-
No fb
Neg. Ranks 1
a
1.00 1.00
Pos. Ranks 6
b
4.50 27.00
Ties 3
c
Total 10
a. Pragmatic fb < No fb
b. Pragmatic fb > No fb
c. Pragmatic fb = No fb
Table 5: Test statistics for ”No feedback” and ”Pragmatic
feedback”.
Test Statistics
a
Pragmatic fb
- No fb
Z -2.201
b
Asymp. Sig. (2-Tailed) 0.028
a. Wilcoxon Signed Ranks Test
b. Based on negative ranks.
motivation of completing a process. So we reject the
null hypothesis in favor of the alternative hypothesis.
We can conclude that a Wilcoxon Signed-Ranks
test indicated that only facts without gamification ele-
ments motivate completing the process less than gam-
ified feedback. Thus the type of feedback HAS influ-
ence on the intrinsic motivation of completing a pro-
cess.
To take this a step further, we can calculate the
effect size by using the following formula:
r = |
Z
√
N
|.
The formula includes the Z value and N representing
the number of samples which is 10 for each group,
which means 20.
r = |
(−2.201)
√
20
| = 0.4921.
Based on the following effect size interpretations as
shown in Table 6 we can conclude that the effect size
is medium but very close to being large.
Table 6: Cohen’s effect size table.
Effect size r
Small 0.10
Medium 0.30
Large 0.50
We conclude that the participants enjoyed the
pragmatic feedback more than no feedback. Finally,
A Study on Gamification Effectiveness
241

the hypothesis test summary from SPSS statistics tool
is shown in Table 7, including the decision about the
null hypothesis.
Table 7: Hypothesis test summary for “No feedback” vs.
“Pragmatic feedback”.
Hypothesis Test Summary
Null Hyp Test Sig. Decision
Median of Related-Samples 0.028 Reject
differences btw Wilcoxon null
No fb and Signed Rank hypoth.
Pragm. fb is 0 Test
The significance level is 0.05.
4.3 No Feedback vs. Entertaining
Feedback
There was no real need to test the “No feedback” with
“Entertaining feedback” but for checking consistency
it was also carried out, as it might give some interest-
ing insight. The hypothesis remains the same:
Null Hypothesis: The type of feedback has no influ-
ence on the intrinsic motivation of completing a pro-
cess.
Alternative 1: Only facts without gamification ele-
ments motivate completing the process less than gam-
ified feedback. (the type of feedback HAS influence
on intrinsic motivation of completing a process)
The mean value of all answers for “No feedback“
is the same as before: negative (-2.30) and we can
see that the “Entertaining feedback“ has the same
mean value (see Table 8) as the “Pragmatic feed-
back“: positive (3.00) for the “Pragmatic feedback“,
which makes it interesting for the comparison be-
tween “Pragmatic“ and “Entertaining“ feedback.
Table 8: Descriptive Statistics for “No feedback” vs. “En-
tertaining feedback”.
Descriptive statistics
N Mean SDev Min Max 25th 50th 75th
No fb 10 -2.30 6.533 -11 10 -7.25 -3.00 2.25
Childish fb 10 3.00 7.732 -10 12 -4.00 6.00 9.25
The resulting ranks (see Table 9) from “Entertain-
ing feedback“ performed a lot better than “Pragmatic
feedback“ with nine positive and one negative ranks,
meaning only one from ten questions was in favor of
“No feedback“ and all the rest were in favor of “En-
tertaining feedback“.
A conclusion can already be drawn that there is
a significant difference between entertaining and no
feedback, but to verify, it was noticed that the Z value
is -2.608 and the p value is 0.009, which means that
p is much smaller than alpha (0.05) and the null hy-
pothesis is rejected, as shown in Table 10.
Table 9: Ranks table for “No feedback” vs. “Entertaining
feedback”.
Ranks
N
Mean
Rank
Sum of
Ranks
Childish fb-
No fb
Negative Ranks 1
a
2.00 2.00
Positive Ranks 9
b
5.89 53.00
Ties 0
c
Total 10
a. Entertaining fb < No fb
b. Entertaining fb > No fb
c. Entertaining fb = No fb
Table 10: Test statistics for “No feedback” vs. “Entertaining
feedback”.
Test Statistics
a
Childish fb
- No fb
Z -2.608
b
Asymp. Sig. (2-Tailed) 0.009
a. Wilcoxon Signed Ranks Test
b. Based on negative ranks.
We can conclude that a Wilcoxon Signed-Ranks
test indicated that seeing only facts without gamifi-
cation elements motivate completing the process less
than gamified feedback. Thus the type of feedback
HAS influence on the intrinsic motivation of complet-
ing a process.
The effect size for “Entertaining feedback“ vs.
“No feedback“ is
r = |
(−2.608)
√
20
| = 0.4721.
This means that the effect size is medium, but we can
also see that the effect size is actually smaller than
the one from “Pragmatic feedback“, already indicat-
ing that going from pragmatic to entertaining might
not necessarily result in an increased motivation.
Finally, the hypothesis test summary from SPSS
is shown in Table 11.
Table 11: Hypothesis test summary for “No feedback” vs.
“Entertaining feedback”.
Hypothesis Test Summary
Null Hypothesis Test Sig. Decision
Median of diffs. Related-Samples 0.009 Reject
between No fb and Wilcoxon Signed the null
Entertaining fb equals 0 Rank Test hypothesis
Asymptotic significances are displayed.
The significance level is 0.05.
4.4 Pragmatic Feedback vs.
Entertaining Feedback
Finally, we compare the two gamification level “Prag-
matic feedback” vs. “Entertaining feedback”. Null
CSEDU 2020 - 12th International Conference on Computer Supported Education
242
hypothesis and alternative are given in the following
statements:
Null Hypothesis: “Pragmatic feedback” motivates
completing the process the same as “Entertaining
feedback”.
Alternative 1: “Pragmatic feedback” motivates com-
pleting the process less (or more) than “Entertaining
feedback”.
Both feedback types were compared with “No
feedback” and the mean values were the same, but
“Entertaining feedback” did a lot better on the ranks,
and “Pragmatic feedback” had a bigger effect size.
Comparing both results might shed light on the ques-
tion whether there is a significant difference between
the two feedback types according to the participants.
As demonstrated previously, when comparing both
feedback types to “No feedback”, the mean value of
all answers for “Pragmatic feedback” and “Entertain-
ing feedback” are the same (3.00), see Table 12. The
minimum value of pragmatic was -11, and -10 for
entertaining, and maximum values are 16 and 12 for
pragmatic and entertaining respectfully. The descrip-
tive statistics are still ambiguous, which is why it was
decided to proceed to the actual Wilcoxon signed-
ranks test results.
Table 12: Descriptive Statistics for “Pragmatic feedback”
vs. “Entertaining feedback”.
Descriptive statistics
N Mean SDev Min Max 25th 50th 75th
Pragmatic fb 10 3.00 10.296 -11 16 -7.25 6.00 12.25
Entertaining fb 10 3.00 7.732 -10 12 -4.00 6.00 9.25
From a total of 10 questions, 6 of them were in
favor of the pragmatic feedback and 4 of them were
in favor of the Entertaining feedback (see Table 13).
This is very interesting, because it could be assumed
that the inclusion of animation, sound effects and
graphical presentation would be more appealing than
plain text, but it appears that the pragmatic feedback
performed better.
Table 13: Ranks table for “Pragmatic feedback” vs. “Enter-
taining feedback”.
Ranks
N
Mean
Rank
Sum of
Ranks
Childish fb-
Pragmatic fb
Negative Ranks 6
a
5.50 33.00
Positive Ranks 4
b
5.50 22.00
Ties 0
c
Total 10
a. EntertainingFeedback¡ PragmaticFeedback
b. EntertainingFeedback¿ PragmaticFeedback
c. EntertainingFeedback = PragmaticFeedback
Our Z value is -0.564 and the p value is 0.573
as shown in Table 14. 0.573 is bigger than 0.05
which means that we retain the null hypothesis and
Table 14: Test statistics for “Entertaining feedback” vs.
“Pragmatic feedback”.
Test Statistics
a
Childish fb
- Pragmatic fb
Z -0.564
b
Asymp. Sig. (2-Tailed) 0.573
a. Wilcoxon Signed Ranks Test
b. Based on negative ranks.
that “Pragmatic feedback” motivates completing the
process in the same way as “Entertaining feedback”.
Even more, when considering the ranks we can con-
clude that the “Pragmatic feedback” actually per-
formed better than the “Entertaining feedback.” The
effect size is calculated to be
r = |
(−0.564)
√
20
| = 0.1261.
The effect size r is thus small, close to non-existent.
We can conclude that subjects did not experience sig-
nificant difference in intrinsic motivation for complet-
ing the process when it was presented in plain text
versus entertaining graphics.
Finally, the hypothesis test summary from SPSS
is shown in Table 15.
Table 15: Hypothesis test summary for ”Pragmatic feed-
back” vs. ”Entertaining feedback”.
Hypothesis Test Summary
Null Hypothesis Test Sig. Decision
Median of diffs. Related-Samples 0.573 Retain
betw. Pragm. fb and Wilcoxon Signed the null
Entertaining fb equals 0 Rank Test hypothesis
Asymptotic significances are displayed. Significance level is 0.05.
5 DISCUSSION
As previously noted, there are already a number of
studies have been conducted showing that a mundane
process becomes easier to complete with introduction
of gamification elements. The results of this research
mirror those that have gone before, with our partici-
pants indicating that “No feedback” performs signifi-
cantly worse than pragmatic or entertaining.
It was intriguing to find out that visual elements
do not play a role in motivation. It was previously
stated that “Entertaining feedback” would outperform
“Pragmatic feedback”, but our results have shown that
the motivation does not significantly change depend-
ing on the visuals. The implementation of “Entertain-
ing feedback” took more than twice the time of the im-
plementation of “Pragmatic feedback” and “No feed-
back” combined. Since our results show that this ad-
A Study on Gamification Effectiveness
243

ditional implementation effort does not improve par-
ticipant motivation, it makes sense to save this effort
in favor of other aspects, like logging more data, or
increasing the length of the game.
It is also interesting to note that some participants
really focused on the sound effects. “Entertaining
feedback” had better sound effects, but pragmatic had
a distinct “TRUE” or “FALSE” sound effects which
the subjects reported finding really helpful. One of
the participants had a notable comment for “No feed-
back”. The participant kept answering incorrectly
without noticing, because their attention was not on
the visual feedback, but the sound feedback, which
is missing in the “No feedback” level. The comment
was: “The problem was I did not hear I was wrong!”.
It can be said that whilst gamified feedback elements
are important and improve user motivation, the way
that they are presented does not make a drastic differ-
ence.
5.1 Limitations of the Study
The main limitation of this approach was that the
study was the amount of people reached who partici-
pated. It was not possible to reach a wide variety of
ages, professions etc. For example, it would be inter-
esting to see how an 8-year-old would react to doing
math in order to save the turtle.
6 CONCLUSIONS AND FUTURE
WORK
In this paper, the value of the gamification of feedback
was addressed together with the importance of visual
presentation. Our main contribution is that users are
not significantly more motivated to complete a mun-
dane process when feedback is presented in an enter-
taining way rather than as plain text.
REFERENCES
Alsawaier, R. (2018). The effect of gamification on motiva-
tion and engagement. International Journal of Infor-
mation and Learning Technology Vol. 35 No. 1, pages
pp. 56–79.
Chou, Y. (2019). Actionable gamification: Beyond points,
badges, and leaderboards. Packt Publishing Ltd.
Csikszentmihalyi, M. (2009). Flow. Harper and Row., New
York.
de Marcos, L., Domiguez, A., Saenz-de Navarrete, J., and
Pages, C. (2014). An empirical study comparing gam-
ification and social networking on e-learning. Com-
puters & Education 75, pages pp.82–91.
Deci, E. and Ryan, R. (1985). Intrinsic motivation and self-
determination in human behavior. Plenum, New York.
Deterding, S., Dixon, D., Khaled, R., and Nacke, L. (2011).
From game design elements to gamefulness: defin-
ing gamification. In 15th International academic
MindTrek conference: Envisioning future media en-
vironments., pages pp. 9–15.
Hamari, J. (2013). Transforming homo economicus into
homo ludens: A field experiment on gamification in
a utilitarian peer-to-peer trading service. Electronic
Commerce Research and Applications 12(4), pages
pp.236–245.
Huotari, K. and Hamari, J. (2012). Defining gamification
- a service marketing perspective. In The 16th Inter-
national Academic MindTrek Conference., pages pp.
17–22., Tampere.
Kapp, K. (2012). The gamification of learning and instruc-
tion. Pfeiffer, San Francisco, CA.
Koivisto, J. and Hamari, J. (2014). Demographic differ-
ences in perceived benefits from gamification. Com-
puters in Human Behavior 35, pages pp. 179–188.
Kuo, M. and Chuang, T. (2016). How gamification moti-
vates visits and engagement for online academic dis-
semination: An empirical study. Computers in Human
Behavior 55, pages pp. 16–27.
Park, H. and Bae, J. (2014). Study and research of gamifi-
cation design. Int. J. Softw. Eng. Appl.
Prasetiantowibowo, L. S. N. and Lusi-Ani, C. E. (2017). Im-
plementation of gamification to improve blood donors
by peer motivation application.
Simoes, J., Redondo, R., and Vilas, A. (2013). A social
gamification framework for a k-6 learning platform.
Computers in Human Behavior 29(2), pages pp.345–
353.
Vesa, M. e. a. (2017). Computer games and organiza-
tion studies. Organization Studies 38(2), page pp.
273–284.
Wilcoxon, F. (1945). Individual comparisons by ranking
methods. Biometrics Bulletin 1 (6), page pp. 80–83.
CSEDU 2020 - 12th International Conference on Computer Supported Education
244
