
Prediction Method of Plant Irrigation Timing
Considering Data Imbalance
Ryosuke Mizuno
1
, Masaya Goto
1
and Hiroshi Mineno
1,2
1
Graduate School of Integrated Science and Technology, Shizuoka University, Japan
2
Research Institute of Green Science and Technology, Shizuoka University, Japan
Keywords: Imbalanced Data, Internet of Things (IoT), Artificial Intelligence (AI), Agriculture, Water-saving
Cultivation.
Abstract: Predicting the plant irrigation timing is an essential task in the domain of agriculture. A model that can
predict the irrigation timing in tomato cultivation can assist new farmers who do not have sufficient
experience and intuition. In this study, we propose an irrigation timing prediction method based on past
irrigation data, environmental data, and plant water stress using a Random Forest model, which is a general
machine learning method. Our proposed model reproduces irrigation decision making by an expert farmer
for new farmers. Furthermore, we propose a method for resolving imbalances, focusing on the change in the
characteristics of the state of plants due to irrigation. This is because irrigation timing data has a large
imbalance, which is known to be difficult to formulate. Our proposed model clarifies the characteristics of
the irrigation class, and can suppress its misjudgment. We evaluated the proposed method using tomato
cultivation greenhouse data in Shizuoka, Japan. The results show a recall of 92% and f-measure 69% and
hence, the irrigation timing can be predicted with high accuracy. In addition, the results show that the model
works effectively to automatically determine the irrigation timing in greenhouse tomato cultivation.
1 INTRODUCTION
The internet of things (IoT) and artificial intelligence
technology have been advanced and spread, and
computers now support human decision making. In
the domain of agriculture, several studies have been
conducted to address the problems arising from the
aging of the farmer population and the lack of heirs.
These studies can be categorized as: studies to
support the work process of farmers using
technology (Vasconez, Kantor, & Auat Cheein,
2019), and studies to formulate and mechanize the
decision making of farmers (Yukimasa et al., 2017;
Navarro-Hellín et al., 2016).
Studies to support and mechanize the work
performed by farmers use sensors, robots, and IoT
technology to make farming efficient. For example,
a farmer can monitor and control a farm without
even visiting it by checking and controlling the
sensors installed on the farm through the web or a
smartphone (Capraro, Tosetti, Rossomando, Mut, &
Serman, 2018; Joaquín,Gutiérrez, Jua, Francisco,
Aracely, & Miguel, Porta-Gándara, 2015). In
addition, by using autonomously operated tractors
and drones, crops can be harvested without the
farmer’s effort and agricultural chemicals can be
efficiently sprayed with little effort (Vasconez et al.,
2019).
Studies to formulate and mechanize decision
making of farmers reproduce advanced cultivation
techniques based on farmer’s experience and
intuition. For this, the plant status, which is
complex, is analyzed and quantified using various
sensing data, such as temperature, humidity,
scattered light, plant image, evapotranspiration, and
plant water stress. In particular, a few studies z
(Yukimasa et al., 2017; Liu et al., 2017; Peng et al.,
2019) have formulated the decision-making with
small and frequent irrigation which is known as
water stress cultivation. This is convenient to
automatically cultivate high-quality fruits and crops.
Peng et al. (2019) proposed a crop water demand
prediction system by using the back propagation
(BP) neural network. The BP neural network was
trained using various environmental data such as the
solar radiation, soil moisture, soil electrical
conductivity, and temperature. The water demand
was evapotranspiration calculated by the Penman-
Mizuno, R., Goto, M. and Mineno, H.
Prediction Method of Plant Irrigation Timing Considering Data Imbalance.
DOI: 10.5220/0009339801770184
In Proceedings of the 9th International Conference on Smart Cities and Green ICT Systems (SMARTGREENS 2020), pages 177-184
ISBN: 978-989-758-418-3
Copyright
c
2020 by SCITEPRESS – Science and Technology Publications, Lda. All rights reserved
177
FAO formula (Liu et al., 2017). In order to realize
automatic cultivation, it is necessary to determine
the predicted water demand threshold based on
appropriate irrigating timing. Determining the
threshold value is difficult for new farmers because
this requires experience and intuition cultivated over
a long period of time. Yukimasa et al. (2017)
proposed a model for predicting future plant water
stress by using the Sliding Window-based Support
Vector Regression (SW-SVR). The method was
evaluated using environmental data inside the
greenhouse and image data being generated from the
movement of plant leaves. This study made it easy
to understand future water stress using a simple and
economical sensor. In addition, the model can
understand the water stress from the data of the
cultivation environment. Therefore, not only expert
farmers, but also, new farmers who do not possess
sufficient experience of cultivation can understand
the water stress with the prediction of future water
stress by this method. However, in order to realize
automatic cultivation, it is necessary to determine
the predicted water stress threshold based on
appropriate irrigating timing likewise Peng et al.
(2019).
We propose an irrigation timing prediction
method based on past irrigation data, environmental
data, and plant state data by using machine learning.
Our proposed method reproduces irrigation decision
making by experts and helps new farmers.
Furthermore, we propose a method that resolves
imbalances by focusing on the change characteristics
of the state of plants from irrigation. This is because
the small and frequent irrigation data such as that of
the cultivation of tomato and strawberry has a large
imbalance that is known to be difficult to formulate.
The small and frequent irrigation is conducted
approximately 50 times (total time is approximately
50 minutes) during the day, and non-irrigation
accounts for the major part of the day.
This paper brings two key contributions to the
field of agriculture research: (1) New farmers can
achieve automatic cultivation of fruits of high
quality. This is because the proposed model uses IoT
devices in the greenhouse. (2) Our proposed model
leads to the technology development of modeling of
small and frequent irrigation with data imbalance in
the domain of agriculture.
The rest of the paper is organized as follows:
Section 2 presents a discussion of related techniques
of resolving imbalanced data. Section 3 describes
the proposed method. Section 4 presents the results
from the evaluation of the proposed method using
actual agricultural data. Finally, we present the
conclusions and future work in Section 5.
2 TECHNIQUES TO RESOLVE
IMBALANCED DATA
To solve the imbalance of datasets is an important
task in predicting irrigation timing using machine
learning. There are a few methods to solve data
imbalance such as classifier level methods and data
level methods.
Classifier level methods are cost-sensitive
learning methods that vary the error transmitted to
each class. Cost-sensitive learning methods assign
weights to the samples to match a specific data
distribution. Weighting by inverse class frequency
(Chen, Change, & Xiaoou, 2016; Yu-Xiong et al.,
2017) has often been adopted. To rephrase, the
minority data which is difficult to classify, weights
the penalty. In our evaluation, we adopt cost-
sensitive learning, in which the reciprocal of the
ratio of minority data to the number of data points is
multiplied as a penalty for errors in the minority data.
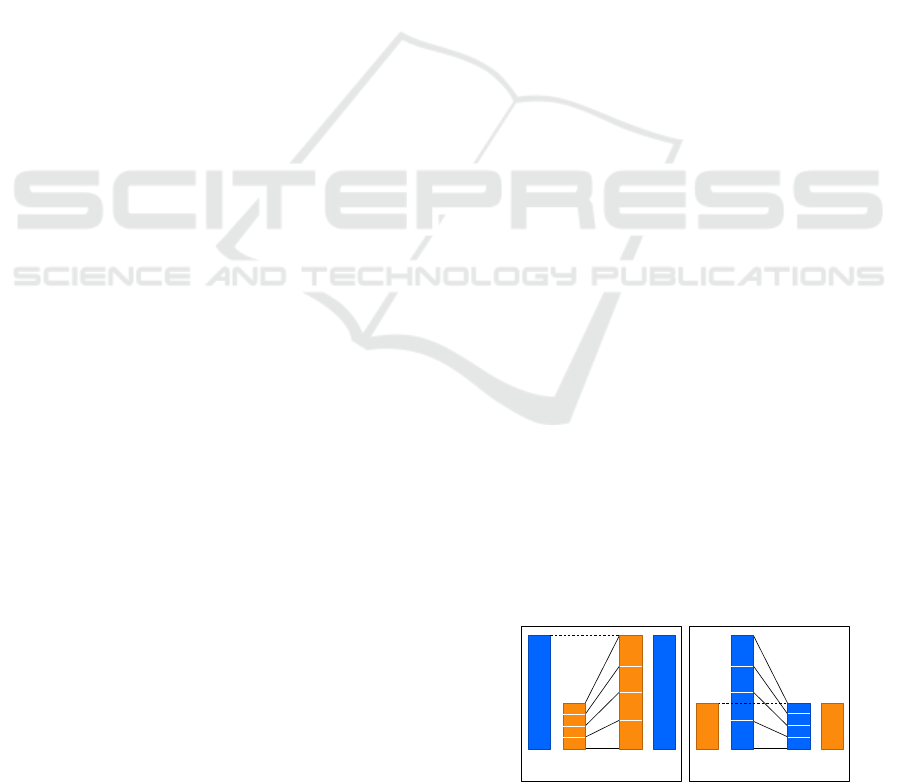
Data level methods are data sampling techniques.
Two types of sampling techniques are shown in
Figure 1: oversampling methods that increase the
number of minority data and undersampling
methods that reduce the number of majority data.
Oversampling methods add or reuse new data to
increase the minority data. Random sampling
repeatedly samples from the minority data. Synthetic
Minority Over-sampling Technique (SMOTE)
(Chawla et al., 2002) and Adaptive Synthetic
Sampling (ADASYN) (Haibo et al., 2008) share the
concept of generating new data on a line connecting
minority data. SMOTE adds a random number
multiplied with the sample on the line connecting
the selected minority samples. In ADASYN, the
value to be multiplied is determined according to the
number of majority data contained in the K
neighbors of the selected minority sample. Therefore,
ADASYN reduces the frequency with which
minority data is generated near the majority data.
However in irrigation timing data, the minority data
is similar to the majority data, and hence, we
consider the data generated near the majority data.
Undersampling methods eliminate a few samples
from the majority data. Random sampling randomly
Figure 1: Addressing imbalanced data with resampling.
Oversampling
Original
(Imbalanced)
Balanced
Undersampling
Original
(Imbalanced)
Balanced
SMARTGREENS 2020 - 9th International Conference on Smart Cities and Green ICT Systems
178

Algorithm 1: Undersampling for eliminating data based on near irrigation timing.
Input:
Imbalanced dataset:
=
,
, …,
,
ℎ
∈
,
∈
Distance parameter: n, m
Output:
Balanced dataset:
=
,
, …,
,
ℎ
∈
,
∈
Definition of Undersampling for eliminating data based on near irrigation timing:
For t=1 to N
if
is irrigation
Eliminate non-irrigation data for period
−
to
−1
Eliminate non-irrigation data for period
+1
to
+
← Remaining data not eliminated
determines the samples to be removed from the
majority data. NearMiss algorithm (Jianping &
Inderjeet, 2003; Yen & Lee, 2009) uses the K-
nearest neighbor method to remove clearly
identifiable majority data. This eliminates data that
is difficult to distinguish from between the minority
class and the majority class. Therefore, it is possible
to separate the details of the decision boundary by
using data after applying the NearMiss algorithm.
However, it is difficult to determine the parameters
of the K-neighbor method using NearMiss. This is
because the irrigation timing data has a characteristic
minority data and majority data that are similar. We
consider that undersampling is suitable for resolving
irrigation data imbalance. Therefore, we propose an
undersampling method considering the
characteristics of the irrigation data of plants. This is
because the farmer does not irrigate depending on
the moisture state of the plant even at the same
temperature. Irrigation is performed depending on
the amount of solar radiation and season even in
different plant water states. Therefore, we consider it
better to reduce the data so that the irrigation class
and the non-irrigation class are clear rather than
increasing the data using oversampling or by
considering the cost.
3 MODEL DESCRIPTION
We propose a method for resolving imbalances
suitable for irrigation timing to build the model. We
aim to build the model to predict the irrigation
timing by farmers using the environmental data of
the greenhouse and hereby, reproduce the irrigation
timing automatically. Furthermore, we aim to
automatically cultivate by controlling IoT devices,
which are able to control the irrigation timing in the
greenhouse based on the proposed method. The
process is composed of two main elements to build
the irrigation timing model. First, we address the
imbalance of irrigation timing data by using
undersampling for eliminating data based on near
irrigation timing (ENIT). Next, we build the model
to predict the irrigation timing using the balanced
data after solving imbalance. Section 3.1 presents
the algorithm of ENIT and Section 3.2 presents the
irrigation timing prediction method using machine
learning.
3.1 Addressing Irrigation Data
Imbalance
We address the imbalance in the irrigation timing
data by using undersampling for eliminating data
based on near irrigation timing (ENIT) to eliminate
the data of majority class (non-irrigation data) near
the time of the data of minority class (irrigation data)
(Algorithm 1). It may be noted that the irrigation
timing data is imbalanced because the frequency of
irrigation time is approximately 50 (total time is
approximately 50 minutes) during the day, and non-
irrigation accounts for the major part of the day. One
of the decisions on irrigation timing is to use the
value of solar radiation accumulated from the
previous irrigation (Takayoshi et al., 2018).
Similarly, the value of evapotranspiration is used for
the decision on irrigation timing (Pawlowski et al.,
2017; Peng et al., 2019). Irrigation is performed
when the accumulated value exceeds the threshold.
Therefore, we have considered that the plant state at
Prediction Method of Plant Irrigation Timing Considering Data Imbalance
179
the time of irrigation and the plant state in the past
direction for a certain period of time from the start
of irrigation are similar. The accumulated
environmental data, for example temperature and
evapotranspiration from the last irrigation, are also
assumed to be characteristically similar. In addition,
we have considered that the state of the plants near
irrigation are similar because irrigated plants need
time to absorb moisture from the soil through the
roots and through evapotranspiration from the leaves
to allow water to enter the body. For this reason, we
have eliminated the data of the majority class (non-
irrigation class) which is near the data of minority
class (irrigation timing class) by using ENIT. ENIT
is an undersampling method that removes the non-
irrigation data that is nearer in the time series based
on irrigation timing, and the algorithm is shown in
Algorithm 1. In the ENIT algorithm, when the
duration of irrigation timing is t, the non-irrigation
data represented by (t-n), …, (t-1) is eliminated for
the parameter n in the past direction and the non-
irrigation data represented by (t+1), … , (t+m) is
eliminated for the parameter m in the future
direction. As a result, the non-irrigation class data
that has similar characteristics to the irrigation class
is eliminated by selecting the data from the non-
irrigation class of the majority based on the
irrigation class of the minority. In addition, the
characteristics of the irrigation class are clarified and
misjudgment is suppressed.
3.2 Predicting the Irrigation Timing
We have used Random Forest (RF) to predict the
irrigation timing when irrigation is necessary. The
RF is one of the general machine learning methods
and is an ensemble learning method combining
multiple decision trees. An ensemble learning
method is a modeling method that consists of a
combination of prediction of multiple classifiers
rather than the prediction of a single classifier. By
applying ensemble learning, the predictive value is
diverse and can be predicted robustly for unknown
data. Therefore, we have adopted ensemble learning
in order to make a robust prediction model.
4 EXPERIMENTAL PROCEDURE
In this section, we describe the dataset of the
experiment for evaluation, the experimental
parameters, and the results.
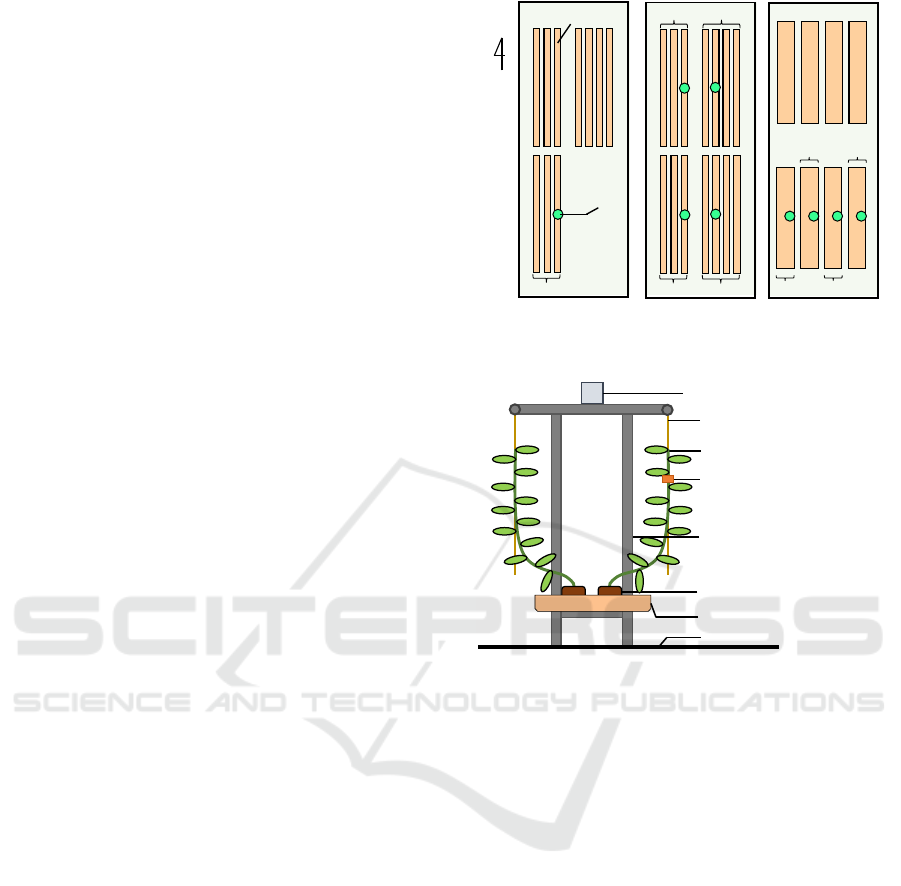
(a) Overview of greenhouse and
cultivation line.
(b) Layout of measurement sensors.
Figure 2: Dataset collection environment.
4.1 Data Collection and Preprocessing
A system was developed to collect agricultural data
in a greenhouse of tomato (Solanum lycopersicum L.
cultivar Frutica) at Fukuroi, Japan. We installed
environmental sensor nodes, laser displacement
sensors (HL-T1010A Panasonic Corporation), and a
datalogger (midi LOGGER GL840 Graphtech
Corporation) on the greenhouse. An overview of the
greenhouse and cultivation line and the layout of
measurement sensors are shown in Figure 2 (a) and
(b), respectively. Environment data such as
temperature, relative humidity, solar radiation, and
vapor pressure deficit (VPD) was collected along
with the data of the plant stem-diameter and
irrigation timing. Drip irrigation was used in which a
certain amount of water was released in one
irrigation. In addition, time series features related to
water stress and tomato irrigation were calculated to
create datasets. Stem-diameter represented the plant
growth and water stress. However, Kazumasa et al.
(2019) showed that the diameter could not be used
Block4
Block5
Block2
Block3
Block6
Block8
Block7
Block9
N
Block1
Greenhouse A Greenhouse B Greenhouse C
Target
plant
Cultivation line
Laser displacement sensor
Target plant
Rockwool cube
Steel frame
Environmental sensor node
Ground
Cultivation bed
Guide string
SMARTGREENS 2020 - 9th International Conference on Smart Cities and Green ICT Systems
180
as a water stress index directly because it changed
with the growth of the plant and diurnal variation.
Therefore, we have defined the difference in stem
diameter calculated using the most recent irrigation
(DSR) as a water stress index in accordance with the
work of Kazumasa et al. (2019). The DSR is a value
calculated by subtracting the current stem diameter
from the maximum stem diameter. The recent
irrigation in current time t is calculated as follows:
=
,
,…,
−
. (1)
Where t is the current time and n is the time
elapsed since the most recent irrigation. Additionally,
we have defined the time series features such as the
elapsed time since sunrise, elapsed time since the
previous irrigation, and accumulated environmental
data from the previous irrigation. This is because
Kazumasa et al. (Kazumasa et al., 2018) showed that
the machine learning method without recursion can
be improved by considering the time series features.
Table 1 shows the features of the dataset that were
finally calculated. All data were collected at a
frequency of once every minute and during the
periods A (from March 28 to October 22, 2018 in
greenhouse A), B (from October 23, 2018 to January
16, 2019 in greenhouse B), and C (from April 25 to
June 20, 2019 in greenhouse C). During periods A,
B, and C, the irrigation data was collected for one,
four and four blocks, respectively. Therefore, we
have collected irrigation data for nine blocks, or to
paraphrase, datasets were created for nine different
scenarios.
4.2 Experimental Condition
We have evaluated the performance of the proposed
method using actual agricultural data. In the
evaluation, the prediction accuracy of the irrigation
timing was compared by using environmental data
related to the irrigation of tomato as shown in Table
1. The recall and f-measure were used as error
indicators when the threshold for classification
judgment is 0.5 (50%). Recall shows the rate at
which the irrigation timing predicted by the model
matches the irrigation timing by the farmer. F-
measure shows the accuracy and completeness of the
irrigation timing predicted by the model. The
conditions are detailed in Table 2. There are
seventeen different conditions: no addressing of
imbalance, cost-sensitive learning, three
oversampling methods, two undersampling methods,
with and without ENIT before applying
undersampling method, and changing the
undersampling rate. The important parameters of the
RF method were tuned by using grid search:
Table 1: Features of dataset.
Type Feature
Environmental data
Temperature
Relative humidity
Solar radiation
Vapor pressure deficit
Plant water stress
Stem-diameter
DSR
Time-series feature
Elapsed time since sunrise
Elapsed time since last irrigation
Accumulated Environmental
data
Table 2: Evaluation condition.
Name Address imbalanced
Base No
Cost Inverse Class Frequency
OverRandom RandomSampling
SMOTE SMOTE
ADASYN ADASYN
UnderRandom02
*
RandomSampling
UnderRandom04
*
UnderRandom06
*
UnderRandom08
*
UnderRandom10
*
ENIT_UnderRandom10
*
ENIT &
RandomSampling
NearMiss02
*
NearMiss-1
NearMiss04
*
NearMiss06
*
NearMiss08
*
NearMiss10
*
ENIT_NearMiss10
*
ENIT & NearMiss-1
*: "02" means that the number of minority data is 2 when the
number of majority data 10 and "10" means balanced between
majority data and minority data.
Prediction Method of Plant Irrigation Timing Considering Data Imbalance
181
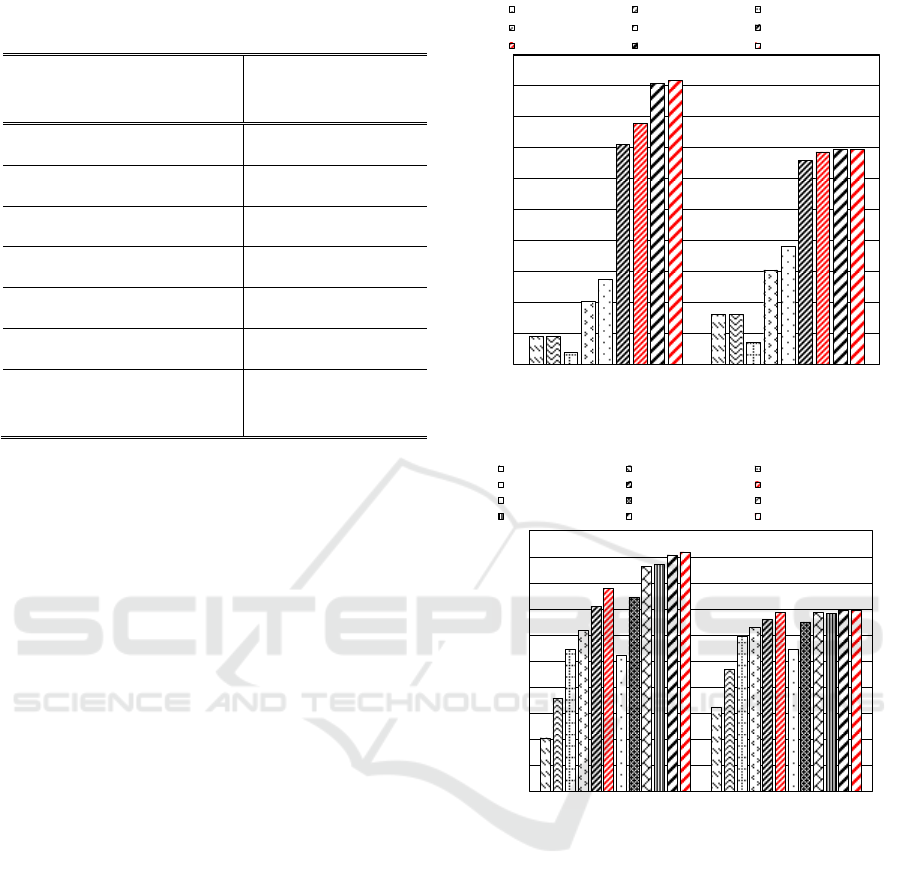
Table 3: The number of training and validation data
points.
Name
The number of data
points (Non-
irrigation/irrigation)
Base, Cost 231,250 / 11,047
OverRandom,SMOTE,ADASYN 231,250 / 231,250
UnderRandom02, NearMiss02 55,235 / 11,047
UnderRandom04, NearMiss04 27,617 / 11,047
UnderRandom06, NearMiss06 18,411 / 11,047
UnderRandom08, NearMiss08 13,808 / 11,047
UnderRandom10, NearMiss10,
ENIT_UnderRandom10,
ENIT_UnderRandom10
11,047 / 11,047
n_estimators (10, 20, 30) and max_depth (15, 20,
40). In addition, we set the ENIT hyperparameter n
and m to 2.
Evaluation data such as training, validation, and
test data were divided as per the following procedure.
First, the data set was divided into periods A to C.
Next, a day was calculated that included 80% of the
total number of irrigations in each period. The data
of the period after that date was set as the test data.
For training and validation data, the data excluding
the test data was divided into 5 parts, and 5-fold
cross validation was applied. In addition, from the
test and validation data, the majority data was
deleted to random to create equilibrium data to
obtain the correct accuracy. The number of test data
points were 4,896 (of which 2,448 were irrigation
data). The number of training and validation data
points before 5-fold cross validation were shown in
Table 3.
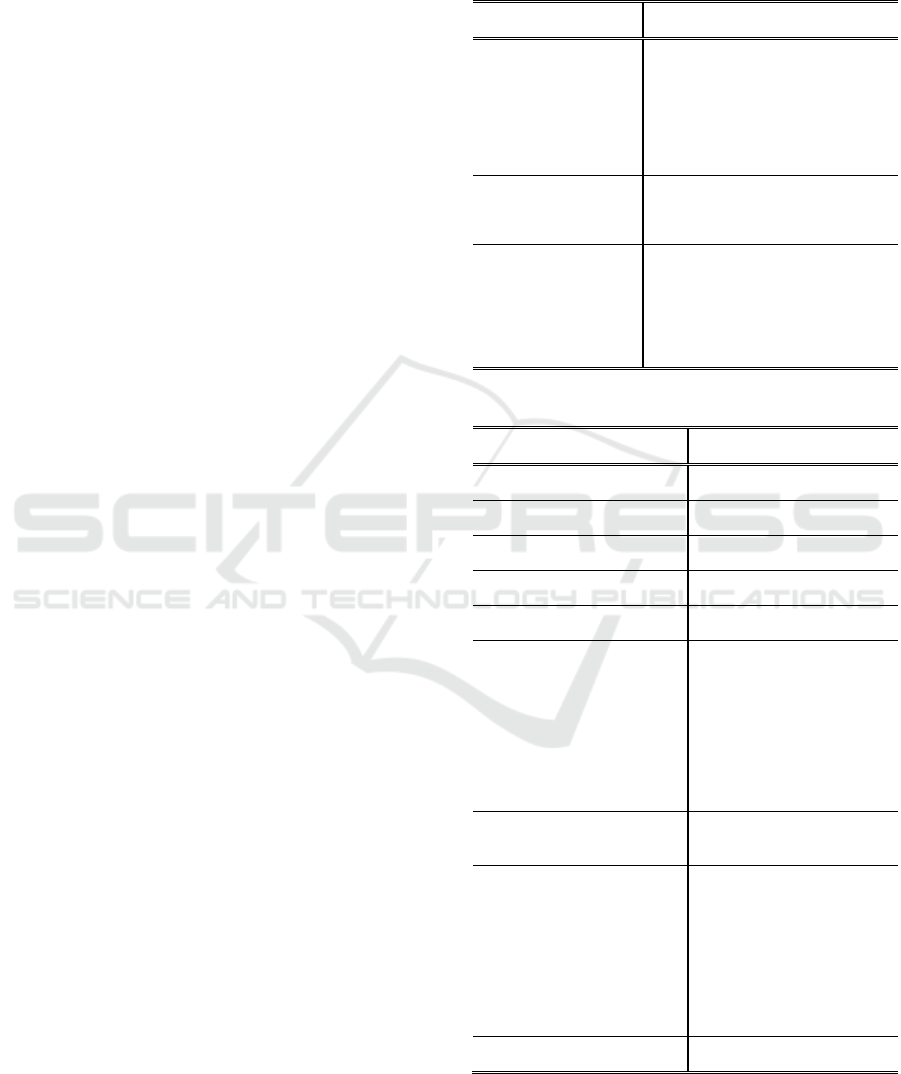
4.3 Results and Discussion
Figure 3 shows the errors of each comparison for the
testing data. The combination of the proposed
method and NearMiss has the highest score for both
recall and f-measure: 0.92 recall and 0.69 f-measure.
Only NearMiss has a score of 0.91 recall and 0.69 f-
measure. In addition, the combination of the
proposed method and random undersampling scores
better than only random undersampling. This is
because, the combination of the proposed method
and random sampling and only random sampling
have a score of 0.78 recall and 0.69 f-measure and
0.71 recall and 0.66 f-measure, respectively. These
Figure 3: The results of each approach for imbalanced
data.
Figure 4: The results of undersampling with changing rate.
results show that the proposed method works
effectively. In addition, the results show that
undersampling is superior to cost-sensitive learning
and oversampling. Random oversampling is
considered to be inaccurate because irrigation data
that provide useful features are not selected. In
SMOTE and ADASYN, the data is generated on a
line connecting minority data. Therefore, minority
data may be generated in the majority area. However,
undersampling by NearMiss, which has the highest
accuracy, does not generate data near the majority
data. NearMiss has the characteristic that the
majority data near the decision boundary is
unchanged when ideal processing is performed.
Therefore, the model using NearMiss learns detailed
decision boundaries and the accuracy is improved.
0.00
0.10
0.20
0.30
0.40
0.50
0.60
0.70
0.80
0.90
1.00
Recall F-measure
Recall / F-meaure
Base Cost OverRandom
SMOTE ADASYN UnderRandom10
ENIT_UnderRandom10 NearMiss10 ENIT_NearMiss10
0.00
0.10
0.20
0.30
0.40
0.50
0.60
0.70
0.80
0.90
1.00
Recall F-measure
Recall / F-meaure
UnderRandom02 UnderRandom04 UnderRandom06
UnderRandom08 UnderRandom10 ENIT_UnderRandom10
NearMiss02 NearMiss04 NearMiss06
NearMiss08 NearMiss10 ENIT_NearMiss10
SMARTGREENS 2020 - 9th International Conference on Smart Cities and Green ICT Systems
182

Figure 4 shows the result of changing the
sampling rate of undersampling. Both random
sampling and NearMiss increase in accuracy as the
sampling rate increases. To paraphrase, the accuracy
is higher for the cases having data closer to the
balanced data. In particular,
ENIT_UnderNearMiss10 has a recall of 0.92 and
can predict irrigation timing with high accuracy.
5 CONCLUSIONS
We proposed a novel method for resolving
imbalances suitable for irrigation timing and its
prediction. We addressed the imbalance of irrigation
timing data by using undersampling for eliminating
data based on near irrigation timing (ENIT), to
eliminate the non-irrigation data near the time of
irrigation. The performance of the proposed method
was evaluated using actual agricultural data. In the
evaluation, the prediction accuracy of irrigation
timing was compared by using environmental data
related to the irrigation of tomato. In the results, The
accuracy was improved by the two methods that
applied the proposed method. We showed that the
prediction accuracy of small frequent irrigation can
be improved by applying the method for eliminating
imbalances that takes into account the characteristics
of irrigation timing data. This result shows that it is
necessary to eliminate the imbalance in the
prediction of irrigation timing. Furthermore, the
result shows that it is effective to consider irrigation
characteristics to eliminate imbalance. The aim in
future is to automatically cultivate various crops by
controlling through IoT devices, which are able to
control the irrigation timing in greenhouses based on
the proposed method. IoT technology has already
been introduced in the agricultural domain.
In future, we will evaluate the general purpose of
the proposed method under various conditions with
different greenhouses, cultivation methods, and
water supply. In addition, the prediction model will
be examined. Specifically, the application of Long-
Short Term Memory (LSTM) (Sepp & Jurgen, 1997),
which is one of the most powerful deep learning
methods, will be considered. LSTM can be
considered for irrigation timing because it can
consider long-term time series. In addition, we will
consider Dynamic Time Warping (DTW) (Bemdt &
Clifford, 1994) to error indicator. Recall and F-
measure are evaluated for one point in time without
considering time series. Thus, a model that is off by
only one point in time and a model that cannot be
predicted at all are both incorrect. Therefore, we
evaluate the similarity between two time-series
sequences using DTW.
ACKNOWLEDGEMENTS
We greatly appreciate Mr. Makoto Miyachi (Happy
Quality Co., Ltd., Japan) and Mr. Daigo Tamai (Sun
Farm Nakayama Co., Inc., Japan) for providing an
environment for data collection.
REFERENCES
Bemdt, D. J., & Clifford, J. (1994). Using Dynamic Time
Warping toFindPatterns in Time Series. AAAI, 359–
370.
Capraro, F., Tosetti, S., Rossomando, F., Mut, V., &
Serman, F. V. (2018). Web-based system for the
remote monitoring and management of precision
irrigation: A case study in an arid region of Argentina.
Sensors (Switzerland), 18(11). https://doi.org/
10.3390/s18113847
Chawla, N. V, Bowyer, K. W., Hall, L. O., & Kegelmeyer,
W. P. (2002). SMOTE: Synthetic Minority Over-
sampling Technique. In Journal of Artificial
Intelligence Research (Vol. 16).
Chen, H., Chen, Change, H., & Xiaoou, T. (2016).
Learning Deep Representation for Imbalanced
Classification. CVPR.
Haibo, H., Yang, B., Edwardo, A, G., & Shutao, L.
(2008). ADASYN: Adaptive Synthetic Sampling
Approach for Imbalanced Learning. 1322–1328.
https://doi.org/10.1109/IJCNN.2008.4633969
Jianping, Z., & Inderjeet, M. (2003). kNN Approach to
Unbalanced Data Distributions: A Case Study
involving Information Extraction. Int’l. Conf.
Machine Learning1(ICML).
Joaquín,Gutiérrez, J., Jua, Francisco, V.-M., Aracely, L.-
G., & Miguel, Porta-Gándara, Á. (2015).
Smartphone Irrigation Sensor. Sensors, 15(9),
5122–5127.
https://doi.org/10.1109/JSEN.2015.2435516
Kazumasa, W., Ryosuke, M., Gota, N., & Hiroshi, M.
(2019). Multimodal neural network with clustering-
based drop for estimating plant water stress.
Computers and Electronics in Agriculture, 105118.
https://doi.org/10.1016/J.COMPAG.2019.105118
Kazumasa, W., Shun, S., Hiroshi, M., Takeshi, S., Daichi,
S., Yoshikazu, K., & Katsumi, S. (2018). Time
series Feature Injection Method for Estimating
Plant Evapotranspiration using Neural Networks.
Pattern Recognition and Media Understanding
(PRMU).
Liu, X., Xu, C., Zhong, X., Li, Y., Yuan, X., & Cao, J.
(2017). Comparison of 16 models for reference crop
evapotranspiration against weighing lysimeter
measurement. Agricultural Water Management,
Prediction Method of Plant Irrigation Timing Considering Data Imbalance
183

184, 145–155. https://doi.org/10.1016/J.AGWAT.
2017.01.017
Navarro-Hellín, H., Martínez-del-Rincon, J., Domingo-
Miguel, R., Soto-Valles, F., & Torres-Sánchez, R.
(2016). A decision support system for managing
irrigation in agriculture. Computers and Electronics
in Agriculture, 124, 121–131. https://doi.org/
10.1016/j.compag.2016.04.003
Pawlowski, A., Sánchez-Molina, J. A., Guzmán, J. L.,
Rodríguez, F., & Dormido, S. (2017). Evaluation of
event-based irrigation system control scheme for
tomato crops in greenhouses. Agricultural Water
Management, 183, 16–25. https://doi.org/10.1016/
J.AGWAT.2016.08.008
Peng, Y., Xiao, Y., Fu, Z., Dong, Y., Zheng, Y., Yan, H.,
& Li, X. (2019). Precision irrigation perspectives on
the sustainable water-saving of field crop
production in China: Water demand prediction and
irrigation scheme optimization. Journal of Cleaner
Production, 230, 365–377. https://doi.org/10.1016/
J.JCLEPRO.2019.04.347
Sepp, H., & Jurgen, S. (1997). Long Short-Term Momory.
Neural Computation, 9(8), 1735–1780.
Takayoshi, Y., Takafumi, K., Makoto, S., & Hiroki, K.
(2018). Effects of ingredient and application
method of controlled-release fertilizers on blossom-
end rot and fruit yield of tomato in the high-density
cultivation with low node-order pinching using
solar radiation powered pulsating drip irrigation
system. Bulletin of the NARO, Agricultural
Research for Western Region, 53–64.
https://doi.org/10.24514/00000237
Vasconez, J. P., Kantor, G. A., & Auat Cheein, F. A.
(2019). Human–robot interaction in agriculture: A
survey and current challenges. Biosystems
Engineering, 179, 35–48. https://doi.org/10.1016/
J.BIOSYSTEMSENG.2018.12.005
Yen, S.-J., & Lee, Y.-S. (2009). Cluster-based under-
sampling approaches for imbalanced data
distributions. Expert Systems with Applications,
36(3), 5718–5727. https://doi.org/10.1016/
J.ESWA.2008.06.108
Yu-Xiong, W., Deva, R., & Martial, H. (2017). Learning
to Model the Tail. NIPS, 7032–7042.
https://doi.org/10.3390/atmos7060083
Yukimasa, K., Shun, S., & Hiroshi, M. (2017). Multi-
modal sliding window-based support vector
regression for predicting plant water stress.
Knowledge-Based Systems, 134, 135–148.
https://doi.org/10.1016/j.knosys.2017.07.028
SMARTGREENS 2020 - 9th International Conference on Smart Cities and Green ICT Systems
184
