
A Cloud-based Analytics Architecture for the Application of Online
Machine Learning Algorithms on Data Streams in Consumer-centric
Internet of Things Domains
Theo Zsch
¨
ornig
1
, Jonah Windolph
1
, Robert Wehlitz
1
and Bogdan Franczyk
2,3
1
Institute for Applied Informatics (InfAI), Goerdelerring 9, 04109 Leipzig, Germany
2
Information Systems Institute, Leipzig University, Grimmaische Str. 12, 04109 Leipzig, Germany
3
Business Informatics Institute, Wrocław University of Economics, ul. Komandorska 118-120, 53-345 Wrocław, Poland
Keywords:
Internet of Things, Stream Processing, Online Machine Learning, Kappa Architecture.
Abstract:
The increasing number of smart devices in private households has lead to a large quantity of smart homes
worldwide. In order to gain meaningful insights into their generated data and offer extended information
and added value for consumers, data analytics architectures are essential. In addition, the development and
improvement of machine learning techniques and algorithms in the past years has lead to the availability of
powerful analytics tools, which have the potential to allow even more sophisticated insights at the cost of
changed challenges and requierements for analytics architectures. However, architectural solutions, which
offer the ability to deploy flexible, machine learning-based analytics pipelines on streaming data, are missing
in research as well as in industry. In this paper, we present the motivation and a concept for machine learning-
based data processing on streaming data for consumer-centric Internet of Things domains, such as smart home.
This approach was evaluated in terms of its performance and may serve as a basis for further development and
discussion.
1 INTRODUCTION
The Internet of Things (IoT) consists of a multitude
of different sensors, tags and actuators. These smart
devices can be found in industrial, commercial and
consumer-centric domains. Their main purpose is to
provide insights into their usage and their surround-
ings as well as to allow remote and automatic control
of formerly analogous devices. With regard to data
processing, the IoT as a whole, but also its subdo-
mains, can be characterized by its huge data volumes,
high velocity of data generation and a huge variety
of heterogeneous data, thus highlighting its connec-
tions to big data. In this regard, market analysts have
found that the number of IoT-connected devices was
22 billion in 2018 and is estimated to be 38.6 bil-
lion in 2025 (Strategy Analytics, 2019). In the past
years, research and industry have developed several
conceptual approaches and technical solutions to ad-
dress the challenges, which arise from the process-
ing of IoT data. These solutions revolve around the
usage of data mining techniques and big data, which
have already proven their worth in comparable areas
of application, e.g. social media. Simultaneously, the
adaptation and application of machine learning (ML)
in academia and business contexts has increased sig-
nificantly. The usage of ML in IoT scenarios seems
promising to further increase the insights and hence
the usefulness of IoT devices. In contrast, the avail-
ability of data processing and analytics architectures
to enable ML in consumer-centric IoT domains, such
as smart home, is limited. Furthermore, existing so-
lutions do not address all the key challenges and re-
quirements, which are unique to scenarios from this
domain. Therefore, in this paper, we present an ar-
chitectural approach, which allows the application of
ML in big data scenarios located in the smart home
domain. Additionally, we evaluate the proposed ar-
chitecture in terms of its performance.
The remainder of this paper is structured as fol-
lows: In section 2, we provide the motivation for
conducting our research and the underlying scenario
as well as important challenges and requirements for
ML-enabled architectures in the smart home domain.
Insights into related research initiatives and solutions
are presented in section 3. In section 4, we describe
the architectural approach as well as its components
and how they address the challenges and require-
Zschörnig, T., Windolph, J., Wehlitz, R. and Franczyk, B.
A Cloud-based Analytics Architecture for the Application of Online Machine Learning Algorithms on Data Streams in Consumer-centric Internet of Things Domains.
DOI: 10.5220/0009339501890196
In Proceedings of the 5th International Conference on Internet of Things, Big Data and Security (IoTBDS 2020), pages 189-196
ISBN: 978-989-758-426-8
Copyright
c
2020 by SCITEPRESS – Science and Technology Publications, Lda. All rights reserved
189

ments. Continuing, we present the results of the per-
formance test, we conducted in order to evaluate our
approach (sect. 5). An overview of our findings and
future research directions are given in the final section
of this paper (sect. 6).
2 BACKGROUND
IoT data may be characterized as time series data,
which are heterogeneous regarding their structure as
well as semantics and whose value for the generation
of information decreases over time. Therefore, in or-
der to gain valuable insights, these data has to be anal-
ysed in real-time.
The application of IoT devices as well as the ana-
lytics scenarios, which use the data of these devices,
and consequently the requirements and challenges for
architectures, which are used for data processing, vary
between different domains of industry and business.
For example, industry 4.0 use cases revolve around
a large number of, mostly, similar sensors and ac-
tuators, which are used in specific ways to monitor
and control predefined environments such as assem-
bly halls (Zhong et al., 2017). Therefore, the result-
ing analytics scenarios are well-known in advance and
can be prepared accordingly, using a top down view
of available resources and the problem space. More-
over, these kinds of analytics scenarios are similar to
commonly encountered big data problems in domains
outside the IoT such as social media analytics (e.g.
Fan and Gordon, 2014).
In contrast, architectural solutions for consumer-
centric IoT domains, such as smart home, need to
handle a multitude of different analytics scenarios per
consumer, which may include only a small number
of smart devices, but are still different in terms of
their configuration, requested insights, device types
used, etc. While the resulting analytics problems are
not big data problems per se, the processing resources
in smart home scenarios are usually cloud-based and
managed by a 3rd party provider, resulting in a huge
amount of small problems to be processed. Addition-
ally, the analytics scenarios are defined bottom up by
consumers, may rapidly change and have to allow for
flexible configuration of analytics pipelines. These
framework conditions require analytics architectures,
which offer the needed flexibility while still provid-
ing big data processing capabilities and are therefore
different from the ones in “regular” use cases.
Based on this, we define the background scenario
of this paper, which is the prediction of individual
home energy consumption over a period of time. We
assume that smart meter data from households are
available, which reflect their energy consumption and
naturally differ between different types of devices in
terms of structure and semantics. Consumers send
these data to their smart home platform provider,
which predicts their energy consumption as per the
requested prediction time frame, e.g. the end of the
month or year. The platform provider may use addi-
tional data sources per consumer, such as IoT envi-
ronmental sensors, but also open data, e.g. weather or
census data, in order to improve the respective predic-
tion model. As a result of the varying availability of
data sources per consumer, but also because of indi-
vidual energy consumption behaviours, the prediction
models are inherently different from each other.
In this context, the application of ML algorithms
for energy consumption prediction is advantageous
because of their high forecasting accuracy (Amasyali
and El-Gohary, 2018). In contrast, the usage of ML
algorithms on IoT data streams results in additional
architectural challenges and requirements. These, as
well as generic architectural components to address
them, have already been identified by previous re-
search. For example, Augenstein et al. (2019) de-
scribe a multi-purpose architecture for anomaly de-
tection on data streams. While the authors focus on
deep learning methods, they explicitly point out, that
their framework is applicable to other ML approaches
as well. Therefore, in this paper, we utilize an ex-
isting approach of ours, which was first described
in Zsch
¨
ornig et al. (2017), in order to reflect archi-
tectural requirements mentioned in previous research
and to allow for the application of ML algorithms on
streaming data in smart home scenarios.
3 RELATED WORK
With the growing importance of the IoT in general,
several scientific approaches concerning analytics ar-
chitectures for smart home use cases have been pub-
lished. The presented architectures are mostly used to
enable and support activity recognition (e.g. Fortino
et al., 2015), energy consumption monitoring (e.g.
Khan et al., 2017) as well as energy load forecast-
ing (e.g. Pham, 2016). Early solution proposals for
data processing are based on cloud deployments us-
ing big data technologies, such as Apache Spark
1
,
Storm
2
or Flink
3
, (e.g. Hasan et al., 2015), but are pre-
dominantly based on the lambda architecture concept,
which requires two parallel data processing pipelines,
1
https://spark.apache.org/
2
https://storm.apache.org/
3
https://flink.apache.org/
IoTBDS 2020 - 5th International Conference on Internet of Things, Big Data and Security
190
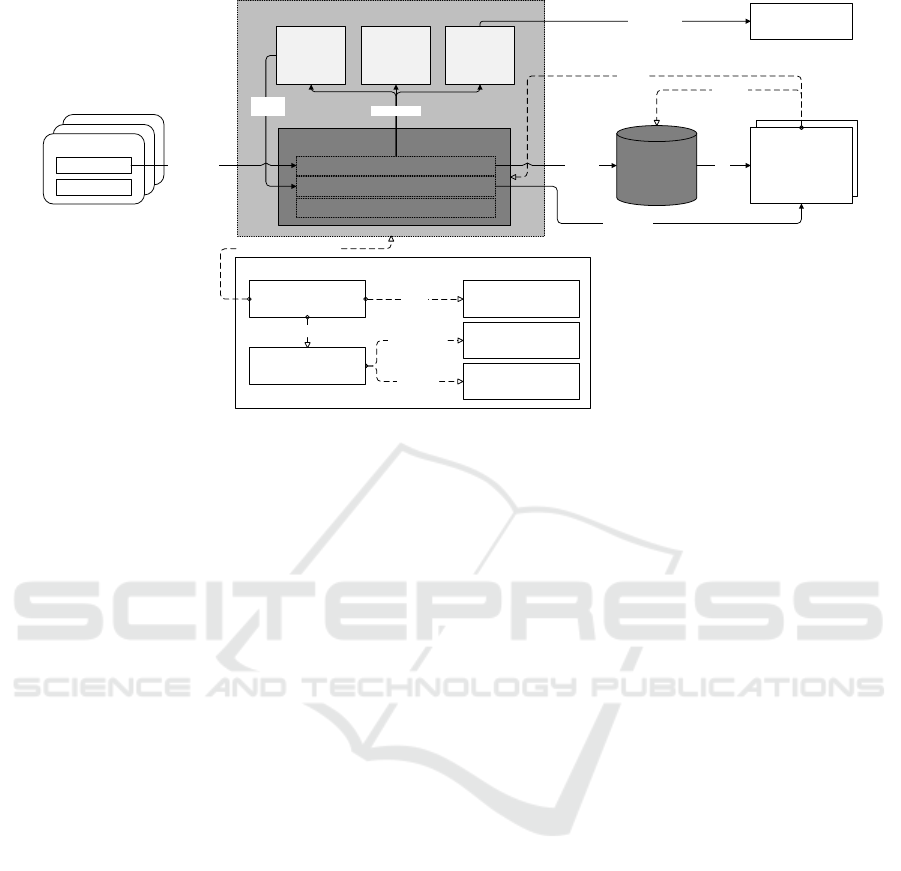
Application
IoT device
Streaming platform (Data Collection & Distribution)
Log Data Store (Mass Storage)
Operator m
(Data
Aggregation)
Operator n
(Data
Transfor-
mation)
streaming
data
IoT Service
IoT Service
IoT (streaming)
data
Operator o
(Training &
Inference
Engine)
data stream
Serving
database
(Mass Storage)
Application
(Interactive Data
Analysis)
data
query data
processed
data
streaming data
streaming data
subscribe
data stream
data stream
Monitoring &
Evaluation
Monitoring data
Orchestration platform (Workflow Management)
Pipeline RegistryFlow Engine
Operator
Repository
Flow
Repository
register
pipeline
Request parsed flow data
request flow
metadata
request operator
metadata
Flow Parser
manage operator deployment
Figure 1: Overview of the proposed architectural solution.
thus decreasing their adaptability in fast changing an-
alytics scenarios as well as in terms of their flexibil-
ity concerning analytics pipeline design. More recent
research focuses on hybrid approaches, which utilize
fog (e.g. Yassine et al., 2019) or edge (e.g. Lin, 2019)
computing concepts for data processing. These ap-
proaches offer decreased network usage and latency
while providing increased energy-efficiency but are
limited in terms of their scalability.
Looking at the utilization and application of ML
technologies and algorithms, we found only a small
number of feasible architectural solutions. For ex-
ample, Popa et al. (2019) propose a hybrid architec-
ture, which implements deep neural networks to en-
able non-intrusive load monitoring and energy load
forecasting for smart homes. While the application of
trained ML models is implemented at the fog level at
the IoT agent, the training is done using on-demand
cloud services and, in contrast to our proposed solu-
tion, utilizes batch processing whenever reconfigura-
tions or adjustments of the model are needed. In ad-
dition, no information regarding the scalability of the
solution is given with the authors evaluating their ap-
proach by forecasting the energy consumption using
only data from one household.
In summary, previous research in the field of smart
home analytics offers architectural solutions, which
either allow for large scale data processing in pre-
defined analytics scenarios or low-latency data pro-
cessing with limited scalability options. Additionally,
the application of ML technologies, especially on
streaming data, has not been sufficiently researched.
Based on the background scenario described in sec-
tion 2, none of the investigated research seems appro-
priate to address all of the linked requirements and
challenges.
4 SOLUTION PROPOSAL
In order to address the issues raised in section 2,
we present the architectural concept as seen in fig-
ure 1. This approach has already been introduced by
Zsch
¨
ornig et al. (2017) and is based on the kappa
architecture concept in conjunction with the use of
container-based microservices. The architecture is
designed to process streaming data in IoT use cases
from the areas of smart home and smart energy. With
regard to the needed components for ML use cases as
described in Augenstein et al. (2019), we found that
the usage of this architectural approach in connection
with ML problems in smart home environments, op-
erating under the aforementioned framework condi-
tions (large numbers of small problems), is not yet
sufficient, but promising. Therefore, we repurposed
its components, if needed, in order to enable the ap-
plication of ML on IoT data streams from smart home
devices in the scenario introduced in section 2.
The central component of the resulting architec-
ture is the streaming platform, which handles data
collection as well as distribution and is composed
of different sub components. Data streams are in-
gested using IoT middleware solutions as described
by Wehlitz et al. (2019) and pushed to and saved in a
log data store. The messages in these data streams as
well as the ones, which have already been processed
A Cloud-based Analytics Architecture for the Application of Online Machine Learning Algorithms on Data Streams in Consumer-centric
Internet of Things Domains
191

in the streaming platform, are saved in sequential or-
der using topics and partitions to organize the data
and to enable parallel access. If needed, data may be
pushed to a serving database, thus allowing ad-hoc
queries on the data. Together, both components are
used for mass storage of data.
Data processing in the streaming platform is per-
formed by analytics operators, which are small,
single-purpose microservices, encapsulated using
container technology, namely Docker
4
. A single ana-
lytics operator is developed by data analytics experts
and exposes inputs, outputs and configuration values.
Furthermore, analytics operators may be composed
into analytics pipelines, linking their inputs and out-
puts, therefore allowing for complex data transfor-
mation as well as aggregation and application of ad-
vanced statistical and ML-based methods.
The capabilities to develop, manage and deploy
analytics pipelines based on predefined analytics op-
erators are implemented and exposed as services in
the orchestration platform of the overall architecture.
This platform acts as a workflow management system
as described by Augenstein et al. (2019).
The flow engine is the main subcomponent of the
orchestration platform. It offers different adapters
to interface with container-orchestration and manage-
ment systems, such as Kubernetes
5
or Rancher
6
, and
deploys analytics operators based on analytics flows.
These are flow-based graphs, which describe the data
flow between the inputs and outputs of analytics oper-
ators. All analytics flows are saved in the flow reposi-
tory, whereas analytics operators metadata are saved
in the operator repository. When a user requests the
instantiation of an analytics flow, they send a request
to the flow engine, which calls the flow parser ser-
vice, in order to get the corresponding deployment
data, including analytics operators to be deployed as
well as their configuration in terms of input data map-
ping. The deployment data is composed by the flow
parser using analytics flow data from the flow reposi-
tory and analytics operator metadata from the opera-
tor repository. Once the flow engine has received the
deployment data it starts the needed analytics opera-
tor containers and registers a new analytics pipeline
in the pipeline registry. A single analytics operator
always subscribes to at least one topic with IoT data,
which is saved in the log data store of the streaming
platform and merges data streams if needed. After
it has processed a message of a data stream, an an-
alytics operator writes the resulting message back to
the log data store into a separate topic. Consequently,
4
https://www.docker.com/
5
https://kubernetes.io/
6
https://rancher.com/
it is possible for external applications to subscribe to
these topics and receive streams of processed data at
all stages of an analytics pipeline.
The proposed architecture was prototypically im-
plemented during our research. The components of
the streaming platform are based on open source soft-
ware. Specifically, it is built using Apache Kafka
7
and
its software ecosystem. Analytics operators are writ-
ten in Java. To ensure their seamless integration with
the orchestration components of the overall architec-
ture, we developed a Java library based on Kafka
Streams
8
. We use InfluxDB
9
as a serving database,
since IoT data are usually time series. The compo-
nents of the orchestration platform are developed us-
ing Go and Python and expose their functionalities via
REST-based CRUD endpoints. The metadata of these
services is saved on document-oriented database sys-
tems, e.g. MongoDB
10
. To enable users to quickly
compose analytics flows, we implemented a frontend
application using Angular
11
. Relying on a flow-based
notation, this graphical tool can be used to design an-
alytics flows and wire analytics operators without the
need to write programming code.
Implementing ML algorithms in a large number
of smart home analytics pipelines poses a problem in
terms of the availability of processing resources, even
in cloud-based computing environments. The training
phase of ML algorithms requires increasing resources
with larger datasets. An architecture, which is used
to train the models of large numbers of analytics sce-
narios has to retrain a model at the arrival of a new
data point in the corresponding analytics pipeline or
at regular intervals. In this regard, most architectural
solutions use batch processing, in which the training
process is executed at regular intervals and the result-
ing models are stored at a model server. While this
may reduce the processing load of the overall archi-
tecture, even periodical batch processes, which train
large numbers of ML models, require proportionate
computing resources and come at the cost of lesser
accuracy of the resulting models, depending on the
time since their last training phase.
In this regard, we conducted preliminary studies
involving use cases, which demand the training of
large numbers of offline ML models at once and found
that even if the training time of a single model takes
about one second, processing time increases dramati-
cally and is not economically feasible for large num-
bers of models to be trained. In addition, task par-
7
https://kafka.apache.org/
8
https://kafka.apache.org/documentation/streams/
9
https://www.influxdata.com/
10
https://www.mongodb.com/
11
https://angular.io/
IoTBDS 2020 - 5th International Conference on Internet of Things, Big Data and Security
192

allelism is only achieved by scaling the processing
threads. For this reason, online ML algorithms, which
incrementally evolve the ML model seem more ap-
propriate. Their main advantage is, that the process-
ing time does not increase with growing data sets.
Combining this type of algorithm with the kappa ar-
chitecture approach of the proposed solution allows
for highly scalable data processing while still keeping
its flexibility in terms of data reprocessing and chang-
ing analytics pipelines at consumer level.
In order to use online ML in the proposed archi-
tecture, we have implemented a new analytics oper-
ator, which provides online ML capabilities. With
regard to Augenstein et al. (2019), this analytics op-
erator is a combination of the training and inference
engine. Additionally, the current model state is saved
in the analytics operator, negating the need for an ex-
ternal model storage. Since the resulting analytics
operators are deployed using container technology,
their resource usage overhead is small. Monitoring &
Evaluation of the utilized ML algorithm is achieved
by writing the corresponding data into the processed
messages. Therefore, no external services are needed.
5 EXPERIMENTAL EVALUATION
In order to evaluate the feasibility of the presented
architectural approach in terms of its performance,
we conducted an experiment, using real-world data,
which we explain in the following section. The pur-
pose of it is to show that the solution proposal is able
to handle a large number of ML-based smart home
analytics scenarios, which individually only expose a
small amount of data. In this regard, we compare our
solution proposal against the de-facto industry stan-
dard in terms of big data processing, Apache Spark.
5.1 Experiment
The experiment we conducted revolves around in-
dividual energy consumption forecasting for a large
number of households using ML algorithms. The
dataset we used for the experiment was collected
during a past research project of ours. The dataset
contained energy consumption data from 945 smart
meters over a time frame of about 6 months and
comprised about 9 million data points. The resolu-
tion of each smart meter time series was 15 minutes
and the data schema included a device id, timestamp
and the current energy consumption value. The data
was stored in a Kafka topic, which was divided into
32 partitions with each individual time series being
stored on a single partition.
The processing algorithm was implemented using
the MOA Java library
12
at version 19.05.0
13
. The
forecasting was done using the online ML algorithm
adaptive random forest regressor, which is based on
the work of Gomes et al. (2017). The implementa-
tions of both architectural approaches used the same
software library and algorithm in their analytics oper-
ators/executors to allow the comparison of the exper-
iments results.
During the processing of the data, the analytics
operators/executors created and trained an individual
forecasting model for each smart meter. The models
were saved locally at the analytics operator/executor
and the forecasted value at a given time was written
into each incoming message. In this regard, the pre-
diction was to be made for the last day of the year of
a smart meter time series.
5.2 System Setup and Deployment
We deployed both, the proposed solution and the
spark instances, at a private cloud datacenter. Con-
tainer orchestration and management was done using
Rancher version 2.2.4 and Kubernetes version 1.13.5.
The cluster comprised 18 virtual machines running
on hypervisors using the kernel-based virtual machine
(KVM) module of Suse Linux Enterprise Server 12
SP4. The hypervisors were equipped with an Intel
XEON E5 CPU core, 512 GB RAM and SSD as well
as Infiniband storage solutions. The virtual machines
ran CentOS 7 and Docker engine version 19.3.4. Each
virtual machine had 8 CPU kernels, 64 GB RAM and
256 GB of solid state disk storage. Both architec-
tures, which were deployed in the experiment, used
an Apache Kafka cluster, version 2.0.1, as their log
data store. The Apache Spark cluster was deployed
using a helm chart and its version was pinned at 2.4.4.
It was using the Kubernetes scheduler for
5.3 Metrics & Methodology
We measured message throughput, average and peak
CPU load average
14
as well as average and peak
memory usage. We define message throughput as the
number of processed messages in a constant amount
12
see Bifet et al. (2010)
13
https://github.com/Waikato/moa/releases/tag/2019.05.0
14
CPU load average refers to the number of processes
which are being executed or waiting to be processed. The
current number of processes is a weak indicator of the load
of a system. Therefore, three mean values (1 minute, 5 min-
utes and 15 minutes) are usually formed over the number of
processes. Typically, this measurement is presented without
a unit.
A Cloud-based Analytics Architecture for the Application of Online Machine Learning Algorithms on Data Streams in Consumer-centric
Internet of Things Domains
193

of time. Specifically, the total number of messages
of the test data set was divided by the execution time
of each experimental run. The CPU load average was
recorded per analytics operator/executor over the run-
time of the experiment using 30 second intervals. The
presented metric is the sum of the CPU load aver-
age of all analytics operators/executors. The mem-
ory usage was also averaged for each analytics oper-
ator/executor over the runtime of the experiment and
added up to provide the presented metric.
The test data set was partitioned into 32 subsets,
which were loaded onto the same amount of partitions
of a Kafka topic. This led to an uneven distribution
of data points with some subsets being considerably
larger than others, thus having their respective analyt-
ics operators/executors run out of data to be processed
faster than others. Additionally, Apache Spark’s start-
up phase, which includes executor deployment and
partition shuffling etc., takes a lot longer than the
one of the proposed solution. Therefore, we ad-
justed the message throughput to only include data
points and execution time when both architectures
were ready to process data and all analytics oper-
ators/executors were still processing data. This as-
sumption was made, since real-world scenarios work
under a constant influx of data, where start-up times
are negligible and data processing usually does not
stop.
We used 32 analytics operators for our proposed
solution and 31 executors and 1 driver for the Spark
cluster. Each analytics operator/ Spark executor was
given one processing thread, which translates to a
maximum usage of one CPU. In both setups, two
processing instances were running in one virtual ma-
chine, requiring 16 overall. In case of our solution
proposal, all runtime metrics were recorded using the
JMX port of their Java Virtual Machine. In contrast,
runtime metrics of the Spark cluster were captured us-
ing its history server. CPU and RAM statistics were
gathered using the cluster monitoring tools Rancher
offers.
Additionally, we found it important to evaluate the
quality of the forecasting models and get an initial un-
derstanding of their usability. We decided to measure
the forecasting quality by labelling all data with the
actual energy consumption of their respective smart
meter at the end of the year and compare it with the
forecasted value. Therefore, we calculated the mean
absolute percentage of error (MAPE) as described by
Gonzalez-Vidal et al. (2017) for every data point of
every smart meter time series. These values were then
grouped by the order of their appearance and the av-
erage of the MAPE of all smart meter time series was
calculated.
5.4 Experimental Results
In view of the relevance and plausibility of our results,
the experiment was repeated 5 times for both architec-
tural approaches. Additionally, the optimal configura-
tion of both architectures was determined in pretests
yielding a Spark cluster batch size of 1 million data
points and 32 shuffle partitions, and also the data par-
tition number of 32.
The results of the experiment regarding message
throughput and adjusted message throughput are pre-
sented in figure 2. In terms of throughput the spark
cluster averaged 28,694 messages per second with
a standard deviation ( ˜s) of 1,032, whereas the pro-
posal averaged 31,125 ( ˜s=994) messages per sec-
ond. The results regarding the adjusted throughput
are even further apart. We calculated an average ad-
justed throughput of 31,273 (˜s=1,241) messages per
second for the spark cluster and an average of 52,434
( ˜s=1930) messages per second for our proposal.
Looking at the memory utilization, we calculated
an average usage of 100.1 ( ˜s=2.5) GiB of the spark
cluster across all runs of the experiment. The proposal
averaged a usage of 128.7 ( ˜s=9.8) GiB of memory.
The average peak memory usage was 141 ( ˜s=1.6) GiB
for the spark cluster and 154.7 ( ˜s=0.4) GiB for the
proposal.
The average CPU load of the spark cluster during
the experiments was at 7.3 ( ˜s=1.3) and at 13.5 (˜s=2.3)
for the proposal. The peak CPU load was at an av-
erage of 13.2 ( ˜s=0.2) for the spark cluster and 21.3
( ˜s=0.2) for the proposal.
As mentioned before, we also recorded the preci-
sion of the forecasted values by comparing them with
the actual value of the energy consumption at a fixed
date. In this regard, we used the data from the ex-
periments of the solution proposal. The MAPE (see
section 5.3) of the forecast decreases with an increas-
ing amount of processed data points. The error of the
forecast reaches 50% at around 2,000 messages and
contentiously stays below 50% from 3,000 messages
onward. A MAPE of 10% is reached after 11,500
messages and stays below this marker beginning at
14,250 messages.
5.5 Discussion
Looking at the results of the conducted experiment,
we conclude that our proposed architectural solution
is able to handle and process significantly more mes-
sages per second than Apache Spark under compa-
rable framework conditions. While this difference is
not as obvious regarding the throughput metric, the
adjusted throughput metric highlights the difference
IoTBDS 2020 - 5th International Conference on Internet of Things, Big Data and Security
194
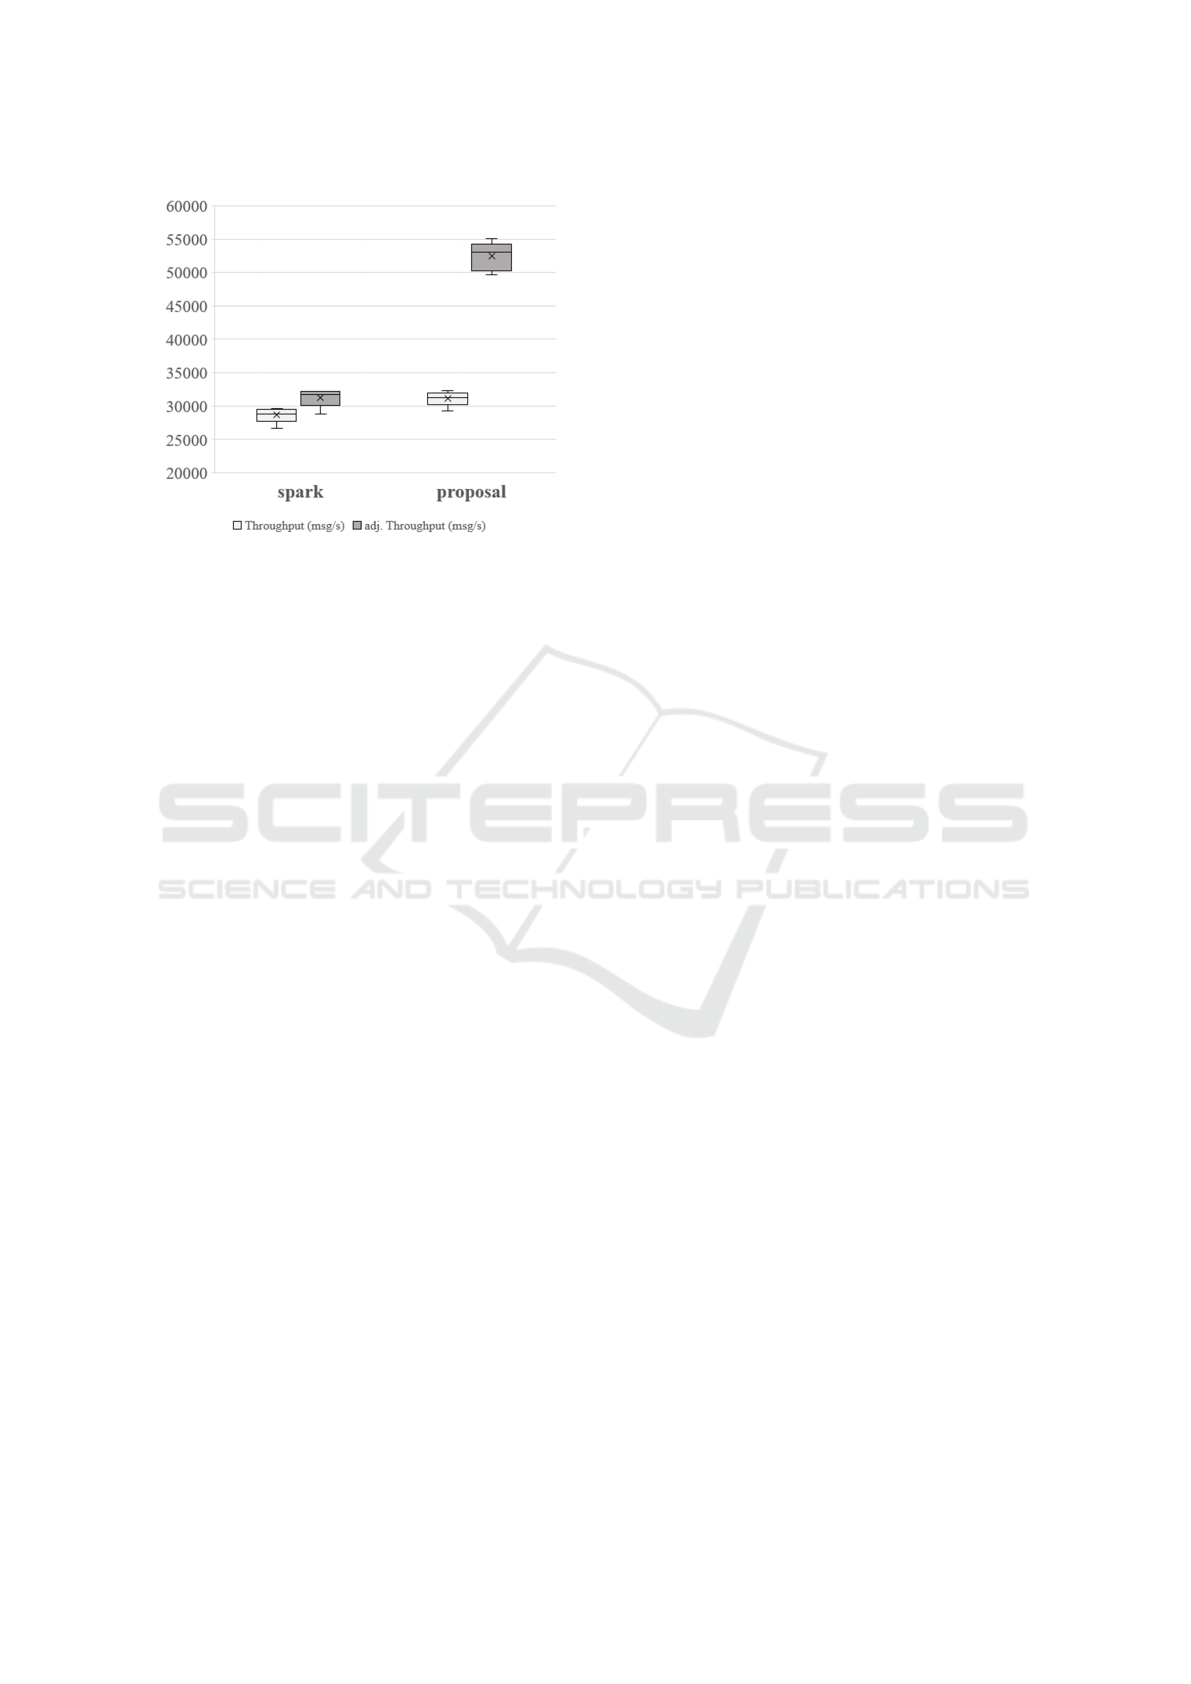
Figure 2: Results of the experiment in terms of throughput
and adjusted throughput.
more clearly. The reasons for this discrepancy are
not obvious and need to be investigated further. One
explanation might be, that our proposed solution is a
more lightweight approach in terms of data process-
ing orchestration and thus less time coordinating be-
tween the processing instances is needed. This is fur-
ther supported by the lower start-up time of our pro-
posed solution as compared to the Spark cluster. An-
other reason might be, that the used data set is too
small to have the Spark cluster access its full process-
ing potential. On the other hand, execution times were
about 300 seconds for each run, which, in previous
experiments, was enough time to have the Spark clus-
ter run at full capacity. In conjunction with the results
of the CPU and memory usage it also seems plausi-
ble, that the analytics operators were either not as re-
source heavy as the Spark executors or could utilize
available processing resources better than their coun-
terparts as evidenced by their significantly higher us-
age of them. Still, both approaches were able to han-
dle a large amount of data in a ML-based smart home
use case.
Regarding the quality of the resulting forecasting
models, an assessment of their worth for consumers
is difficult. With the MAPE between forecasted con-
sumption and actual consumption value going below
10% at around 13,000 data points, in other words af-
ter around 135 days, the usefulness of the gained in-
sights relies heavily on individual preferences of con-
sumers and the intended use case for the data. For
example, the usefulness of a 90% accurate forecast of
the energy consumption of a household may be higher
in April as compared to November, since consumers
could potentially change their consumption behaviour
and influence the actual value at the end of the year
longer. In order to allow for a more meaningful com-
parison, future research should therefore put our ex-
periment in contrast to approaches using offline ML
algorithms and appropriate architectures. The re-
sults of such a comparison should be taken into con-
sideration in conjunction with the achieved message
throughput and the costs of computing resources, to
guide the selection and application of appropriate an-
alytics architectures for practitioners.
6 CONCLUSIONS & OUTLOOK
In this paper, we have proposed an architectural solu-
tion to enable IoT analytics for ML-based use cases
in the domain of smart home. Use cases in this area
are characterized by a large number of small analytics
scenarios, which require the training and application
of individual ML models in real-time. This leads to
additional requirements and challenges for analytics
architectures as compared to different IoT domains.
In order to tackle these, we propose an architectural
solution, by utilizing state of the art data stream pro-
cessing technologies and online ML algorithms.
The resulting architecture is based on the kappa
architecture concept and uses lightweight microser-
vices for analytics pipeline orchestration and deploy-
ment, thus promoting flexibility in terms of resource
usage and analytics pipeline adaptability, when con-
fronted with changed analytics scenario requirements.
With regard to already existing solutions for ML-
based IoT analytics in general and the area of smart
home in particular, the presented architecture de-
scribes a new approach in this problem domain. In
order to evaluate the proposed solution, we conducted
an experiment, which is based on forecasting energy
consumption of individual households, using an on-
line ML algorithm and smart meter data. The results
of this quantitative evaluation showed, that the so-
lution architecture is not only able to process large
amounts of data, but even faster than current state of
the art architectures using Apache Spark. Still, fur-
ther research needs to be conducted to address the
questions which arise from this paper. In this regard,
we identified two main areas. The proposed archi-
tecture needs to address additional challenges and re-
quirements, such as network latency and usage, secu-
rity and privacy, etc., which have already been iden-
tified in previous research, thus increasing its appli-
cability in consumer-centric use cases. Furthermore,
an investigation and assessment of the advantages and
disadvantages of the use of online ML against offline
ML procedures, in conjunction with resource usage of
data processing, needed forecasting accuracy etc., has
to be done in order to evaluate the proposed architec-
ture economically.
A Cloud-based Analytics Architecture for the Application of Online Machine Learning Algorithms on Data Streams in Consumer-centric
Internet of Things Domains
195

ACKNOWLEDGEMENTS
The work presented in this paper is partly funded by
the European Regional Development Fund (ERDF)
and the Free State of Saxony (S
¨
achsische Aufbaubank
- SAB).
REFERENCES
Amasyali, K. and El-Gohary, N. M. (2018). A review of
data-driven building energy consumption prediction
studies. Renewable and Sustainable Energy Reviews,
81:1192–1205.
Augenstein, C., Spangenberg, N., and Franczyk, B.
(2019). An architectural blueprint for a multi-purpose
anomaly detection on data streams. In Proceedings of
the 21st International Conference on Enterprise Infor-
mation Systems, pages 470–476. SCITEPRESS - Sci-
ence and Technology Publications.
Bifet, A., Holmes, G., Kirkby, R., and Pfahringer, B.
(2010). Moa: Massive online analysis. J. Mach.
Learn. Res., 11:1601–1604.
Fan, W. and Gordon, M. D. (2014). The power of social me-
dia analytics. Communications of the ACM, 57(6):74–
81.
Fortino, G., Giordano, A., Guerrieri, A., Spezzano, G., and
Vinci, A. (2015). A data analytics schema for activity
recognition in smart home environments. In Garc
´
ıa-
Chamizo, J. M., Fortino, G., and Ochoa, S. F., edi-
tors, Ubiquitous Computing and Ambient Intelligence.
Sensing, Processing, and Using Environmental Infor-
mation, volume 9454 of Lecture Notes in Computer
Science, pages 91–102. Springer International Pub-
lishing, Cham.
Gomes, H. M., Bifet, A., Read, J., Barddal, J. P., En-
embreck, F., Pfharinger, B., Holmes, G., and Ab-
dessalem, T. (2017). Adaptive random forests for
evolving data stream classification. Machine Learn-
ing, 106(9-10):1469–1495.
Gonzalez-Vidal, A., Ramallo-Gonzalez, A. P., Terroso-
Saenz, F., and Skarmeta, A. (2017). Data driven
modeling for energy consumption prediction in smart
buildings. In Nie, J.-Y., Obradovic, Z., Suzumura, T.,
Ghosh, R., Nambiar, R., and Wang, C., editors, 2017
IEEE International Conference on Big Data, pages
4562–4569, Piscataway, NJ. IEEE.
Hasan, T., Kikiras, P., Leonardi, A., Ziekow, H., and
Daubert, J. (2015). Cloud-based iot analytics for
the smart grid: Experiences from a 3-year pilot. In
Michelson, D. G., Garcia, A. L., Zhang, W.-B., Cap-
pos, J., and Darieby, M. E., editors, Proceedings of
the 10th International Conference on Testbeds and
Research Infrastructures for the Development of Net-
works & Communities (TRIDENTCOM).
Khan, M., Babar, M., Ahmed, S. H., Shah, S. C., and Han,
K. (2017). Smart city designing and planning based
on big data analytics. Sustainable Cities and Society,
35:271–279.
Lin, Y.-H. (2019). Novel smart home system architec-
ture facilitated with distributed and embedded flexible
edge analytics in demand–side management. Inter-
national Transactions on Electrical Energy Systems,
17(7):e12014.
Pham, L. M. (2016). A big data analytics framework for
iot applications in the cloud. VNU Journal of Science:
Computer Science and Communication Engineering,
31(2).
Popa, D., Pop, F., Serbanescu, C., and Castiglione, A.
(2019). Deep learning model for home automa-
tion and energy reduction in a smart home environ-
ment platform. Neural Computing and Applications,
31(5):1317–1337.
Strategy Analytics (2019). Internet of things now numbers
22 billion devices but where is the revenue? retrieved
from https://news.strategyanalytics.com/press-
release/iot-ecosystem/strategy-analytics-internet-
things-now-numbers-22-billion-devices-where.
Wehlitz, R., Zsch
¨
ornig, T., and Franczyk, B. (2019). A pro-
posal for an integrated smart home service platform.
In Proceedings of the 21st International Conference
on Enterprise Information Systems, pages 630–636.
SCITEPRESS - Science and Technology Publications.
Yassine, A., Singh, S., Hossain, M. S., and Muhammad, G.
(2019). Iot big data analytics for smart homes with fog
and cloud computing. Future Generation Computer
Systems, 91:563–573.
Zhong, R. Y., Xu, X., Klotz, E., and Newman, S. T. (2017).
Intelligent manufacturing in the context of industry
4.0: A review. Engineering, 3(5):616–630.
Zsch
¨
ornig, T., Wehlitz, R., and Franczyk, B. (2017). A
personal analytics platform for the internet of things:
Implementing kappa architecture with microservice-
based stream processing. In Proceedings of the 19th
International Conference on Enterprise Information
Systems, pages 733–738. SCITEPRESS - Science and
Technology Publications.
IoTBDS 2020 - 5th International Conference on Internet of Things, Big Data and Security
196
