
Auto-scaling Walkability Analytics through Kubernetes and Docker
SWARM on the Cloud
Lu Chen, Yiru Pan and Richard O. Sinnott
School of Computing and Information Systems,
University of Melbourne, Melbourne, Victoria, Australia
Keywords: Auto-scaling, Container Orchestration, Docker Swarm, Kubernetes, Openstack.
Abstract: The Australian Urban Research Infrastructure Network (AURIN – www.aurin.org.au) provides a data-driven,
Cloud-based research environment for researchers across Australasia. The platform offers seamless and
secure access to over 5000 definitive data sets from over 100 major government agencies across Australia
with over 100 targeted tools that can be used for data analysis. One such tool is the walkability tool
environment. This offers a set of Cloud-based components that generate walkability indices at user-specified
scales. The walkability tools utilize geospatial data to create walkability indices that can be used to establish
the walkability of given locations. The walkability workflow tools are built on a range of specialised spatial
and statistical functions delivered as part of the AURIN environment. However, the existing AURIN web-
based tools are currently deployed on a single (large) virtual machine, which is a performance and scalability
bottleneck. Container technologies such as Docker and associated container orchestration environments such
as Docker Swarm and Kubernetes support Cloud-based scaling. This paper introduces the background to the
walkability environment and describes how it was extended to support Docker in Swarm mode and
Kubernetes to make the walkability environment more robust and scalable, especially under heavy workloads.
Performance benchmarking and a case study are presented looking at the creation of large-scale walkability
indexes for areas around Melbourne.
1 INTRODUCTION
Containerisation has now overtaken traditional
cloud/hypervisor-based virtualization used to realise
Infrastructure-as-a-Service (IaaS) Cloud
environments (Bhardwaj, Jain, & Jain, 2010). Docker
is the leading container-based application
environment (Boettiger & Carl, 2015). It allows users
to easily package, distribute and manage applications
within containers, and conveniently utilize libraries.
There are many benefits of using Docker: reducing
infrastructure costs, continuous integration support,
rapid deployment across multi-cloud environments
and reducing the overheads incurred through typical
IaaS platforms (Zhanibek & Sinnott, 2017).
Docker alone however is inadequate when it
comes to managing applications comprising hundreds
of containers spreading across multiple hosts.
Containers need to be managed, support scheduling,
load balancing and auto-scaling. Container
orchestration tools like Docker Swarm and
Kubernetes are able to scale applications however the
pros and cons of either technology is not well
understood. In this paper, we present a scalable
Dockerized application, show how it supports auto-
scaling, and compare and contrast Docker SWARM
and Kubernetes.
This application focuses on scaling a walkability
analytics tool. The walkability of a given area is a key
factor that can impact on the health and well-being of
individuals in urban environments. The core idea is to
consider how walkable a given area is. This is based
on the road/street network and where individuals
might be able to walk, coupled with the actual land
use of where the individuals may walk. There are
many walkability tools that have been developed. In
this work, we focus on scaling a walkability tool that
was originally developed and supported as part of the
federally funded AURIN project (www.aurin.org.au).
AURIN has been running since 2010 and the
walkability tool is one of the most popular tools used
by the community. However, this solution does not
leverage the more recent advantages of container
technologies and especially support for auto-scaling.
It is noted that AURIN is a major platform that has
galvanised urban research in Australia with over
Chen, L., Pan, Y. and Sinnott, R.
Auto-scaling Walkability Analytics through Kubernetes and Docker SWARM on the Cloud.
DOI: 10.5220/0009337902610272
In Proceedings of the 10th International Conference on Cloud Computing and Services Science (CLOSER 2020), pages 261-272
ISBN: 978-989-758-424-4
Copyright
c
2020 by SCITEPRESS – Science and Technology Publications, Lda. All rights reserved
261
16,000 users. It is regularly used in classes with over
300 students. As such the need to support elastic
scaling in bursty usage scenarios is essential. Given
the near real-time performance expectations of users
at scale, it is unrealistic to expect this scaling to be
delivered by more traditional IaaS solutions, e.g.
creating new virtual machine instances on the fly due
to the time overheads that this involves. Container
technologies offer a solution to address these issues,
however there is a clear need for container
orchestration tools to manage the scaling. In this work,
we focus especially on Docker as the leading
container environment and Kubernetes and Docker
Swarm as predominant container orchestration tools.
The rest of this paper is organized as follows.
Section 2 provides an overview of the walkability
environment and how it was realized in the AURIN
platform. Section 3 discusses the cloud infrastructure
and associated container orchestration technologies -
Docker in Swarm mode and Kubernetes. Section 4
presents a large-scale walkability case study around
Melbourne. Finally, Section 5 draws final conclusions
and identifies areas for future work.
2 WALKABILITY SYSTEM
DESIGN AND
IMPLEMENTATION
The walkability environment is a set of opensource
tools delivered as part of the AURIN infrastructure.
The tool is used to calculate indices to measure the
suitability for walking in given localities. Such
information can be used to understand and potentially
increase outdoor physical activity. It has been
established that physical inactivity is tightly
correlated with many diseases such as obesity and
dementia. Creation of more walkable neighbourhoods
is thus a key part of urban planning. Indeed, the
Organisation for Economic Cooperation and
Development (OECD - www.oecd.org) has called for
the governments to encourage physical activities by
offering the necessary legal and administrative
regulations for targeted land use and transport
planning
(Eason, 2019). The AURIN walkability
environment offers a set of Cloud-based tools to
measure the walkability at different levels of
granularities across Australia.
Walkability tools are an example of a Geographic
Information System (GIS). Frank et al studied the
influence of street networks, neighbourhood scales
and land use types on assessing walkability
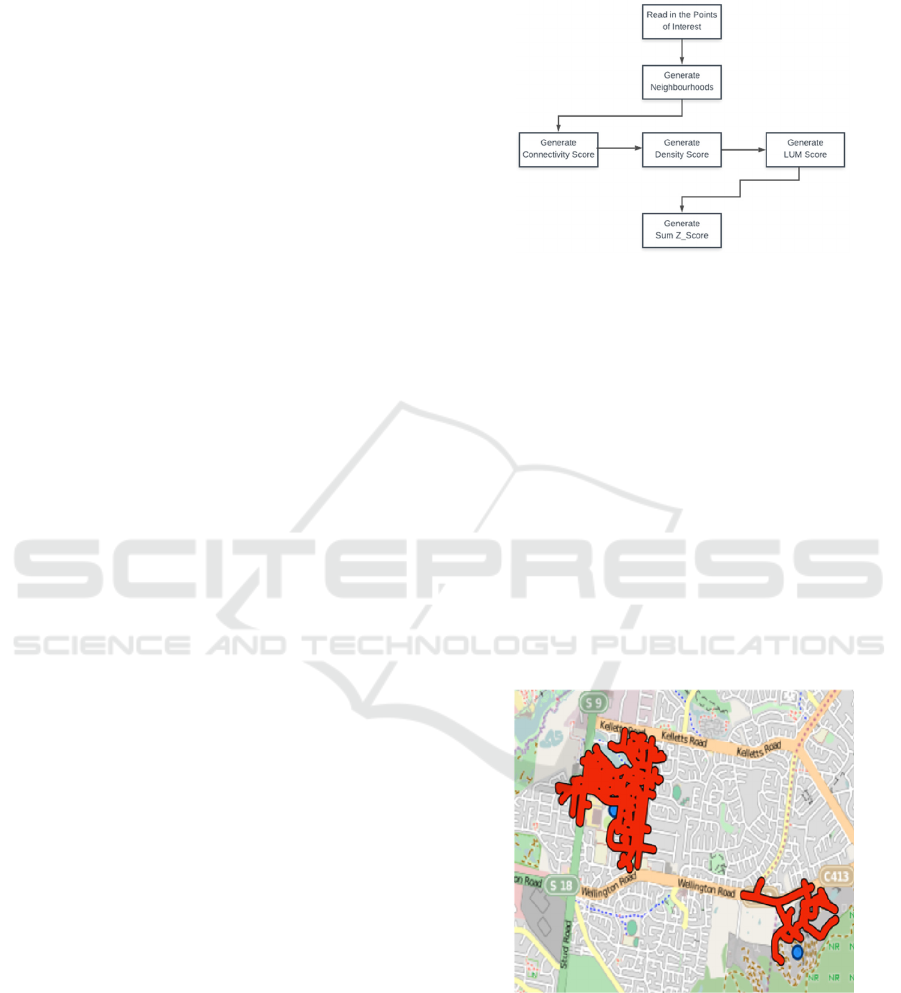
(Walkability Tools, 2019). The basic steps to
calculate walkability indices in AURIN are illustrated
in Figure 1.
Figure 1: The Steps for Walkability Analysis.
• Generate Neighbourhood: In this step, the user
has to input the Points of Interest, Maximum
Walking Distance and Buffer Size. Based on
this, the walkability tool will generate a
polygon (network neighbourhood)
representing potential walking routes a person
might follow from an initial starting point.
This network neighbourhood is used in other
walkability tools. An example of two network
neighbourhoods is shown in Figure 2. As seen
the algorithm traverses the road network (in
this case using data from the Public Sector
Mapping Agency (www.psma.com.au)) based
on an individual walking from a given location
(shown by the dots) for a given distance, e.g.
1km.
Figure 2: Network Neighbourhood Generation.
• Generate Connectivity Index: A Connectivity
index represents the number of street
intersections in the network neighbourhood
generated in the previous step. The number of
intersections has a positive correlation with
people’s mobility for walking.
CLOSER 2020 - 10th International Conference on Cloud Computing and Services Science
262
• Generate Density Index: Represents the
average population density within each
neighbourhood. This data is available from the
Australian Bureau of Statistics (also available
within AURIN).
• Generate Land Use Mix Index: In urban
environments, land can be used for different
purposes, e.g. residential housing, parkland,
commercial/industrial use, etc. The Land Use
Mix index aims to calculate the homogeneity
or heterogeneity of land use in a given
neighbourhood. (This data is available from
many sources within AURIN).
• Generate Sum_Zscore: The Sum_Zscore
represents a general walkability index derived
from all of the measures above. This is a
relative value which represents a scale from
the most walkable neighbourhood to the least
walkable one.
Such information can be used and compared with
other data sets existing within AURIN. For example,
what is the correlation of the walkability index with
the price of houses or with the average body mass
index of people in a given area amongst many other
scenarios. These other data sets are also available
within AURIN.
The workflow for calculating walkability is
sequential. The current AURIN platform runs all of
the previously identified steps on a single large virtual
machine (VM) with 16 vCPUs and 64GB RAM. The
bottlenecks of this solution are obvious. When a user
selects a large amount of points of interest or when
multiple users calculate the walkability concurrently,
this single instance will be running out of the limited
CPU and memory resources. Therefore, the goal is to
split this workflow into several independent
components. Each component can be encapsulated
into a Docker container. Each container can
subsequently perform the corresponding workflow
steps in parallel. More than one container can be
assigned for each walkability component to speed up
calculations. Furthermore, we can auto-scale these
units using orchestration tools, depending on the
dynamic load on the system. However, first and
foremost, it is necessary to convert the existing
sequential workflow into a parallel one.
To address this, we split the workflow into six
parallel components: Send Points, Generate
Neighbourhood Polygon, Generate Connectivity
Index, Generate Density Index, Generate Land Use
Mix Index and Generate Sum_Zscore. It should be
noted that dependencies still exist between some steps.
For example, the Generate Connectivity Index process
must obtain the neighbourhood polygons from the
Generate Neighbourhood Polygon process. To
support this, the queueing system Apache ActiveMQ
is introduced to support message passing between
different processes (Apache Active MQ, 2019).
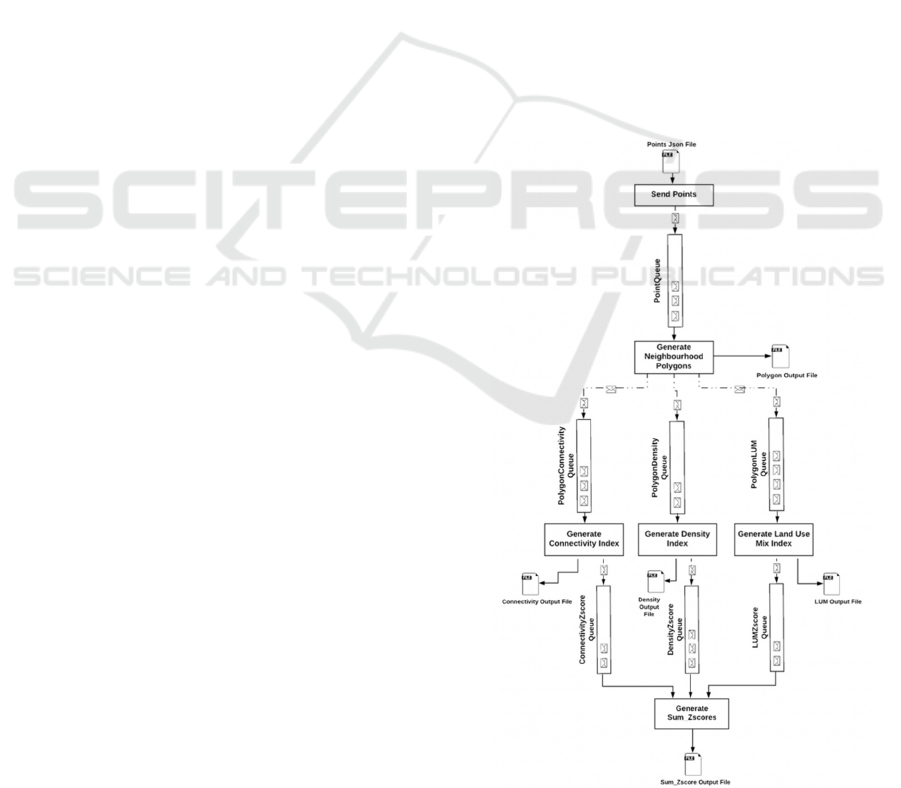
As shown in Figure 3, initially, the process Send
Points reads in a multi-point JSON file, converts each
point into GeoJson format and places it into a queue
named PointQueue. Once the process Generate
Neighbourhood Polygon receives a point from the
queue, it generates the neighbourhood polygons and
sends the resultant polygon in GeoJson format into the
three queues: PolygonConnectivity, PolygonDensity
and Polygon LUM. Following this, the three processes
Generate Connectivity Index, Generate Density Index
and Generate Land Use Mix Index receive the
polygon from the queues and generate Connectivity
Index, Density Index and Land Use Mix Index
concurrently. They will each append the result to their
own output files: Connectivity Output File, Density
Output File and LUM Output File. They will also
continue to send the results into the three queues
respectively: ConnectivityZscore, DensityZscore and
LUMZscore. Finally, the process Generate
Sum_Zscore is used to generate a final walkability
Figure 3: Workflow of The Improved Walkability Tool.
Auto-scaling Walkability Analytics through Kubernetes and Docker SWARM on the Cloud
263
Sum_Zscore and output this as a GeoJson file.
The original walkability application code was
written in Java and deployed as a Maven Project on
the Cloud.
3 CLOUD INFRASTRUCTURE
AND CONTAINER
ORCHESTRATION TOOLS
This work utilized the National eResearch
Collaboration and Tools and Resources research
cloud (NeCTAR – www.nectar.org.au). This is a free
public research Cloud for researchers in Australia.
The NeCTAR infrastructure is implemented and
managed as an OpenStack Cloud-based computing
framework. The project utilized 16 compute instances
comprising 32 CPUs with a total of 128GB RAM and
300GB attached volume. The storage was set up as a
cluster to deal with a large amount of calculations
required for the walkability application. One VM was
assigned as a manager and the other fifteen VMs were
assigned as computational data processing workers.
The VMs were automatically setup using the
Python library Boto and the various software
dependencies were installed and configured using the
scripting language Ansible. Compulsory software
dependencies included Maven, Openjdk-8 and
Docker. The OpenStack Heat orchestration service
was also used to provide a template-driven service to
manage the lifecycle of the walkability applications
on the Cloud.
3.1 Docker SWARM Realisation of
Walkability
A Docker Swarm cluster is a group of machines
(servers), physical or virtual that run Docker and can
connect to each other. A machine in a Swarm cluster
is called a “node”. The role of each node can be either
a manager or a worker. A manager node is capable of
assigning containers to worker nodes and to distribute
the workload “evenly” over the cluster. A manager
node is typically used as the interface for clients. A
worker node provides its resources and executes
whatever it is required based on requests from the
master node.
As discussed, we decomposed the walkability tool
into six separate services: (1) Send Points, (2)
Generate Neighbourhood Polygon, (3) Generate
Connectivity Index, (4) Generate Density Index, (5)
Generate Land Use Mix Index and (6) Generate
Sum_Zscore. We built six Docker images for each of
these six services. Each service runs only a single
image. However, multiple containers can run the same
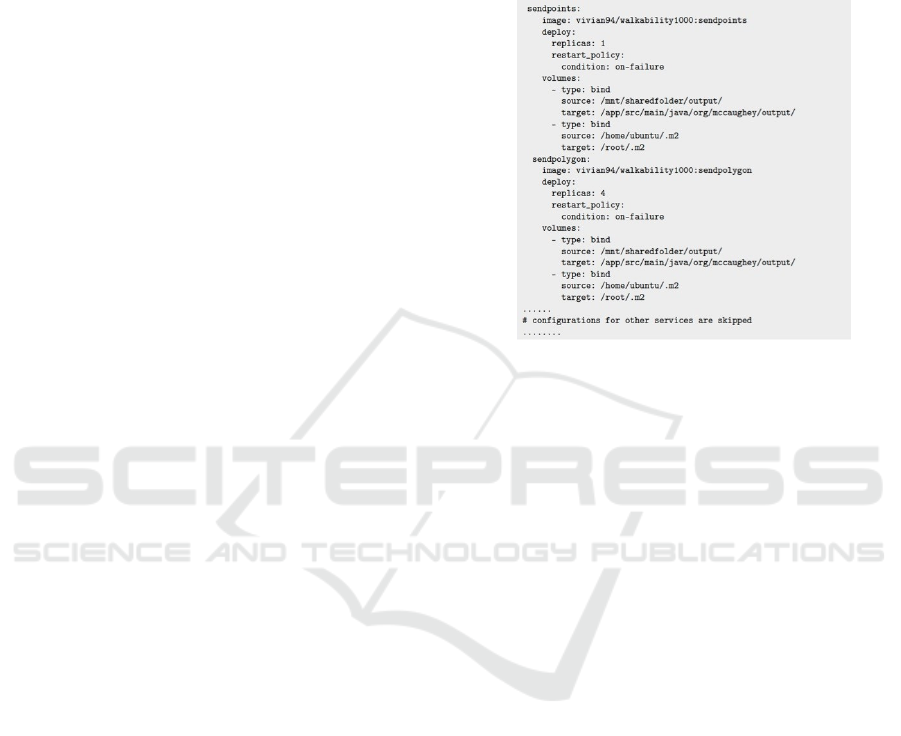
service if required. These services are defined, run
and auto-scaled on the Docker platform by a
dockercompose.yml file. An example of this file is
shown in Figure 4.
Figure 4: A snippet of a docker-compose.yml file.
In the configuration settings, we mounted the
Maven dependencies from the host machine into the
containers. This saves considerable time since the
containers do not need to download all of the required
dependencies at the very start.
3.1.1 Docker SWARM Experiments
We deployed the walkability application into the
aforementioned 16-node Docker Swarm cluster. The
test files included different multi-point input
(geoJSON) files comprising 100, 500 and 1000
geolocations (points). For each dataset, we changed
the number of containers assigned to each service and
compared their running time and speedup compared
to the original (sequential) version used by the
AURIN platform.
In the tables below, we denote the number of
containers for each service in the sequence of (1) Send
Points, (2) Generate Neighbourhood Polygon, (3)
Generate Connectivity Index, (4) Generate Density
Index, (5) Generate Land Use Mix Index and (6)
Generate Sum_Zscore. For example, [1,1,1,1,1,1]
implies that we allocated one container for each
service. Service (1) Send Points and Service (6)
Generate Sum_Zscore could only be assigned one
container to run because they have to utilize the global
ordering of the messages. From initial experiments,
we also identified that service (4) Generate Density
Index and service (5) Generate Land Use Mix Index
consumed very little CPU resources (~1%). Hence,
CLOSER 2020 - 10th International Conference on Cloud Computing and Services Science
264
there was no need to scale them up. As a result, we
mainly focused on the scaling of service (2) Generate
Neighbourhood Polygon and service (3) Generate
Connectivity Index.
Table 1: 100 Points Running Time & Speedup (Sequential
Running Time: 79s).
Number of
Containers
Running Time (s)
Speedup
[1,1,1,1,1,1]
62
1.27
[1,2,2,1,1,1]
61
1.30
[1,3,3,1,1,1]
52
1.52
[1,4,4,1,1,1]
54
1.46
[1,5,5,1,1,1]
57
1.39
[1,6,6,1,1,1]
55
1.44
Table 2: 500 Points Running Time & Speedup (Sequential
Running Time: 176s).
Number of Containers
Running Time (s)
Speedup
[1,1,1,1,1,1]
242
0.73
[1,2,2,1,1,1]
169
1.04
[1,3,3,1,1,1]
131
1.34
[1,4,4,1,1,1]
104
1.69
[1,5,5,1,1,1]
84
2.10
[1,6,6,1,1,1]
89
1.98
Table 3: 1000 Points Running Time & Speedup (Sequential
Running Time: 252s).
Number of Containers Running Time
(s)
Speedup
[1,1,1,1,1,1]
461
0.55
[1,2,2,1,1,1]
251
1.00
[1,3,3,1,1,1]
205
1.23
[1,4,4,1,1,1]
177
1.42
[1,5,5,1,1,1]
141
1.79
[1,6,6,1,1,1]
98
2.57
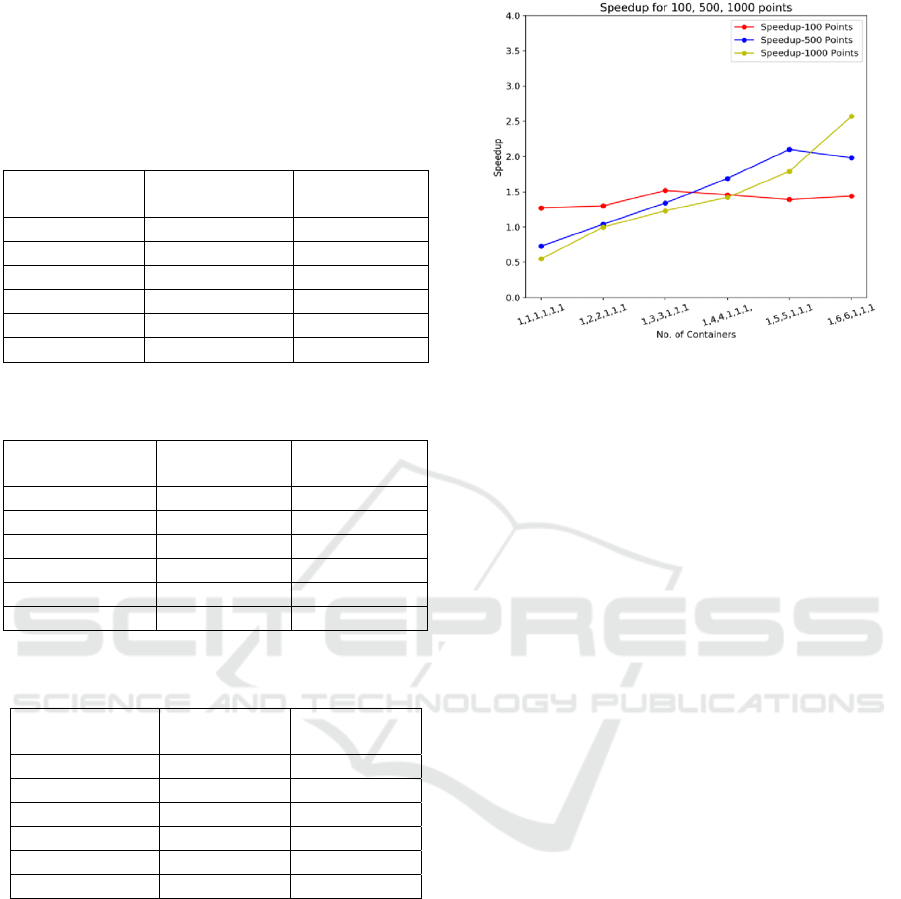
From the above results shown in Figure 5, we can
clearly observe the trend that when the number of
replicas was increased, the speedup increased
accordingly. Initially with one container assigned for
each service, it can be seen that the speedup for 100
and 500 points was below 1, i.e. the running time was
slower than the sequential case for the baseline
AURIN walkability deployment. This indicates that
the overheads generated by the Docker Swarm cluster
orchestration and communication are non-negligible.
However, when more replicas were allocated for the
Generate Neighbourhood Polygon and Generate
Figure 5: Speedup for 100, 500 and 1000 Points with
Docker Swarm.
Connectivity Index services, the speedup exceeded 2.5
(in the 1000 points case). We also note that the
speedup of 500 or 1000 points is more obvious than
for 100 points, demonstrating that more data can take
more advantage of the Dockerized version of the
walkability tool.
More containers do not always bring more speed
however due to the associated container overheads.
For example, in the experiments above, for the
100points dataset, the combination [1,3,3,1,1,1]
achieves the maximum speed up. For the 1000-points
dataset, the combination [1,5,5,1,1,1] reaches the
maximum speed up.
Docker Swarm provides features to scale up
services. However, Docker Swarm requires manual
adjustment of the number of replicas to establish
which combination had the best performance. This
can be very time-consuming since it involves manual
changes to the YAML files. To address this, a more
advanced technique is required to achieve intelligent
and automatic resource allocation. Kubernetes was
used for this purpose.
3.2 Kubernetes-based Realisation of
Walkability
Kubernetes is an open-source container orchestration
tool created by Google. It builds upon many years of
experience of running production workloads at
Google, combined with best-of-breed ideas and
practices from the Cloud community. Kubernetes
helps users to orchestrate computing, networking, and
storage infrastructure required for their workloads.
Kubernetes is more complex than Docker Swarm,
however it offers a more flexible and resilient tool that
can support automated auto-scaling ("Kubernetes
Auto-scaling Walkability Analytics through Kubernetes and Docker SWARM on the Cloud
265

Horizontal Pod Cluster Auto-scaling: All You Need
to Know", 2018).
A Kubernetes cluster includes a master node,
worker nodes and Addons. A master node manages
resources, schedules workloads and typically interacts
with the user. A master node cannot run tasks, in
contrast to master nodes in Docker Swarm. Worker
nodes typically run containerized applications
scheduled by master nodes through pods. Addons are
pods and services that implement associated cluster
features such as DNS, Web UI (Dashboard), Cluster-
Level Logging, etc.
A pod is the basic building block of Kubernetes
(Kubernetes Documentation, 2018). A pod can
encapsulate one or more Docker containers.
Containers within a pod typically share a unique
network IP, storage, network and various other
features. Pods are considered to be relatively
ephemeral entities. When they are created, they are
assigned a unique ID and subsequently they are
available to other nodes. If a node dies, the pods
within that node are also deleted. Pods can be created
by YAML files, and each system component is
typically encapsulated in a pod with just one container.
A pod always runs on a node, i.e. a worker node in a
Kubernetes cluster. A node can have multiple pods.
The Kubernetes master node automatically schedules
the pods across the nodes in the cluster (Hightower,
Burns, & Beda, 2017).
A deployment is an object in Kubernetes that
supports the management of a set of identical pods.
Without a deployment, it is necessary to manually
create, update and delete bunches of pods. With a
deployment, a single object can be defined in a
YAML file. A deployment object is then responsible
for creating pods and ensuring their health. The
deployment YAML files were created for the scalable
parts of the walkability application. There were four
deployments in total, including sendpolygon-
deployment, sendconnectivity-deployment,
senddensity-deployment and sendlum-deployment.
3.2.1 Horizontal Pod Auto-scaling
A Horizontal Pod Auto-scaler (HPA) can
automatically scale the number of pods in a cluster
based on the observed CPU utilization or other
custom metrics. An HPA controller periodically
adjusts the number of replicas through a replication
controller or deployment to match the required CPU
utilization, which can be specified by the user.
An HPA auto-scaling algorithm was implemented
using a default 15 seconds control loop. This was
designed to be configurable based on the
horizontalpod-auto-scaler-sync-period. The HPA
periodically queries the pods to collect information on
their CPU utilization and compares the mean value of
all pod CPU utilization levels against the required
target. The HPA adjusts the number of replicas based
on satisfying the conditions below:
• MinReplicas <= Replicas <= MaxReplicas
• CPU Utilization (U) = recentCPU usage of
a pod (average across the last 1 minute) /
CPU requested by the pod
• Target Number of Pods = ceil(sum(Current
Pods CPU Utilization)) / Target
CPUUtilizationPercentage (T)
=
In this work, the HPA waits for 3 minutes after the
last scale-up event to allow for the metrics to stabilize.
Scale-down is based on waiting for 5 minutes from
the last rescaling in order to deal with temporary CPU
fluctuations that may occur during starting and
stopping containers. The default relative metrics
tolerance was set to 10%, which meant that any
scaling would only be made if the average current pod
utilization divided by the target CPU utilisation
dropped below 0.9 or increases above 1.1. This
autoscaling algorithm ensures that the HPA increases
the number of pods rapidly when user load is detected
whilst allowing for non-urgent decreasing of the
number of pods. These auto-scaling settings avoid
thrashing, i.e. preventing rapid execution of
conflicting decisions if the load is unstable.
To examine the application performance in a
Kubernetes cluster by observing the status of the
containers, pods, services, together with the
characteristics of the overall Cloud-based cluster
(Song, Zhang, & Hong, 2018), a metrics server was
installed. We use Prometheus to visualize the real
time monitoring status of the cluster (Mittermeier,
2018). Prometheus supports customized queries. As
one example, Figure 6 is a time-series view of the
cluster, showing CPU usage for each pod.
To explore walkability auto-scaling, as with the
Docker Swarm case study we used different
computation loads on the walkability system
including 100, 500 and 1000 points. We set the
configurations in HPA file for each deployment.
Kubernetes can auto-scale replicas according to the
HPA requirements. In this work we assign
minReplicas=1 and maxReplicas=5 for each HPA file.
The scaling time was measured for each deployment
under different computation load scenarios as shown
in Figure 7.
CLOSER 2020 - 10th International Conference on Cloud Computing and Services Science
266
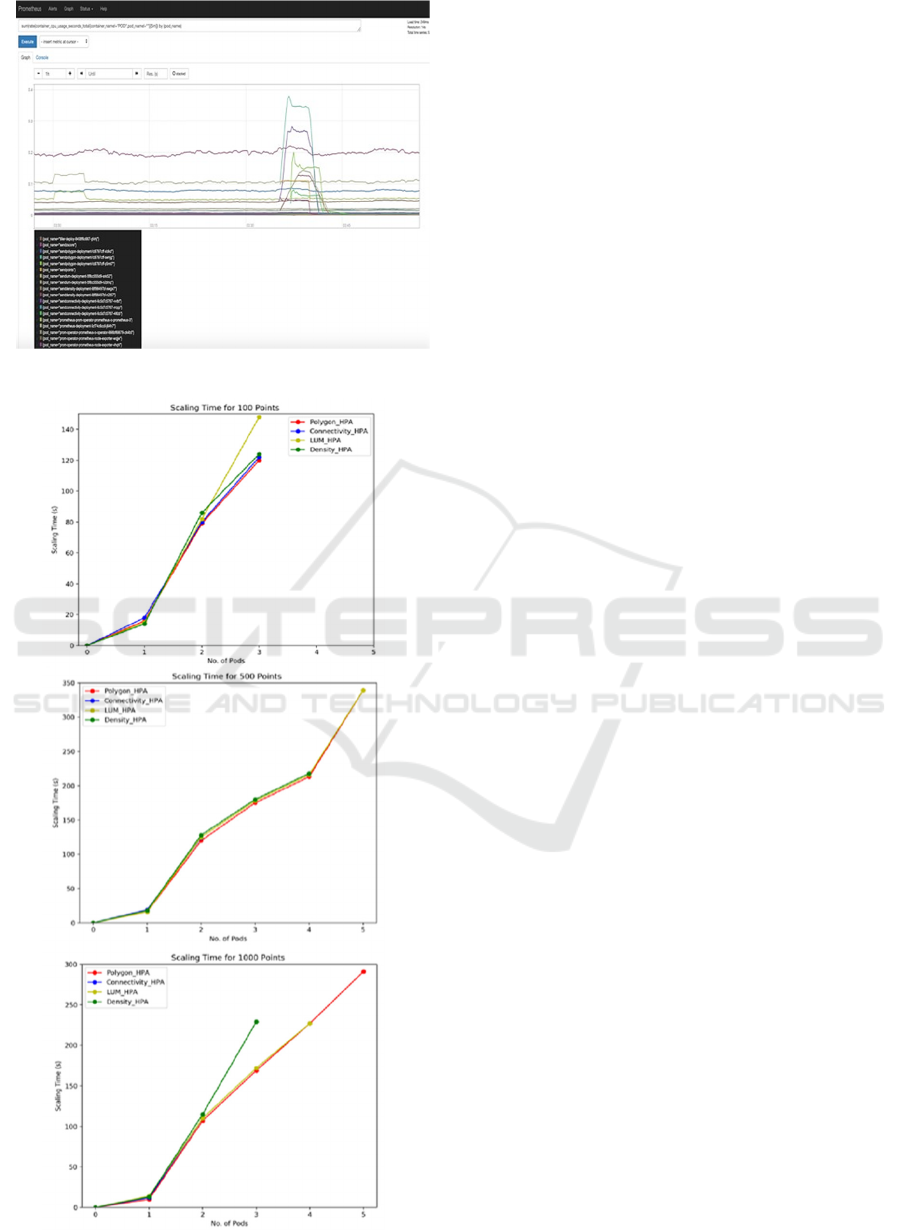
Figure 6: Prometheus Monitoring.
Figure 7: Scaling Time for 100, 500 and 1000 Points.
The results show that when we increased the
workload by increasing the number of input data
points, the HPA was able to successfully auto-scale
the number of pods. However, in the experiments we
found that Kubernetes auto-scaling could not speed up
computation significantly - it took 367 seconds to
finish the computation of 1000 points, since there
were overheads in creating pods and allocating
resources, which incurs additional time. Despite this,
there are several advantages for Kubernetes
autoscaling with regards to the walkability
environment:
• Auto-scaling helps to ensure the application
always has sufficient capacity to handle the
computational demand and thus provide better
availability.
• Compared to Docker Swarm, Kubernetes was
able to auto-scale according to dynamically
changing computation needs, i.e. there was no
need to modify the number of replicas in the
YAML file each time. Rather it was only
necessary to define an appropriate number of
maxReplica, and Kubernetes would perform
the auto-scaling automatically.
• Auto-scaling can also dynamically increase
and decrease capacity as needed, and thereby
help to reduce Cloud costs as much as possible,
as well as the associated administrative
demands (Singh & Singh, 2016).
4 WALKABILITY CASE STUDY
In order to examine the performance of the modified
application for larger scale urban research challenges,
we selected 3000 bus stops in the Melbourne area to
measure their walkability scores. Thus, we aimed to
explore whether people would use public transport
more if it was located in more walkable locations. It
is noted that the AURIN platform has access to many
data sets including bus stops and average commuting
times, as well as the road network data and land use
models that underpin the walkability analysis
scenarios. The experiments were realised on the
Cloud resources introduced previously. The
walkability score was calculated using a Walking
Distance of 800m and Buffer Size of 50m.
It is noted that when the same experiment was
conducted on the original AURIN (sequential)
walkability application, it led to memory overflow
issues since the calculations of 3000 points and
individuals walking for 800m on the road network
Auto-scaling Walkability Analytics through Kubernetes and Docker SWARM on the Cloud
267
exceeded the capacity of the single (albeit large)
virtual machine.
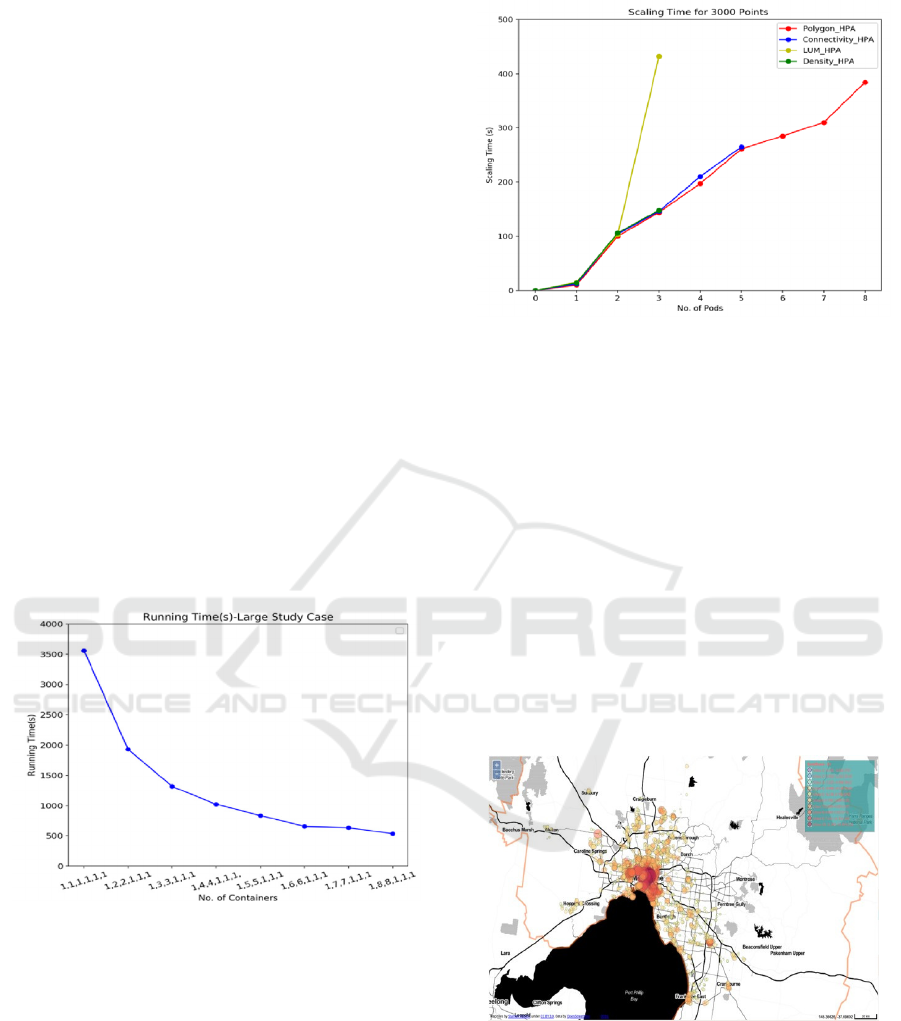
4.1 Docker SWARM Benchmarking
When we performed the experiment across the
Docker Swarm cluster on the NeCTAR Research
Cloud, the total running time was drastically reduced
by assigning more containers for the services as
shown in Figure 8. For example, when we assigned 8
containers for Generate Neighbourhood Polygon and
Generate Connectivity Index services, the running
time was decreased to 1/7 of the initial combination
[1,1,1,1,1,1], which was a satisfying result. The
overheads of the Docker Swarm cluster still exist
however, these were outweighed by the speedup
brought about by the container-based approach. The
requirements for memory during the calculations
were largely amortized by having multiple nodes and
parallelising the number of containers on different
nodes. This avoided the memory overflow issues of
the original sequential application. Thus, the approach
allows not just to perform faster walkability analyses,
but to support walkability scenarios that were hitherto
not possible with the existing AURIN walkability
environment.
Figure 8: Running Time for 3000 points Case Study.
4.2 Kubernetes Benchmarking
For the Kubernetes based scenario, the maxReplica
number for each HPA file was set to 8. The total
running time was 853s, which was slower than
Docker Swarm (536s). We also measured the scaling
time during the computation process. We found that
polygon_hpa scaled to the maxReplica number, which
indicated that generating polygons was the most
computationally consuming part of the walkability
tool as shown in Figure 9.
Figure 9: Scaling Time for 3000 points Case Study.
4.3 Result Visualisation and Analysis
To illustrate the potential of this work we show how
larger style case studies can be achieved. Specifically,
the Sum_Zscore of each region around an input data
set (point) is visualised in Figure 10. The bigger and
redder the centroid is, the more walkable the area is.
It is interesting to see that the most walkable regions
are located in the Melbourne Central Business District
(CBD). This has many intersections and hence this is
not surprising. It can also be seen that some outer
suburbs have bus stops that are also more walkable
than others. As mentioned before, the walkability
workflow also generates three other geoJSON output
files for the Connectivity_Zscore, Density_Zscore and
LUM_Zscore for each region of interest.
Figure 10: Sum_Zscore Visualisation.
As shown in Figure 11, we can clearly see that
connectivity is higher in the CBD and some northern
suburbs around Melbourne. The density of people in
the CBD is much higher than other areas. However,
the land use mix (LUM) index is distributed evenly on
the map without a clear trend, reflecting that land use
for each region is similarly diverse.
CLOSER 2020 - 10th International Conference on Cloud Computing and Services Science
268
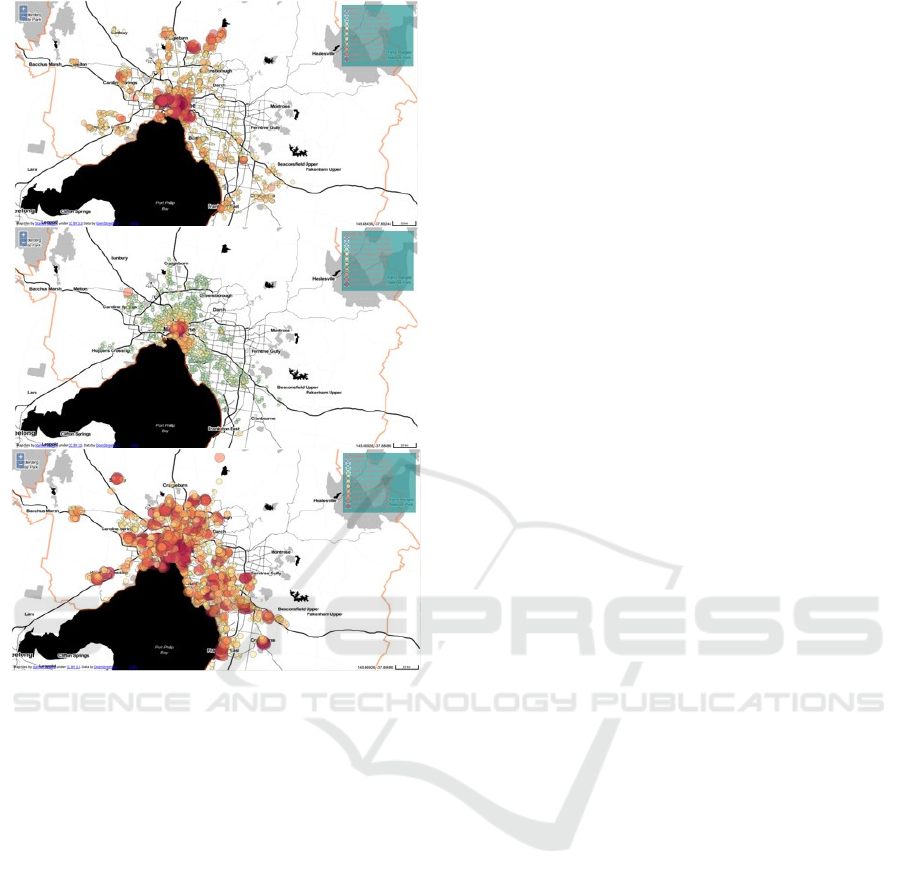
Figure 11: Connectivity_Zscore (top), Density_Zscore
(middle) and LUM_Zscore (bottom).
5 RELATED WORK
The idea of containers is not new. Indeed, they can be
traced back to 1992 (Pike, Presotto, Thompson,
Trickey, & Winterbottom, 1993). However, they have
gradually gained momentum and especially with the
growth and adoption of the Cloud for many diverse
research and business communities. Dockerized
applications, Infrastructure-as-Code (IaC), DevOps
are now terms frequently used in modern many
mainstream Cloud deployments. The advantages of
containers in comparison to traditional IaaS platforms
are that they are lightweight, portable and have
minimal overheads compared to other more
heavyweight Cloud solutions (Bernstein, 2014).
Furthermore, container technologies are well aligned
with IaaS solutions and can leverage the investments
that have already been made. They can also be used to
develop and deploy large-scale applications that
typify many big data processing and scientific
computing requirements.
An early study of container management is
presented in (He, et al., 2012). The authors compared
VM-based and container-based resource management
with specific focus on the basic capabilities and
resource-efficiency. The results showed that
container-based solutions outperform VM-based
approaches in terms of efficiency and have minimal
impact on key Cloud capabilities. In (Casalicchio,
2016), the authors provide a general formulation of
elastic provisioning for the deployment of VMs and
containers. They identified that containers were
adequate to manage diverse large-scale system
demands, however they identified that container
orchestration tools like Docker Swarm and
Kubernetes are essential for large scale container
management, and especially their need to work in
inter-cloud scenarios.
A performance comparison of leading micro
hosting virtualization approaches was presented with
specific focus on Docker and Flockport with native
platforms was explored in (Zhanibek & Sinnott, 2017).
They identified that there were minimal overheads
with regards to memory utilization or CPU by either
Docker or Flockport, whilst I/O and operating system
interactions incurred some overheads.
Container-based auto-scaling techniques were
also presented in (Lorido-Botran, Miguel-Alonso, &
Lozano, 2014). The authors focused on the design of
auto-scaling algorithms. They used Kubernetes
Horizontal Pod Auto-scaling (HPA) to provide a
threshold-based reactive controller that automatically
adjusted the required resources based on (dynamic)
application demand. This was realised through a
control loop that scaled up/down based on observed
CPU or memory load.
In (Kho Lin, 2018), auto-scaling of a defence
application for manpower planning and simulation
across the cloud was explored with focus on the
Kubernetes orchestration technology. In comparison
to this work, we utilize both Docker Swarm and
Kubernetes to auto-scale AURIN walkability tools
and make a comparison of the performance of these
two orchestration tools.
Walkability is a well explored topic that impacts
on many urban environments. For example, in
(Boulangé, 2016), the author designs an advanced
walkability analytic tool to help with community
planning. This tool utilises the association between
built environment attributes and walking behaviours.
In (Woo, Yu, & Lee, 2019), the authors point out that
the walkability is also influenced by the spatial
attributes of subsidized households. In this work,
Auto-scaling Walkability Analytics through Kubernetes and Docker SWARM on the Cloud
269

AURIN Walkability Analytics System adopted the
walkability measurements from Frank et al as
mentioned before (Walkability Tools, 2019).
In (Sinnott & Voorsluys, 2015) the authors
focused on scaling a walkability application on the
Cloud, however this was based on IaaS-based
approaches that do not tackle the real-time and
dynamic fluctuations that arise with many students in
a class running walkability analytics in real time.
More details on the AURIN platform including the
data sets and tools that are available are presented in
(Sinnott, et al., 2016). The security-oriented solutions
that AURIN offers to access more sensitive data sets
– including the use of walkability analytics
capabilities are presented in (Sinnott, Chhetri, Gong,
Macaulay, & Voorsluys, 2015).
6 CONCLUSIONS AND FUTURE
WORK
The need to scale applications on the Cloud is
important for many areas of research. Docker is the
leading container-based solution that offers many
advantages to scaling compared to more traditional
IaaS solutions. Docker Swarm and Kubernetes
provide container orchestration frameworks. Both
technologies provide support for multi-layer
application deployment over distributed nodes
(Kratzke, 2014). In terms of configuration setup,
Docker Swarm supports YAML while Kubernetes
supports both YAML and JSON. Docker Swarm and
Kubernetes have similar architectural patterns that
follow master-worker semantics.
However, there are many differences between
Docker SWARM and Kubernetes. Firstly, they have
different deployment units (Preuveneers, Lagaisse,
Truyen, Landuyt, & Joosen, 2019). Docker Swarm
encapsulates a task into a container, which is the
smallest unit for deployment. Several containers can
run the same task. However, in Kubernetes, pods are
the smallest running units. One pod can include one
container or several containers, depending on the
application requirements. Secondly, Kubernetes
provides more advanced scaling modes. Both
frameworks support scaling of applications, however,
Docker Swarm achieves this by defining the number
of container replicas in the docker-compose.yml file
whilst Kubernetes supports auto-scaling functionality
directly whereby it can adjust the number of pods
according to the performance of CPU or memory
resources. This is a more realistic approach for
dynamic Cloud applications. Thirdly, when it comes
to volume sharing, data can be shared persistently
among containers on the same host machine in
Docker Swarm Cluster, whereas in Kubernetes,
containers are also allowed to share data volumes
non-persistently within the same pod ("Docker
Swarm vs. Kubernetes: Comparison of the Two
Giants in Container Orchestration", 2019).
In the case study presented related to the
walkability tool, both Docker Swarm and Kubernetes
were implemented successfully. The performance of
both technologies can be clearly observed. Docker
Swarm had less overhead and the maximum speed up
could be achieved from multiple trials. Kubernetes
had more overheads but could auto-scale the
containers over the cluster intelligently according to
the actual (dynamic) requirements of the application.
Both solutions greatly enhanced the performance of
the original sequential walkability application of
AURIN. Kubernetes provides richer functionality
than Docker Swarm, however this comes at the cost
of complexity.
In this paper, we have achieved auto-scaling for
the walkability environment using a 16-node cluster
using Kubernetes a Horizontal Pod Auto-scaler
(HPA). Kubernetes auto-scaling can happen at two
levels: pod level and cluster/node level. In the former,
the pod level scaling is controlled by HPA and VPA
controllers. In the latter, the cluster level scaling is
controlled by a cluster auto-scaler that allows to scale
an existing cluster by adding new nodes and
allocating pending pods to the new node (Mittermeier,
2018). In the future, we aim to combine and compare
pod level and cluster level auto-scaling to
dynamically adjust cluster sizes according to the
actual computation load. In this model, we envisage
that the HPA updates pod replicas based on CPU
utilization. The cluster auto-scaler checks whether
there are any pods in a pending state, e.g. due to a lack
of Cloud resource. If so, one or more additional nodes
for pending pods would be provisioned by the cluster
auto-scaler. When a node is granted, e.g. by a cloud
provider such as Amazon, Microsoft Azure or Google
Cloud, the node is joined to the cluster and is then
ready to serve pods. The pending pods can then be
scheduled to the new node whereupon the Kubernetes
scheduler can allocate pending pods to the new node.
By combining these two auto-scalers, Cloud scaling
can become smarter and help to improve the
management of resources required for application
operation and deployment.
The authors would like to thank the National
eResearch Collaboration Tools and Resources for
providing the (free) access to and use of the Research
Cloud resources that were used in this paper. The
CLOSER 2020 - 10th International Conference on Cloud Computing and Services Science
270

authors would also like to thank Dr William
Voorsluys for help and support regarding the existing
AURIN walkability tool. AURIN is funded through a
grant by the federal government Department of
Education.
REFERENCES
Bhardwaj, S., Jain, L., & Jain, S. (2010). Cloud computing:
A study of infrastructure as a service (IAAS). International
Journal of Engineering and Information Technology,
2(1), 60–63.
Boettiger, & Carl. (2015). An introduction to Docker for
reproducible research. ACM SIGOPS Operating
Systems Review , 1, 71–79.
Zhanibek, K., & Sinnott, R. O. (2017). A Performance
Comparison of Microservice Hosting Technologies for
the Cloud. Future Generation Computing Systems, 68,
175–182. Retrieved from
https://doi.org/10.1016/j.future.2016.08.025
Eason, G. (2019). Together, we create better policies for
better lives. Retrieved from
https://www.oecd.org/about/.
National Research Infrastructure for Australia. Walkability
Tools. (2019). Retrieved from
https://docs.aurin.org.au/portal-help/analysing-
yourdata/walkability-tools/.
The Apache Software Foundation. Flexible Powerful Open
Source Multi-Protocol Messaging Active MQ, access
June 2018. Retrieved from https://activemq.apache.org/.
Kubernetes Horizontal Pod Cluster Auto-scaling: All You
Need to Know. (2018). Retrieved from
https://caylent.com/kubernetes-auto-scaling/.
Kubernetes Developers. Kubernetes Documentation. Tech.
rep. v1.10, access June 2018. URL:
https://kubernetes.io/docs/.
Hightower, K., Burns, B., & Beda, J. (2017). Kubernetes:
Up and Running Dive into the Future of Infrastructure.
(1st ed.). O’Reilly Media, Inc. Song, M., Zhang, C., &
Hong, E. H. (2018). An Auto Scaling System for API
Gateway Based on Kubernetes. In An Auto Scaling
System for API Gateway Based on Kubernetes (pp. 109–
112). IEEE 9th International Conference on Software
Engineering and Service Science (ICSESS).
Mittermeier, L. (2018). Dynamic Scheduling for Seamless
Computing. In Dynamic Scheduling for Seamless
Computing (pp. 41–48). IEEE 8th International
Symposium on Cloud and Service Computing (SC2).
doi: 10.1109/ICSESS.2018.8663784.
Singh, S., & Singh, N. (2016). Containers amp; Docker:
Emerging roles amp; future of Cloud technology. In
Containers amp; Docker: Emerging roles amp; future
of Cloud technology (pp. 804–807). 2nd International
Conference on Applied and Theoretical Computing and
Communication Technology (iCATccT). doi:
10.1109/ICATCCT.2016.7912109
Pike, R., Presotto, D., Thompson, K., Trickey, H., &
Winterbottom, P. (1993). The use of namespaces in plan
9. SIGOPS Oper. Syst. Rev, 27(2), 72–76.
Bernstein, D. (2014). Containers and cloud: From lxc to
docker to kubernetes. In Containers and cloud: From
lxc to docker to kubernetes (Vol. 1, pp. 81–84). IEEE
Cloud Computing.
He, S., Guo, L., Guo, Y., Wu, C., Ghanem, M., & Han, R.
(2012). Elastic application container: A lightweight
approach for cloud resource provisioning. In
Elasticapplication container: A lightweight approach
for cloud resource provisioning (pp. 15–22). IEEE 26th
International Conference on Advanced Information
Networking and Applications.
Casalicchio, E. (2016). Autonomic orchestration of
containers: Problem definition and research challenges.
In Autonomic orchestration of containers: Problem
definition and research challenges. 10th EAI
International Conference on Performance Evaluation
Methodologies and Tools.
Lorido-Botran, T., Miguel-Alonso, J., & Lozano, J. A.
(2014). A review of auto-scaling techniques for elastic
applications in cloud environments. Journal of Grid
Computing, 3, 559–592.
Kho Lin, S. (2018). Auto-Scaling a Defence Application
across the Cloud Using Docker and Kubernetes. In
Auto-Scaling a Defence Application across the Cloud
Using Docker and Kubernetes (pp. 327–334).
IEEE/ACM International Conference on Utility and
Cloud Computing Companion (UCC Companion). doi:
10.1109/UCC-Companion.2018.00076
Boulangé, C. I. J. (2016). The Walkability Planning Support
System: an evidence-based tool to design healthy
communities, Melbourne.
Woo, A., Yu, C. Y., & Lee, S. (2019). Neighborhood
walkability for subsidized households: Revisiting
neighborhood environments of Housing Choice
Voucher and Low-Income Housing Tax Credit
households. Cities, 89, 243–251.
Kratzke, N. (2014). A Lightweight Virtualization Cluster
Reference Architecture Derived from Open Source
PaaS Platforms. OPEN JOURNAL OF MOBILE
COMPUTING AND CLOUD COMPUTING, 17–30.
Preuveneers, D., Lagaisse, B., Truyen, E., Landuyt, D. V.,
& Joosen, W. (2019). A Comprehensive Feature
Comparison Study of Open-Source Container
Orchestration Frameworks. Applied Science.
github. Cloud Native Computing Foundation.
URL:
https://github.com/kubernetes/website/blob/release1.8/
docs/tasks/run-application/horizontal-pod-
autoscale.md
Docker Swarm vs. Kubernetes: Comparison of the Two
Giants in Container Orchestration. (2019). Retrieved
from
https://upcloud.com/community/stories/dockerswarm-
vs-kubernetescomparison-of-the-two-giantsin-
container-orchestration/.
Sinnott, R.O., & Voorsluys, W. (2015). A Scalable
Cloudbased System for Data-intensive Spatial Analysis.
Auto-scaling Walkability Analytics through Kubernetes and Docker SWARM on the Cloud
271

Journal of Software Tools for Technology Transfer. doi:
10.1007/s10009-015-0398-6
Sinnott, R.O., Bayliss, C. O., Bromage, A. O., Galang, G.
O., Gong, Y. O., Greenwood, P. O., … Widjaja, I. O.
(2016). Privacy Preserving Geo-Linkage in the Big
Urban Data Era. Journal of Grid Computing. doi:
10.1007/s10723-016-9372-0
Sinnott, R. O., & the AURIN Technical Team. (2016). The
Australian Data-driven Urban Research Platform:
Systems Paper. Australian Economic Review. doi:
10.1111/1467-8462.12152
Sinnott, R. O., Chhetri, P., Gong, Y., Macaulay, A., &
Voorsluys, W. (2015). Privacy-preserving Data
Linkage through Blind Geo-spatial Data Aggregation.
In Privacy-preserving Data Linkage through Blind
Geo-spatial Data Aggregation. New York: IEEE
International Symposium on Big Data Security on
Cloud (BigDataSecurity 2015).
CLOSER 2020 - 10th International Conference on Cloud Computing and Services Science
272
