
Efficient One-to-One Pair Matching for 2-D and 3-D Edge Detection
Evaluation
Samuel Smith
a
and Ian Williams
Digital Media Technology Lab, Birmingham City University, Birmingham, U.K.
Keywords:
Edge Detection, Surface Detection, Performance Evaluation, 3D.
Abstract:
This paper introduces a novel efficient method of obtaining one to one correspondence matching for fast,
accurate, performance evaluation of edge detectors. The proposed Efficient Pairing Strategy (EPS) overcomes
the computational cost limitations of the Hungarian algorithm, enabling a fast and accurate evaluation of 3-D
data and large 2-D data sets. In this work, the accuracy of the EPS method is measured against the optimal
Hungarian method across a data set of 124240 images, and is shown to produce accurate results with a Pearson
Pairwise Correlation coefficient of 0.99 . Additionally the efficiency of the EPS method is compared against
the fast Closest Distance Match (CDM), the Cost Scaling Assignment (CSA), and the commonly applied
Pratt figure of Merit (PFOM) methods. Analysis shows the EPS and CSA methods both produce cost scaling
accuracy comparable to the Hungarian algorithm. However the EPS method outperforms the CSA method in
computational efficiency, achieving linear computation time comparable to the efficient sub-optimal methods.
More generally, we make recommendations for using one to one correspondence matching over other methods
in order to produce reliable performance scores across 2-D and 3-D image data.
1 INTRODUCTION
Edge and surface segmentation is a prolific field of
computer vision where the purpose is to filter 2-
D and 3-D images in order to extract edges (2-D)
or surfaces (3-D) to create a representative bound-
ary map to support a higher level process (Williams
et al., 2014). Any new advancements in detectors ir-
respective of the approach (morphological, topologi-
cal, model based or machine learning) should be ob-
jectively evaluated to determine the valued improve-
ment over prior methods and thus the potential contri-
bution. Objective performance measurements allow
for the systematic comparison of different algorithms
in a repeatable, quantifiable manner often to find the
optimal algorithm for a specific task (Lopez-Molina
et al., 2013). While this is commonplace for 2-D edge
detection evaluation, 3-D surface detection evaluation
offers many barriers, notably the computational cost,
which at present leaves 3-D performance evaluation
largely unexplored.
Performance measures in edge detection can be
broadly categorised into qualitative, quantitative or
hybrid methods (Heath et al., 1996). Qualitative mea-
a
https://orcid.org/0000-0001-9276-0354
sures are analytical approaches which typically con-
sist of multiple human assessors grading the out-
put result images against specific criteria (i.e. ob-
ject recognition, scene recognition etc.). However
quantitative measures empirically assess the edge de-
tection results in an automated or objective manner
(Lopez-Molina et al., 2013) thus awarding a perfor-
mance score to the results based on some similarity
criteria. These objective performance methods aim to
remove the subjective human element from the anal-
ysis, giving an unbiased evaluation, which can be ap-
plied rapidly to large data sets using both reference
based analysis (i.e evaluating against a ground truth
image) or non reference based (i.e. not requiring a
ground truth image and evaluating the inherent prop-
erties of the edge map for example the edge connec-
tivity)(Nercessian et al., 2009; Zhu, 1996; Kitchen
and Rosenfeld, 1981). These methods provide a mea-
sure of edge or surface quality, which can be useful
for determining how fit for purpose the outputs are for
higher level operations for example region segmenta-
tion or object recognition.
Reference based performance analysis allows for
the measurement of accuracy against the ground truth
ideal image. The ground truth image is commonly a
binary image containing all pixels labelled as either
590
Smith, S. and Williams, I.
Efficient One-to-One Pair Matching for 2-D and 3-D Edge Detection Evaluation.
DOI: 10.5220/0009330005900598
In Proceedings of the 15th International Joint Conference on Computer Vision, Imaging and Computer Graphics Theory and Applications (VISIGRAPP 2020) - Volume 4: VISAPP, pages
590-598
ISBN: 978-989-758-402-2; ISSN: 2184-4321
Copyright
c
2022 by SCITEPRESS – Science and Technology Publications, Lda. All rights reserved

Figure 1: Displacement of edge. True edge fits between the
2 rows of pixels, however edge must conform to the pixel
grid, therefore when maintaining single pixel edge thick-
ness, this results in 2 correct edge locations, which needs to
be accounted for during performance evaluation.
edge points or non edge points. The output binary
edge map can be objectively compared against each of
these points using a variety of methods (Savitzky and
Golay, 1964; Abdou and Pratt, 1979; Bowyer et al.,
2001; Prieto and Allen, 2003). The advantages of
using a ground truth image for reference allows for
the number of correctly detected edge points (True
Positives) missed edge points (False Negatives), in-
correct edge points (False Positives), to be measured.
These values can used to grade the output through a
variety of metrics and performance evaluation meth-
ods. Several objective performance algorithms such
as the Pratt figure of Merit (PFOM) (Abdou and Pratt,
1979), Probabilistic Rand Index (PRI) of Savitzsky
and Golay (Savitzky and Golay, 1964), Pixel Corre-
spondence Metric (PCM) of Prieto and Allen (Prieto
and Allen, 2003), Receiver Operating Characteristic
(ROC) Curves of Bowyer et al citeBowyer2001, the
Precision (P), Recall (R) and F-measures (F) of Mar-
tin et al (Martin et al., 2004), and also the Variation
of Information (VI) measure by Meil
˘
a (Meil
˘
a, 2005).
Each of these methods produce an objective metric
which grades how accurately the result image corre-
lates to the ground truth image.
While suitable for reference based objective mea-
sures, the above techniques can result in errors be-
tween the overall performance score and the visual
edge and surface detection results. Notably some ob-
jective measures do not account for a pixel (2-D) or
voxel (3-D) shift between the detected interface and
the ideal interface (Fig 1) or do not account for the
fragmentation of the detected edges which can re-
sult in incorrect assumptions about the quality of the
detection (Williams et al., 2008). Methods which
aim to evaluate the fragmentation and displacement
in detected edges often apply a one-to-many corre-
spondence match whereby for each candidate pixel in
the ground truth image, multiple candidates may be
matched in the result image as is the case with the
PFOM (Abdou and Pratt, 1979). This significantly
affects the reliability of the performance method and
leads to inaccuracies between the objective results and
the visual results (Williams et al., 2008).
To solve this problem, one-to-one correspondence
matching is required. In order to achieve optimal
one-to-one correspondence, the Hungarian algorithm
(Kuhn, 1955) for optimising solutions to the assign-
ment problem can be employed. Although the Hun-
garian algorithm provides the optimal solution to ref-
erence based edge detection performance evaluation,
the Hungarian algorithm introduces a high computa-
tional cost and is therefore impractical for large 2-D
image data sets and 3-D edge detection evaluation
such as Brats (et al., 2015). Acquiring more pro-
cessing power to solve the assignment task is not al-
ways practical, thus an efficient method for perform-
ing accurate one-to-one performance evaluation is de-
sirable, and such methods prior to this paper are lack-
ing in the literature .
The rest of the paper is structured as follows, sec-
tion 2 presents the overall problem associated with
pair matching in image edge detection evaluation.
Section 3 then presents an Efficient Paring Strategy
(EPS) algorithm for pair matching, detailing the step
by step functionality of this technique. Section 4 then
presents a comparative analysis of this against three
alternative approaches (CSA,CDM,PFOM). The ac-
curacy of the performance measure with respect to
optimal correspondence matching a Pearson pairwise
comparison is given for each of the methods against
the optimal Hungarian algorithm (Kuhn, 1955). We
then present the cost efficiency of the EPS method
compared against alternate methods, when applied to
a large data set of both 2-D and 3-D images. Fi-
nally section 5 presents the overall conclusions and
outcomes from this work and proposes the potential
for the EPS to be applied in efficient edge and surface
detection evaluation situations.
2 POINT CORRESPONDENCE IN
PERFORMANCE MEASURES
Digital images are comprised of discrete data, thus
the location of an edge (2-D) or surface (3-D) point is
constrained by the pixel or voxel resolution of the im-
age. Since these points are interfaces between regions
the true position of a region cannot be accurately rep-
resented by a discrete pixel or voxel point in an im-
age. Therefore an edge or surface detection algorithm
must position the result in accordance with the dis-
crete framework of the image and this introduces lo-
cation error (see Fig. 1 and Fig. 2c). Therefore, when
assessing the performance of these algorithms against
a ground truth an allowance for displacement should
be available to account for these localisation errors,
since detected, connected boundaries even with a dis-
placement are of value (Williams et al., 2008).
Efficient One-to-One Pair Matching for 2-D and 3-D Edge Detection Evaluation
591

(a) Ground Truth (b) Fragmented edge (c) Displaced edge
Figure 2: Pratt figure of Merit. Does not adequately pe-
nalise fragmented edges. Fragmented edge 0.9545, Dis-
placed edge 0.9000.
2.1 One-to-Many Correspondence
To account for a displacement in the detected edge
points and a ground truth, one-to-many correspon-
dence matching is commonly applied. This form
of correspondence aims to determine the overall dis-
placement of the detected points as a set compared
to the desired points as a set. The displacement is
then weighted depending on the displacement magni-
tude and influences the overall reference based per-
formance metric.
The Pratt Figure of merit (PFOM)(Abdou and
Pratt, 1979) is a common one-to-many performance
metric for edge detection and is prolific in the lit-
erature. PFOM can also be used to evaluate sur-
face detection via translation of this metric to 3-D
data. Displacement within the PFOM is considered
by measuring the Euclidean distance between edge
detected points and the edge position in the ground
truth, alongside the total number of detected edge
points in the image and the total number in the ground
truth. While PFOM offers a practical solution for
edge and surface detection performance, in many
cases it fails to produce an accurate result by allowing
multiple-to-one and one-to-multiple correspondence
between ground-truth and the algorithm result. Thus
an imbalance can be demonstrated between displaced
edges and fragmented edges where edge fragmenta-
tion can be awarded an higher performance than a
connected edge with only a small displacement error
(see Fig. 2a-c).
2.2 One-to-One Correspondence
To avoid the multiple-to-one and one-to-many prob-
lems illustrated with the PFOM, one-to-one corre-
spondence should always be applied. To constrain
the number of correctly detected points, each detected
edge pixel needs to correspond to only a single edge
pixel in the ground truth. Because of a need to tol-
erate a localisation error, a method of forcing one to
one correspondence between ground truth and result
image is required. It is therefore important to com-
pute the correspondence in order to penalise multiple
detections (Martin et al., 2004), since single detection
is one of the three important criteria of edge detec-
tion laid out by Canny (Canny, 1986). Forbes and
Draper (Forbes and Draper, 2000) paired farthest dis-
tance pixels within a tolerance zone of the ideal edge
pixel, while Bowyer (Bowyer et al., 2001) opted for
the closest match pair. This tolerance or allowance
was labelled as the T
match
. Whilst often used for ob-
jective performance, this general T
match
allowance re-
gion does not offer the most consistent approach. Ad-
dressing this, Liu (Liu and Haralick, 2000) published
a strategy for creating one to one correspondence by
matching declared edge pixels to edge pixels in the
ground truth image. Framing the task as the assign-
ment problem (Kuhn, 1955), which is solved using
the Hungarian algorithm.
For images, the Hungarian algorithm assignment
case will possess many agents and tasks, it is therefore
necessary to simplify the problem (Liu and Haralick,
2002). Using the T
match
principle, Bowyer (Bowyer
et al., 2001) was able to constrain the number of
potential matches, and produced an optimal method
for performance evaluation. This was further devel-
oped by Martin (Martin, 2003) using a Bipartite graph
method to solve a constrained assignment problem
for one to one correspondence, while Prieto (Prieto
and Allen, 2003) used Weighted Matching in Bipar-
tite Graphs to create the 2-D pixel correspondence
metric.
While the optimal strategy for solving the assign-
ment problem can be achieved using the Hungarian
algorithm (Kuhn, 1955) and bipartite graph meth-
ods (Prieto and Allen, 2003), these are computation-
ally expensive. Therefore using the Hungarian algo-
rithm for the pairing strategy is feasible for 2-D im-
ages, or for small data sets only. However, when con-
sidering the 3-D images of surface detection (Smith
and Williams, 2015), for example CT and MRI data,
the increased complexity arising from more potential
positions for a match makes this method computation-
ally costly, resource intensive and often impractical.
This complexity is compounded by the fact 3-D im-
ages typically contain a greater amount of voxels than
a 2-D image contains pixels, making this strategy at
current computational speeds impractical. Addition-
ally for a reliable comprehensive analysis of surface
detection methods, the performance measure needs to
be applied to many thousands of result images, for
example BRATS (et al., 2015). In order to undertake
an evaluation in a reasonable time frame and main-
tain the most representative objective accuracy, an ef-
ficient method of solving the assignment problem for
this case is required.
VISAPP 2020 - 15th International Conference on Computer Vision Theory and Applications
592

3 EFFICIENT PAIRING
STRATEGY (EPS)
3.1 EPS Procedure
The EPS procedure aims to replace the Hungarian
method for a fast solution to the assignment prob-
lem using a novel inflationary zone method within
a defined T
match
region. This method is an adapta-
tion of the Closest Distance Match (CDM) method of
Bowyer (Bowyer et al., 2001).However, the adapta-
tion allows for a more consistent metric, which more
closely replicates the correspondence matching of the
optimal Hungarian method, additionally this is suit-
ably fast for analysis of 3-D image volumes or fast
computation of multiple 2-D images in large data sets.
The method utilises a concept of zones within a
local neighbourhood window. Zones are defined to be
regions within a local T
match
neighbourhood window,
which occupy the same Euclidean distance from the
central pixel. Zones are ranked in levels from closest
to farthest from the central pixel. 2-D and 3-D exam-
ples are presented in Fig 3.
In order to compute one-to-one correspondence,
and avoid creating multiple partners for each candi-
date, each match needs to be computed concurrently.
For every false negative (FN) in the result edge and
surface image, a set of 2-D or 3-D zones derived from
a T
match
scaled neighbourhood is established, centred
on the FN location.
In each zone the number of potential candidates
for a match are counted. Then in order to minimise
the assignment cost, the closest match is preferen-
tial, thus pairings are made in the lowest level zone
first. However, as some FNs share the same candi-
date match, FNs with the fewest candidates are as-
signed a match first. This technique produces a clos-
est distance match correspondence, however, unlike
the CDM method, the matches are optimised such that
the maximum number of correspondences are pro-
duced. Once all candidates from the first zone are
exhausted, if FNs remain, the procedure repeats with
the next zone and so on until each zone in the T
match
neighbourhood has been checked in its entirety. Any
FNs without a pairing are labelled by the process as
a missed response, while any FPs in the result with-
out a pairing remain as a spurious response. From
here a number of performance methods can be ap-
plied. Either Precision recall based such as in the
work of Bowyer (Bowyer et al., 2001), but also a dis-
tance metric score can be applied such as in the work
of Prieto (Prieto and Allen, 2003). A detailed step by
step walk-through of the this procedure is given in the
following section.
3.2 2-D Example Case with EPS
Presented here for clarity is a 2-D example case for
matching of FN and FP responses for one to one
correspondence within a designated T
match
neighbour-
hood. For 3-D examples cubic T
match
regions and in-
flationary zones can be used (Fig. 5f-n). Fig 4(a and
b) shows an example of an edge detection result and
a ground truth solution.
1. First label all the true positives (TP) then remove
them from the response image (Fig 4(c).)
2. Next determine the location of all False Negatives.
(Fig 4(d))
3. In the FN locations, establish a set of zones desig-
nated by the T
match
neighbourhood (here 5×5).
4. In order to find which FN locations have the
fewest number of candidate matches, in each
zone, sum all potential correspondences between
the FN locations and FP responses. These are sig-
nified by blue points in Fig 5.
5. Establish closest distance matches by pairing FN
locations with FPs in the first available zone. Pair-
ings are to be made starting with FN locations
with the fewest available candidates in order to
maximise the number of parings. Once a paring
has been made, remove the T
match
neighbourhood
from that location and remove the FP response. In
this example, Zone 1 has no potential matches.
6. When all matches from the previous zone have
been established, repeat the process through each
zone until all FN locations have been assigned a
match or when the T
match
neighbourhood has been
exhausted. In the example case, Zone 2 FN1 and
FN2 locations each have candidate matches. FN1
has 2(Fig 5f), FN2 has 1 (Fig 5g), while FN3 has
zero (Fig 5h). Since FN2 has the fewest poten-
tial candidates (1) it is assigned first, then the re-
maining candidate FN1 is assigned. Zone 3 is pro-
cessed next, where the final remaining FN (Fig 5i)
is assigned a match and the pairing process is
completed
7. Unmatched FNs remain as missing responses,
while unmatched FPs remain as spurious re-
sponses.
8. Each pairing is assigned a cost which relates to the
zone from which the paring was made, the cost is
therefore the Euclidean distance, thus producing a
distance function of the pairings. As 2 points have
been matched from zone 2 and one from zone 3,
this provides a distance function of [1.41,1.41,2]
which can be used for a distance based metric.
Efficient One-to-One Pair Matching for 2-D and 3-D Edge Detection Evaluation
593
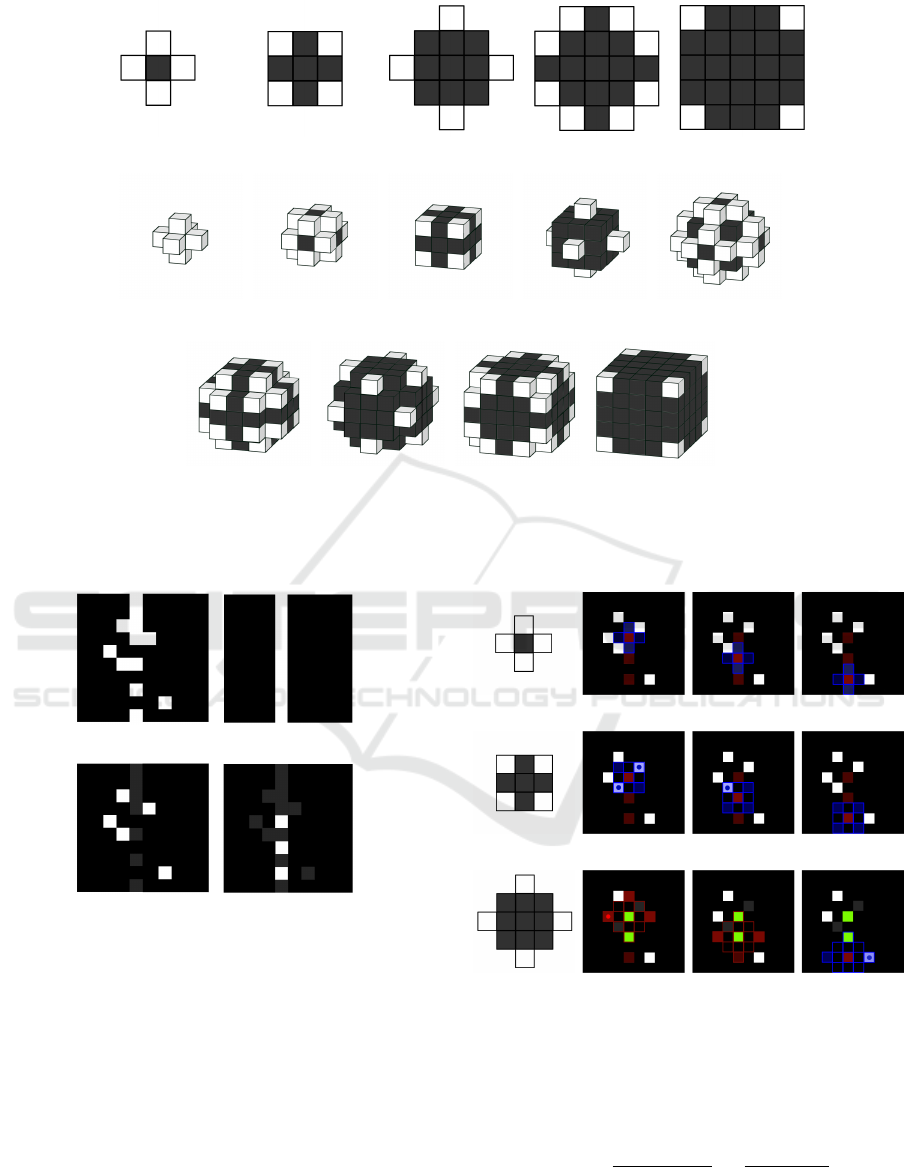
(a) 2-D Zone 1 (b) 2-D Zone 2 (c) 2-D Zone 3 (d) 2-D Zone 4 (e) 2-D Zone 5
(f) 3-D Zone 1 (g) 3-D Zone 2 (h) 3-D Zone 3 (i) 3-D Zone 4 (j) 3-D Zone 5
(k) 3-D Zone 6 (l) 3-D Zone 7 (m) 3-D Zone 8 (n) 3-D Zone 9
Figure 3: A set of 2-D and 3-D Zones for a T
match
value of 5. Each zone level possesses a cost function equal to the Euclidean
distance to the centre of the missing edge point (FN). Locations for each level are defined by a white box, while previously
evaluated levels are shaded grey. A local neighbourhood with a T
match
of 5 results in 5 Zones in 2-D and 9 zones in 3-D.
(a) Filter Result (b) Ground Truth
(c) Count and remove
TPs
(d) Locate FNs
Figure 4: (a) Ground truth solution. (b) 2-D filter result. (c)
Count and remove TPs. (d)Locate FNs.
To produce a performance score, a number of ap-
proaches can be taken. One method is to use the one-
to-one correspondence matching for ROC or PR anal-
ysis as outlined by Bowyer (Bowyer et al., 2001). Ad-
ditionally Liu and Haralick (Liu and Haralick, 2000)
made recommendations to use one-to-one correspon-
dence to produce a distance based metric, this can be
achieved by using the one-to-one distance cost func-
tion of the matches with the PFOM calculation 1)
(a) Zone 1 (b) FN 1 (c) FN 2 (d) FN 3
(e) Zone 2 (f) FN 1 (g) FN 2 (h) FN 3
(i) Zone 3 (j) FN 1 (k) FN 2 (l) FN 3
Figure 5: An example case of one to one correspondence
matching using a set of 2-D zones. Here each zone is signi-
fied by a blue grid, unmatched FNs are red, unmatched FPs
are white. While matched FNs are green and matched FPs
are shaded grey. (T
match
: 5×5).
FOM =
1
max(N
I
,N
B
)
N
B
∑
i=1
1
1 + α × d
2
i
(1)
Where N
I
are the number of points in the ground
truth and N
B
is the sum of TP and FP points in the
VISAPP 2020 - 15th International Conference on Computer Vision Theory and Applications
594
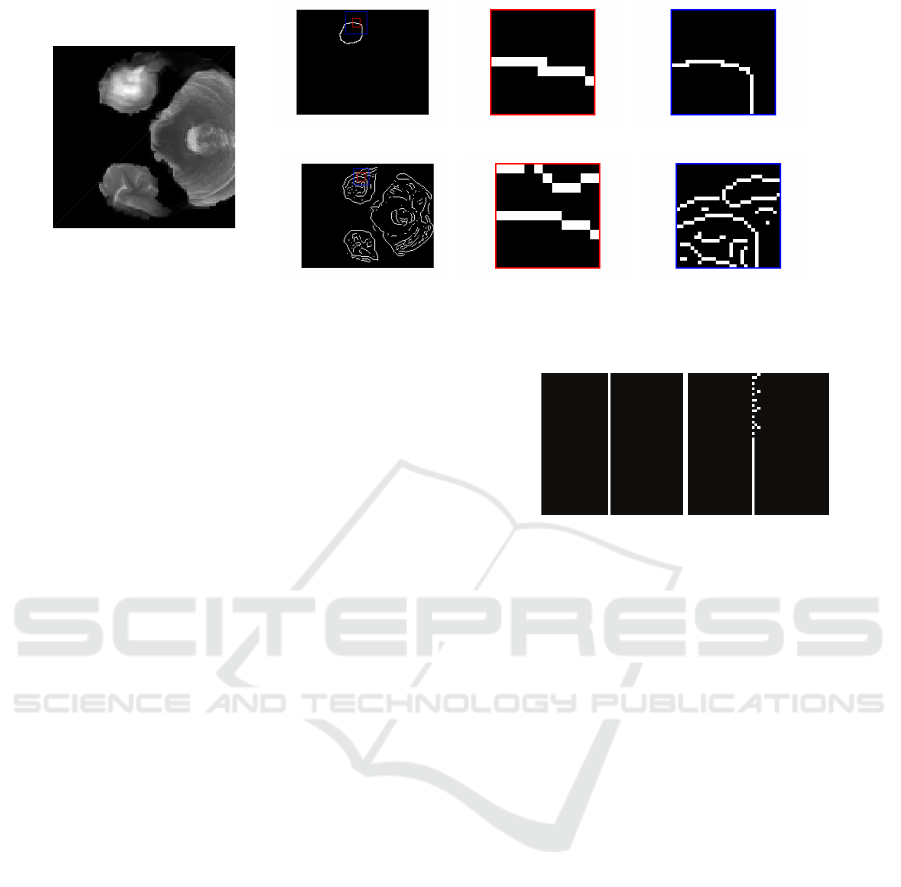
(a) MRI layer
(b) Ground Truth (GT) (c) GT sub-image (11×11) (d) GT sub-image (29×29)
(e) Test Image (f) Test sub-image (11×11) (g) Test sub-image (29×29)
Figure 6: Example cases for analysis at different sub-image scales.
result image. d
i
is the distance cost function of one
to one correspondence matches. While α is a calibra-
tion constant set at α = 1/9, a value established by
Pratt (Abdou and Pratt, 1979).
4 COMPARISON OF
PERFORMANCE METRICS
Different performance measures can possess different
performance characterisation. In terms of one to one
correspondence between reference and result image,
the Hungarian algorithm is considered optimal since
it solves the assignment problem with the smallest ag-
gregate cost function. Thus the accuracy of alternate
sub-optimal methods for one to one correspondence
require direct comparison against the Hungarian algo-
rithm. The EPS method of performance measure pre-
sented in this work is measured for accuracy against a
metric score obtained using Hungarian algorithm to
solve the assignment problem in a series of exam-
ple cases for obtaining one to one correspondence.
In addition, the CSA assignment method of Goldberg
(Goldberg and Kennedy, 1995), and the Closest Dis-
tance Match method are also assessed for comparison.
The commonly applied non-correspondence Pratt fig-
ure of merit metric is also included.
In order to assess the accuracy of the measures,
the performance evaluation algorithms were applied
to a series of 2-D sub-images and compared against
a ground truth solution. The sub-images are re-
gions selected from the binary outputs of edge fil-
ters (Williams et al., 2014; Smith and Williams, 2015)
from a set of 5 MRI image volumes. The region lo-
cations are derived from the positions of edge points
in the ground truth solutions provided in the BRATS
data sets (et al., 2015). The sub-image sizes range
from 11×11 and increase in odd increments through
(a) 51×51 Ground Truth (b) 51×51 Test Image
Figure 7: Performance scores, visual example with frag-
mented edge. Hungarian 0.8308. CSA 0.7811, EPS 0.8308,
CDM 0.8950, PFOM 0.9014.
to 29×29, and are neighbourhoods surrounding a
ground truth edge point located at the sub-image cen-
tre. An example is shown in Fig 6. For each sub-
image size, 12424 sub-images were used for a total of
124240 images, one for each ground truth edge point
across the data sets. The performance measure scores
are measured for accuracy against the optimal Hun-
garian algorithm using Pearson’s pairwise correlation,
the results of which are presented in table 1.
The results of the comparison show that the pre-
sented EPS is strongly correlated to the Hungarian
algorithm solution over a range of different sub im-
age sizes with a coefficient of 0.99. The CSA method
is also strongly correlated to the Hungarian solution
achieving coefficient scores ranging from 0.99-1.00.
This indicates that for optimal paring the CSA or EPS
method are highly preferred over the other methods,
offering greater accuracy, and therefore greater reli-
ability when compared against the CDM and PFOM
methods,
4.1 Time Analysis
An analysis of computational efficiency through tim-
ing the algorithms was undertaken both in 2-D and 3-
D. The procedure for measuring the efficiency of the
methods required running the performance measures
Efficient One-to-One Pair Matching for 2-D and 3-D Edge Detection Evaluation
595
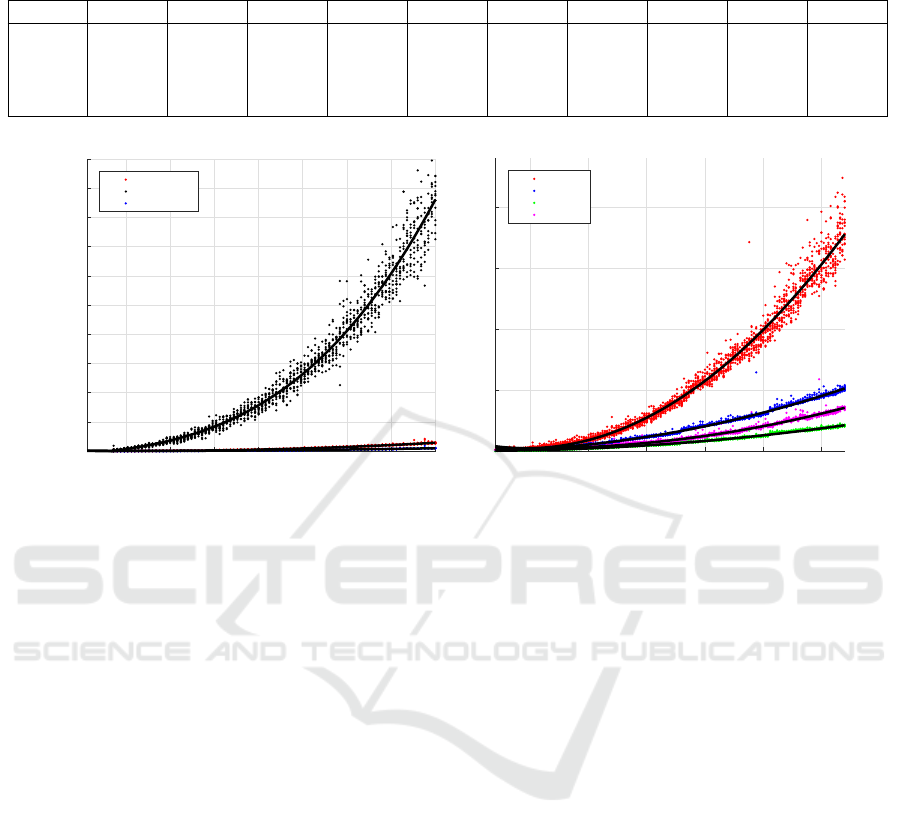
Table 1: Pearson Pairwise Correlation between optimal Hungarian method and other sub-optimal methods. 11503 example
images at odd sub-image sizes from 11×11 to 29×29. Pvals for all results were 0.
Metric 11×11 13×13 15×15 17×17 19×19 21×21 23×23 25×25 27×27 29×29
EPS 0.99 0.99 0.99 0.99 0.99 0.99 0.99 0.99 0.99 0.99
CSA 0.99 1.00 1.00 1.00 1.00 1.00 1.00 1.00 1.00 1.00
CDM 0.86 0.91 0.94 0.95 0.96 0.97 0.97 0.97 0.97 0.97
PFOM 0.80 0.87 0.91 0.93 0.95 0.96 0.96 0.97 0.97 0.97
50 100 150 200 250 300 350 400
Number of matched edge points
0
0.2
0.4
0.6
0.8
1
1.2
1.4
1.6
1.8
2
Avg computation time (s)
2-D Performance Evaluation time
CSA
Hungarian
EPS
(a) 2-D Hungarian v Alternatives
100 200 300 400 500 600
Number of matched edge points
0
0.05
0.1
0.15
0.2
Avg computation time (s)
2-D Performance Evaluation time
CSA
EPS
CDM
PFOM
(b) 2-D Alternatives
Figure 8: (a) Computational time analysis of 2-D performance measures, including Hungarian (Kuhn, 1955), CSA (Goldberg
and Kennedy, 1995) and the proposed EPS method. (b) Computational time analysis of alternative performance measures,
including CSA, EPS, CDM and PFOM.
on images of increasing complexity. Complexity was
increased by increasing the number of potential cor-
respondences in each case. For this test, the number
of edge points in the ideal image was made to pre-
cisely match the number of edge points in the result
image to ensure conditions which allow for one to one
correspondence of all edge points. The edge pixels in
the test images were pseudo randomly generated such
that declared edge pixels were located within the tol-
erance zone (T
match
) of an ideal edge (Fig. 10. Here
T
match
was set to accommodate a 5×5 window around
the ideal points. The same experiment was repeated
using 3-D one to one correspondence measures and
3-D image volumes. Here T
match
was set to accom-
modate a 5×5×5 neighbourhood. Complexity was
again increased by increasing the number of potential
correspondence matches.
The performance measures were compared first in
2-D against the Hungarian(Kuhn, 1955) Munkres al-
gorithm. The results are shown in Fig 8a), here it
can be seen that for 2-D performance measures, as
the complexity of the analysis increases through in-
creasing the number of correspondences, the Munkres
Hungarian completion time increases exponentially
and is slower than than the CSA and EPS methods.
2-D analysis indicates that the fastest method is the
PFOM and the CDM method was the most efficient
of the one-to-one correspondence methods (Fig 8b)
however, the more accurate EPS method offered sim-
ilar linear computational efficiency in 2-D. The ac-
curate CSA assignment method finishes in a time we
believe to be adequate for 2-D performance evalua-
tion. However, in the case of the CSA assignment
method the additional computational complexity in-
troduced by 3-D data and surface information, leads
to a significant increase in computational time for 3-D
performance evaluation, when compared against the
EPS method (Fig 9a). For surface evaluation in 3-D,
using the CSA algorithm for correspondence match-
ing becomes impractical as the number potential cor-
respondences increases.
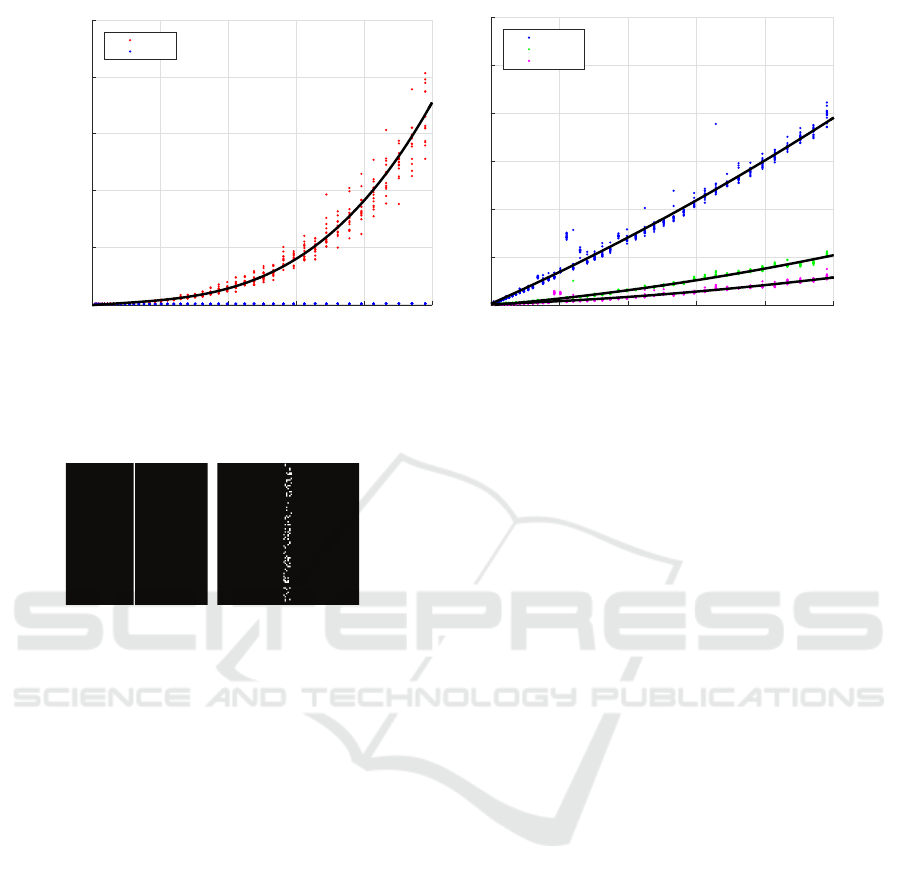
While the CSA method achieves exponential time
complexity in relation to the number of potential cor-
respondences (Fig 9a), Fig 9b shows that that in the
context of 3-D, the time complexity of the problem re-
mains linear for the EPS, CDM and PFOM methods.
The EPS method offers similar accuracy to the CSA
and Hungarian method, while maintaining the com-
putational efficiency similar to that of the sub-optimal
CDM and PFOM methods.
VISAPP 2020 - 15th International Conference on Computer Vision Theory and Applications
596
0 2000 4000 6000 8000 10000
Number of matched edge points
0
50
100
150
200
250
Computation time (s)
3-D Performance Evaluation time
CSA
EPS
(a) 3-D CSA v EPS
0 2000 4000 6000 8000 10000
Number of matched edge points
0
0.1
0.2
0.3
0.4
0.5
0.6
Computation time (s)
3-D Performance Evaluation time
EPS
CDM
PFOM
(b) 3-D EPS v linear time methods
Figure 9: (a) Computational time analysis of optimal 3-D performance measures, CSA (Goldberg and Kennedy, 1995) and
the proposed EPS method. Allowance 0. (b) Computational time analysis of fast sub-optimal 3-D performance measures,
including EPS, CDM and PFOM.
(a) Ground Truth Exam-
ple
(b) Test Image Example
Figure 10: Example of test images and ground truth images
for time analysis with 100 potential correspondences. Edge
points are created within T
match
neighbourhood such that the
number of edge points in both ground truth and test image
are equal in order to allow for correspondence matching of
all points.
5 CONCLUSIONS
This paper presented a novel method for efficient
one-to-one correspondence matching for 2-D and 3-
D edge performance evaluation. The Efficient Pair-
ing Strategy offers increased accuracy over exist-
ing performance methods, notably the commonly ap-
plied one to many correspondence PFOM technique,
and reliably presents an objective measure that more
closely reflects the visual image results by adequately
penalising fragmented edges and surfaces (Fig. 7. The
EPS results are shown to be consistently accurate,
with a 0.99 Pearson correlation against test assign-
ment cases solved by the Hungarian algorithm, im-
proving over the existing CDM and PFOM methods
for one to one correspondence matching (Table 1).
Furthermore the EPS method was shown to provide
results comparable to the Hungarian and CSA meth-
ods in terms of accuracy of correspondence match-
ing with less computational cost. Finally, it should be
noted that the EPS in this form does not offer a gen-
eral solution for the assignment problem. However,
the EPS does provide a fast and accurate alternative
to the Hungarian and CSA algorithms in the context
of performance evaluation for edge and surface de-
tection, finally allowing for practical fast one to one
correspondence matching which is suitable for large
2-D image data sets and 3-D data.
REFERENCES
Abdou, I. E. and Pratt, W. K. (1979). Quantitative design
and evaluation of enhancement/thresholding edge de-
tectors. Proceedings of the IEEE, 67(5):753–763.
Bowyer, K., Kranenburg, C., and Dougherty, S. (2001).
Edge Detector Evaluation Using Empirical ROC
Curves. Computer Vision and Image Understanding,
84(1):77–103.
Canny, J. (1986). A Computational Approach to Edge De-
tection. IEEE Transactions on Pattern Analysis and
Machine Intelligence, PAMI-8(6):679–698.
et al., B. H. M. (2015). The multimodal brain tumor image
segmentation benchmark (brats). IEEE Transactions
on Medical Imaging, 34(10):1993–2024.
Forbes, L. A. and Draper, B. A. (2000). Inconsistencies in
edge detector evaluation. In Proceedings IEEE Con-
ference on Computer Vision and Pattern Recognition.
CVPR 2000, volume 2, pages 398–404.
Goldberg, A. V. and Kennedy, R. (1995). An efficient cost
scaling algorithm for the assignment problem. Math-
ematical Programming, 71(2):153–177.
Heath, M., Sarkar, S., Sanocki, T., and Bowyer, K. (1996).
Comparison of edge detectors: a methodology and
Efficient One-to-One Pair Matching for 2-D and 3-D Edge Detection Evaluation
597

initial study. In Proceedings CVPR IEEE Computer
Society Conference on Computer Vision and Pattern
Recognition, pages 143–148.
Kitchen, L. and Rosenfeld, A. (1981). Edge Evaluation us-
ing Local Edge Coherence. IEEE Transactions on
Systems, Man , And Cybernetics, SMC-11(9):597–
605.
Kuhn, H. W. (1955). The hungarian method for the assign-
ment problem. Naval Research Logistics Quarterly,
2:83–97.
Liu, G. and Haralick, R. M. (2000). Assignment problem in
edge detection performance evaluation. In Proceed-
ings IEEE Conference on Computer Vision and Pat-
tern Recognition. CVPR 2000, volume 1, pages 26–
31.
Liu, G. and Haralick, R. M. (2002). Optimal matching prob-
lem in detection and recognition performance evalua-
tion. Pattern Recognition, 35(10):2125–2139.
Lopez-Molina, C., De Baets, B., and Bustince, H. (2013).
Quantitative error measures for edge detection. Pat-
tern Recognition, 46(4):1125–1139.
Martin, D. R. (2003). An Empirical Approach to Grouping
and Segmentation. PhD thesis, University of Califor-
nia.
Martin, D. R., Fowlkes, C. C., and Malik, J. (2004). Learn-
ing to detect natural image boundaries using local
brightness, color, and texture cues. IEEE transac-
tions on pattern analysis and machine intelligence,
26(5):530–49.
Meil
˘
a, M. (2005). Comparing clusterings: an axiomatic
view. In In ICML ’05: Proceedings of the 22nd inter-
national conference on Machine learning, pages 577–
584. ACM Press.
Nercessian, S., Panetta, K., and Agaian, S. (2009). A non-
reference measure for objective edge map evaluation.
Number October, pages 4563–4568.
Prieto, M. and Allen, A. (2003). A similarity metric for
edge images. IEEE Transactions on Pattern Analysis
and Machine Intelligence, 25(10):1265–1273.
Savitzky, A. and Golay, M. J. E. (1964). Smoothing and
differentiation of data by simplified least squares pro-
cedures. Analytical Chemistry, 36(8):1627–1639.
Smith, S. and Williams, I. (2015). A statistical method for
improved 3d surface detection. IEEE Signal Process-
ing Letters, 22(8):1045–1049.
Williams, I., Bowring, N., and Svoboda, D. (2014). A per-
formance evaluation of statistical tests for edge detec-
tion in textured images. Computer Vision and Image
Understanding, 122:115 – 130.
Williams, I., Svoboda, D., Bowring, N., and Guest,
E. (2008). Statistical edge detection of concealed
weapons using artificial neural networks. In Im-
age Processing: Algorithms and Systems VI, volume
6812.
Zhu, Q. (1996). Efficient evaluations of edge connectivity
and width uniformity. Image and Vision Computing,
14(1):21–34.
VISAPP 2020 - 15th International Conference on Computer Vision Theory and Applications
598
