
In Situ Visual Quality Control in 3D Printing
Charalampos Kopsacheilis
a
, Paschalis Charalampous
b
,Ioannis Kostavelis
c
and Dimitrios Tzovaras
d
Centre for Research and Technology, Hellas, Information Technologies Institute (CERTH/ITI),
6th Km Charilaou-Thermi Road, Thessaloniki, 57001, Greece
Keywords: 3D Printing, Additive Manufacturing, Quality Control, Optical Monitoring, Image Processing.
Abstract: In the past decade, additive manufacturing technology has gained an immense attention in numerous research
areas and has already been adopted in a wide range of industries relevant to transportation, healthcare,
electronics and energy. However, the presence of defects and dimensional deviations that occur during the
process hinder the broad exploitation of 3D printing. In order to enhance the capabilities of this emerging
technology, online quality control methodologies and verifications of the manufacturing process are necessary
to be developed. In the present article, a low cost in-situ vision-based monitoring technique applied in Fused
Deposition Modeling (FDM) 3D printing technology is introduced. An optical scanning system was integrated
in a commercial 3D Printer in order to scan and validate the performance of the procedure. The proposed
methodology monitors the FDM process and correlates the theoretical 3D model with the manufactured one.
This technique can be utilized in various additive manufacturing technologies providing integrity and
reliability of the process, high quality standards and reduced production costs.
1 INTRODUCTION
Additive Manufacturing (AM), which is known to the
public as three-dimensional (3D) printing, is a
manufacturing process where the product is built
incrementally and vertically to the build platform of
the 3D printer, i.e. layer-by-layer (Gibson, 2014).
Industries around the world utilize AM in order to
decrease the cost of parts manufacturing and reduce
the time-to-market. Products created using AM
procedures have the potential to possess complex
geometric characteristics and lightweight structure,
challenges which are difficult be to addressed via
traditional subtractive manufacturing procedures like
turning and milling. 3D printing has undergone a
rapid growth and there are various AM processes
based on different physical principles (e.g. material
extrusion, photopolymerization, sintering, material
jetting, etc.) which are now available and allow the
manufacturing industry to reduce lead times on the
production. Depending on the applied AM
a
https://orcid.org/0000-0003-0509-618X
b
https://orcid.org/0000-0002-9399-4387
c
https://orcid.org/0000-0003-2882-2914
d
https://orcid.org/0000-0001-6915-6722
technology, there is a wide range of materials which
can be used such as plastics, ceramics and metals.
From an application perspective, polymer-based AM
methods are employed in various scientific fields like
automotive engineering, medical and bioengineering.
The most popular and rapidly-growing AM process
using polymers as feedstock material is the extrusion
based deposition process known as Fused Deposition
Modeling (FDM). FDM is an AM technology
representing the largest installed base of 3D printers
in the world and is primary used for modelling,
production and rapid prototyping. The
abovementioned process a continuous filament of a
thermoplastic material through a moving, heated
extrusion print head. Once the nozzle of the print head
has reached the desired temperature, the feedstock
material is fed to the print head where it melts locally.
The print head is connected with a computer
numerical control system that allows it to move in two
dimensions (on the horizontal plane), one layer at a
time, depositing the feedstock material in
Kopsacheilis, C., Charalampous, P., Kostavelis, I. and Tzovaras, D.
In Situ Visual Quality Control in 3D Printing.
DOI: 10.5220/0009329803170324
In Proceedings of the 15th International Joint Conference on Computer Vision, Imaging and Computer Graphics Theory and Applications (VISIGRAPP 2020) - Volume 3: IVAPP, pages
317-324
ISBN: 978-989-758-402-2; ISSN: 2184-4321
Copyright
c
2022 by SCITEPRESS – Science and Technology Publications, Lda. All rights reserved
317
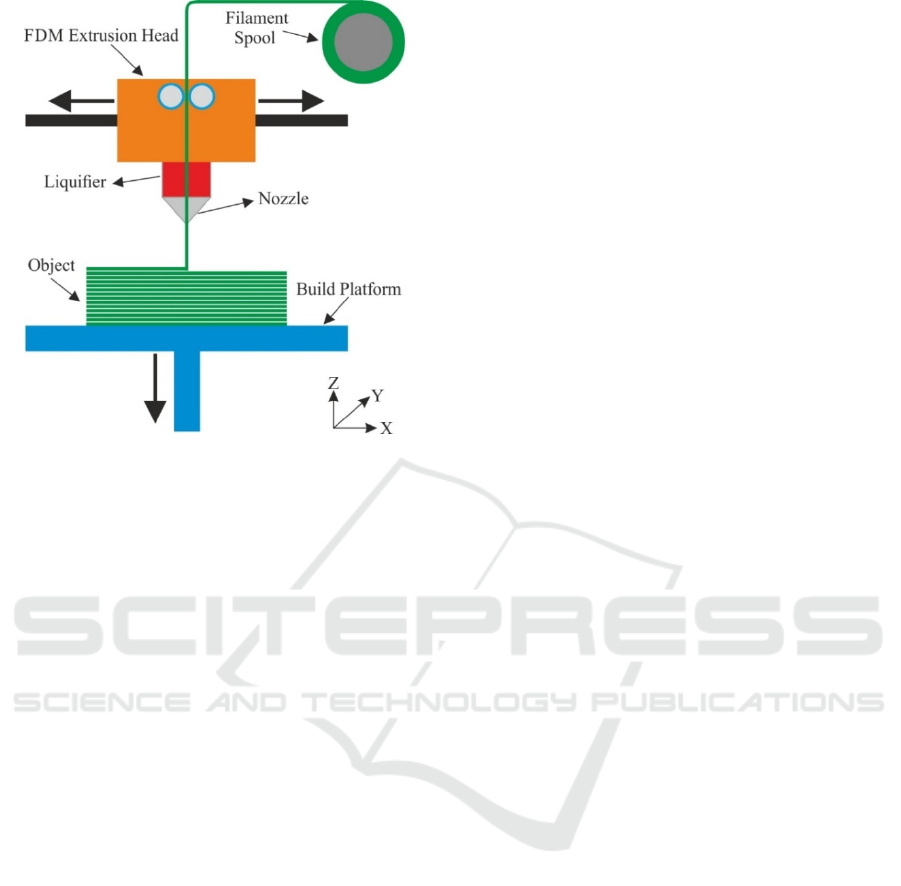
Figure 1: Principal of FDM process.
predetermined locations as illustrated schematically
in Figure
1. The deposited melted material on the
build platform cools and solidifies immediately after
its extrusion from the print head’s nozzle. When the
layer is fully created, the build platform moves
vertically down and a new layer is deposited. This
procedure is repeated until the 3D geometry of the
product has been printed.
In general, the quality of a product manufactured
via the FDM procedure can be characterized by
various aspects, such as dimensional accuracy,
surface quality, mechanical properties and
conformance to specifications. More specifically, the
geometrical accuracy of the physical printed model
consists one of the biggest concerns in AM and the
utilization of non-destructive quality control methods
constitutes a must in order to exploit the full
capabilities of this state of the art technology
(Dimitrov, 2006). In the scope of optimizing the FDM
process via the reduction of dimensional deviations
between the theoretical and the printed product,
online monitoring of the procedure is considered to
be mandatory. Real time monitoring of the AM
procedure composes an essential phase but is
frequently neglected; hence dimensional deviations
from the printed model are unknown until the end of
the process. Additionally, in situ visual monitoring of
the 3D printing process could reduce material
resources and production time, as the manufacturing
process can be aborted if an error is detected.
Therefore, semi-built parts which do not comply with
the technical standards of the product can be
interrupted prior to the prescribed process
termination. Optical methods are appropriate for low
cost, non-destructive and high resolution monitoring
of AM procedures (Nuchitprasitchai, 2017).
Moreover, monitoring of the manufacturing process
could aid in predicting the performance of the
operation and detecting possible failures beforehand.
The objective of the present work is to investigate
and develop real-time optical monitoring techniques
during the FDM process in order to perform in situ
non-destructive quality control. Hereupon, an
integration of an optical scanning system on a
commercial FDM 3D printer has been established in
order to exhibit real time monitoring of the AM
process. The rest of the paper is organized as follows:
Section 2 outlines the existing monitoring and error
detection methods utilized in AM technology and
more specifically in FDM procedures. Next in
Section 3, the applied experimental setup and the pre-
processing data of the employed methodology are
discussed, while Section 4 explicitly presents the
experimental assessment of the introduced optical
monitoring technique. Finally, conclusions and future
work are drawn in Section 5.
2 LITERATURE REVIEW
Taking into account the fact that 3D printing is a
relatively new manufacturing technology, the
research on available real time monitoring systems of
extrusion based AM processes is currently limited.
Up to now, commercial FDM 3D printers have
developed and integrated some types of sensor
solutions detecting lack of the feedstock material or
malefactions on the nozzle. However, these methods
investigate only a single form of a failure mechanism.
In order to develop a fully functional monitoring
system, which can be applied for real time error
detection, more sophisticated methodologies have to
be developed. Recent studies with applications in
online monitoring of the FDM 3D printing process
are documented in the next paragraphs.
An in situ monitoring method for evaluating the
surface quality of parts manufactured via a FDM 3D
printer was developed in (Fang, 2003). Grayscale
images of the deposited layers were captured and
analyzed during the process. Alterations in the
grayscale values on the deposited surfaces allowed
the detection of overfills and underfills of the printed
parts. The authors in (Dinwiddie, 2013) utilized an
extended range IR camera in order to measure the
developed temperatures during the process
correlating their effect on the mechanical properties
and the quality of parts manufactured through a FDM
IVAPP 2020 - 11th International Conference on Information Visualization Theory and Applications
318

3D printer. The authors in (Faes, 2014) a modular 2D
laser triangulation scanner has been utilized in order
to analyze feedback signals during the process and to
identify the source of the printing errors. Moreover,
in the work presented in (Holzmond, 2017) the
utilization of a three-dimensional digital image
correlation (3D-DIC) system as an online
measurement method has been introduced, in order to
monitor and quantify the quality of the printed part
surface. In particular, stereoscopic images were
captured and spatially correlated using 3D Digital
Image Correlation in order to extract the surface
characteristics and produce the 3D geometry of the
part during the process.
The authors in (Straub, 2015) developed a
technique to detect failure defects during the 3D
printing manufacturing procedure. In this study, the
evaluation of the product quality was accomplished
via a multi-camera system consisted of five monitor
features (each feature consisted of a Raspberry Pi
camera) and image processing analysis using Dot Net
framework and C#. Images were captured during the
process from eight predefined locations by each of the
five cameras located at five different angles in order
to compare the results with the final 3D printed part.
The correlation was performed on a pixel-wise
manner. The types of the failures which can be
detected using this experimental procedure are either
an early termination of the process resulting to an
incomplete product or a failure on the injection of the
filament into the printer’s nozzle. The proposed
technique cannot evaluate geometrical characteristics
or structural defects, which are the most common
errors in FDM process. However, in (Malik, 2019) a
3D reconstruction method was introduced requiring
only one camera integrated on the top of the build
platform avoiding the need for moving the camera
around the printed part or employing multiple static
cameras. Moreover, the isolation of the printed part
was feasible by cropping the background and the
unwanted information from the acquired images. The
3D model is reconstructed layer by layer; hence an
online monitoring and error detection technique was
developed. Finally, Augmented Reality (AR)
methods were used to evaluate the procedure utilizing
the reconstructed 3D model of the printed product.
Recently, image-sensing systems combined with
Artificial Intelligence (AI) algorithms have been
reported for the characterization and the
quantification of the geometric accuracy of 3D
printed parts. The authors in (Delli, 2018) presented
an in process quality control methodology for an
FDM 3D printer utilizing the supervised machine
learning algorithm support vector machine (SVM)
and a single camera. In this work, the state of the
printing process was classified as ‘defective’ or
‘good’ employing the machine learning model and
the image captured during the building procedure.
3 EXPERIMENTAL METHOD
3.1 3D Printer Setup
The experimental setup utilized in this work
comprises the commercial 3D Printer ‘Ultimaker 3
Extended’, an ADXL345 accelerometer and the
RGB-Depth camera ‘Asus Xtion Pro Live’. The
Ultimaker 3 Extended applies the FDM 3D printing
technology process providing a maximum build
volume of (215x215x300) mm, a layer resolution
from 20 to 200 microns and a XYZ print accuracy of
(12.5, 12.5, 2.5) micrometers respectively. Polylactic
acid (PLA) was used as an eco-friendly feedstock
material in the experimental procedures. The process
parameters were selected as documented in Table 1
and remained constant throughout the courses of the
experiments. The accelerometer has been exploited in
order to send a signal to the optical monitoring system
during the FDM process for capturing images when
the print head reaches a checkpoint, as it will be
discussed in Section 3.2.
Table 1: 3D printing process parameters during the
experimental tests.
Process Parameters Value Units
Nozzle diameter 0.4 mm
Layer height 200 μm
Printing speed 70 mm/sec
Printing temperature 205 °C
Wall thickness 1 mm
Top thickness 1 mm
Bottom thickness 1 mm
Infill density 25 %
Infill pattern triangles
Build plate temperature 70 °C
Overhang angle 45 degree
The Asus Xtion Pro Live sensor provides color
images and Per-Pixel-Depth information. Depth data
of the scene are provided from the integrated IR depth
sensor of the camera and the RGB sensor implements
the colored image on the captured scene. After the
registration of these sources of data, an RGB image
of the scene along with a Per-Pixel-Depth information
is obtained. In the present article, only the depth
sensing capabilities of the camera will be exploited.
The 3D printed objects are monitored by capturing
images during the process with the aid of the above-
In Situ Visual Quality Control in 3D Printing
319
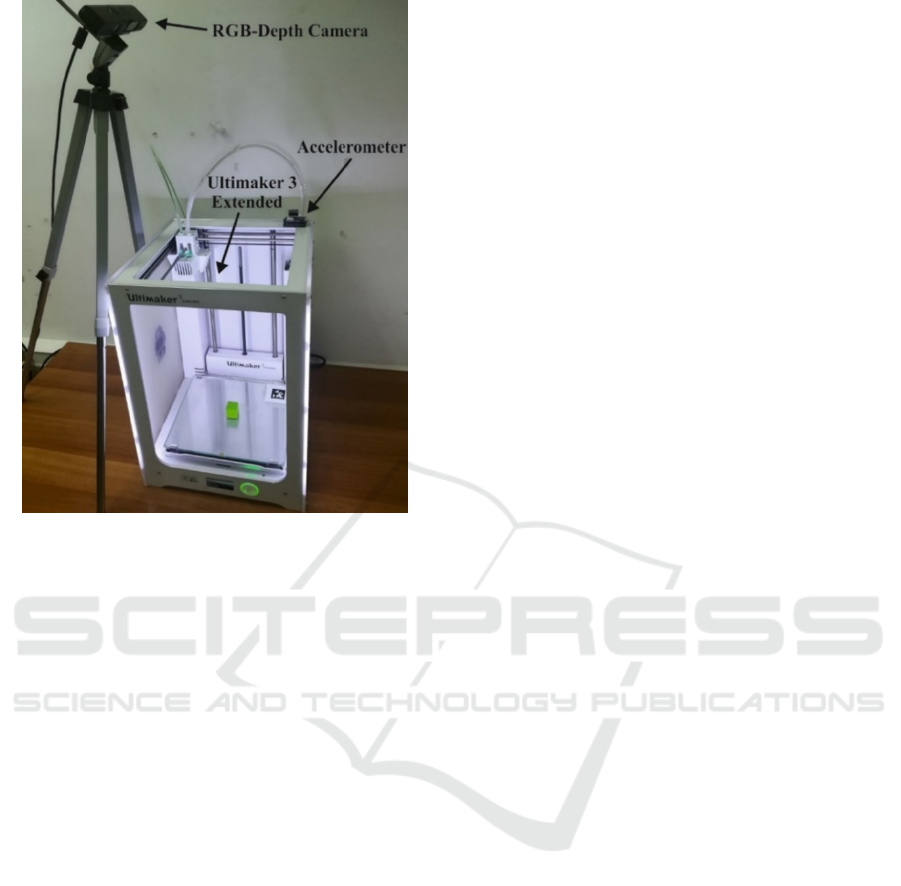
Figure 2: Experimental setup.
mentioned laboratory equipment, as shown in Fig. 2.
It has to be noted, that the proposed experimental
setup can easily be implemented in any type of 3D
Printer and several AM technologies. The developed
software was in C++, while also Point Cloud Library
(PCL) (Rusu, 2011) has been used to for handling the
3D points; developing thus a pipeline which
automates the in situ monitoring process of the FDM
3D printing procedure. Finally, taking into account
the effect of variation in lighting conditions,
numerous experiments in different light conditions
have been performed in order to capture images using
the RGB-D camera. Since the alterations in the
lighting conditions influence the quality of the image,
a constant lighting angle throughout the course of the
experimental procedures was kept facilitating image
analysis and comparison feasibility.
3.2 Data Pre-processing
One of the major advantages of AM is the ability to
create a complex physical object utilizing only a
digital 3D CAD (Computer Aided Design) model and
a 3D printer. The executable commands of the 3D
printer are derived from the digital 3D model and by
employing a software called slicer; machine
commands are generated representing the trajectories
of the print head (Gcode). Gcode is a machine code
which is utilized in various manufacturing
procedures, like CNC milling, turning and 3D
printing. These code structures contain the
instructions for the printer in order to control and
move its actuators, the build platform and the print
head, which extrudes the semi-molten feedstock
material. However, there is no control or guarantee
that the commands of the Gcode will be accurately
executed by the 3D printer resulting to inaccuracies
of the manufactured product. Dimensional deviations
of the physical printed part compared to the 3D CAD
model is hard to be detected during the FDM process
due to the fact that the printing object does not exhibit
any obvious defects and the manufacturing process is
successfully finished. This type of errors could occur
in case of malefactions of the 3D printer during the
process or in situations where the user applies
unsuitable printing conditions. Therefore, in order to
detect dimensional deviation errors, the physical
printed part has to be monitored and compared to the
theoretical model while the process is still ongoing.
In AM technologies and especially in FDM
procedures, the conversion of a CAD model into a
Standard Triangulation Language (STL) format is
necessary in order for the slicer software to generate
the Gcode for the manufacturing of the model
(Gibson, 2014). STL format contains data that
correspond to sets of surface normal vectors and
triangle vertices, hence STL describe only the
external surface geometry of the part without any
representation of the internal structure (lattice
structure) or the necessary support structures of the
printed part. In some AM processes, like FDM, the
physical objects are not printed as solids due to the
high amount of the required feedstock material and
the total duration of the procedure. The lattice
structure (filling pattern) is the internal structure of a
part created using the FDM technology. Additionally,
as FDM 3D printing models are constructed layer by
layer, a previous layer is necessary to build upon it.
Hereupon, depending on the complexity of the 3D
model and the overhang angle of the new layer
compared to the previous one, support structures may
be required (Volpato, 2014). These types of structures
are exhibited in Fig. 3. For this reason, the
comparison between the STL data and the printed part
is not directly applicable, since the STL format does
not contain information regarding the
abovementioned structures.
In order to overcome such issues, a more holistic
approach had to be developed. The employed
methodology for the reconstruction of the digital
model taking into account the internal and the support
structures is presented schematically in Fig. 4. The
proposed method is based on the generated Gcode
IVAPP 2020 - 11th International Conference on Information Visualization Theory and Applications
320
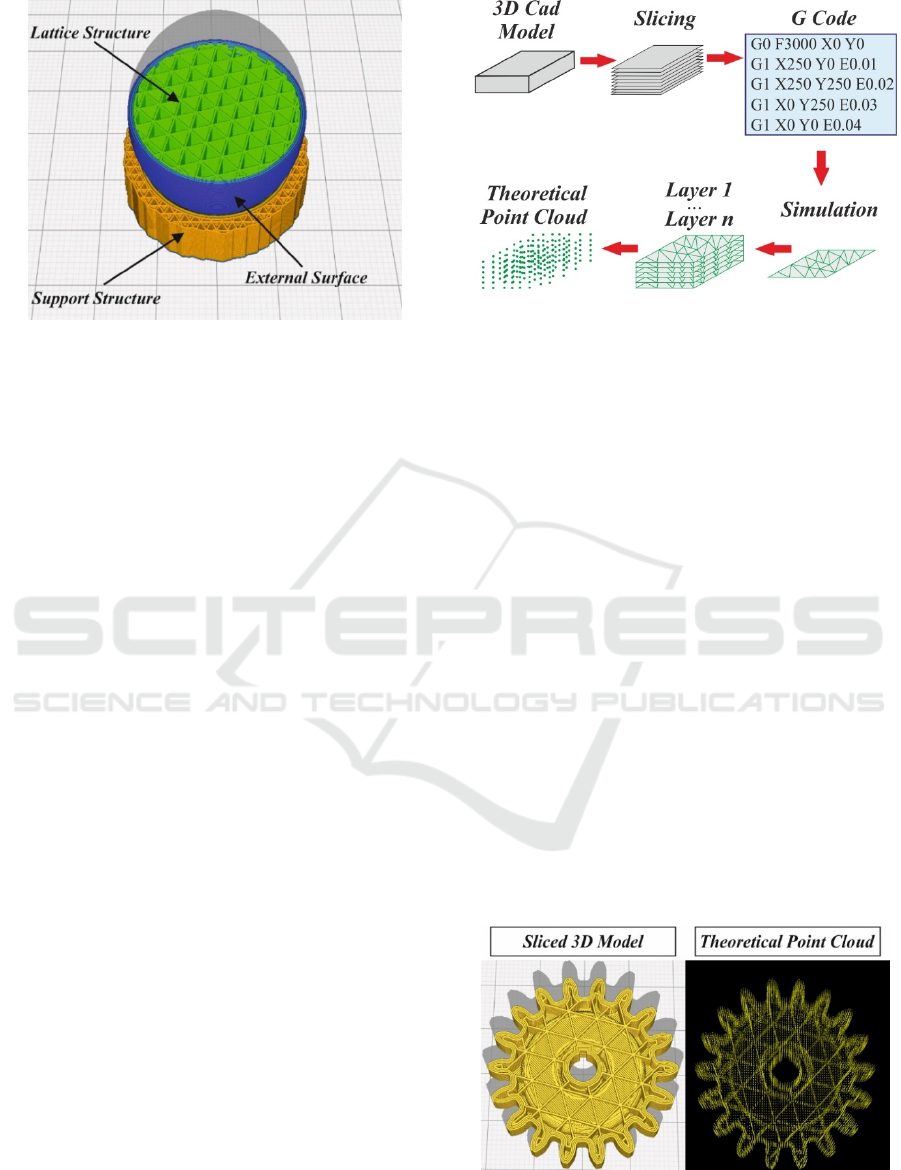
Figure 3: Lattice and support structures in FDM process.
from the slicer software and simulates the exact
movements of the print head in order to create the
theoretical point cloud of the digital 3D model. In the
first step, the 3D CAD model is imported on the
CuraEngine, which is a fast and robust engine for
translating 3D models into 3D printing commands
(Kocisko, 2017). The outcome of this step is the
Gcode that contains certain instructions about the
X,Y and Z coordinates to which the print head and the
build platform have to move in order to build the 3D
model. In the next stage, a simulation of the 3D
printing process utilizing the Gcode takes place. The
generated Gcode has been further processed using a
modified version of gcode2vtk (Kubicek, 2011),
emulating the functionality of the 3D printer by
parsing the Gcode to extract the planar-layered
trajectories of the print head. In the next phase, a
structure containing every path of the 3D printer is
created. It has to be noted that only the Gcode
commands, which contain information about the
extruded material and the movements of the print
head (that ultimately builds the physical model) are
taken into consideration. Finally, these trajectories
are uniformly sampled generating a theoretical point
cloud of the 3D model. An example of the developed
technique is illustrated in Fig
. 5, where a 3D model
created in the slicer software and the corresponding
theoretical point cloud are displayed.
In the last step of the preprocessing data module,
some further parameters are passed to the 3D Printer.
The print head has to move to the zero position (X=0
and Y=0) of the 3D printer in order for the monitoring
system to capture a clear image of the printed part
during the FDM process. That was accomplished
through the modification of the Gcode sending the
print head in the zero position of the 3D printer every
‘n’ deposited layers and with an accelerometer placed
upon the 3D printer. In more detail, during the AM
Figure 4: Theoretical point cloud reconstruction.
process the print head commanded to move towards
the zero position and pauses for time t
w
. During t
w
, the
accelerometer sends a signal to the monitoring system
in order to capture an image of the printed part, which
is clearly visible by the RGB-D sensor, without the
printing head to occlude the visibility of the building
plate. After this operation, the printing head moves
back to its previous position and re-initializes the
printing process again. In this way, the real-time point
cloud from the printed part is captured during the
FDM process; hence the monitoring of the process
and the correlation with the theoretical point cloud is
feasible.
4 EXPERIMENTAL
ASSESSMENT
In this section, the experimental assessment of the
present work is presented. The experimental
procedure has been conducted on a 3D printed part
which has been exploited as a test specimen of basic
geometry, namely a spur gear, utilizing PLA filament
of 2.85 mm diameter (see Fig.5).
Figure 5: Sliced 3D model and the corresponding
theoretical point cloud.
In Situ Visual Quality Control in 3D Printing
321
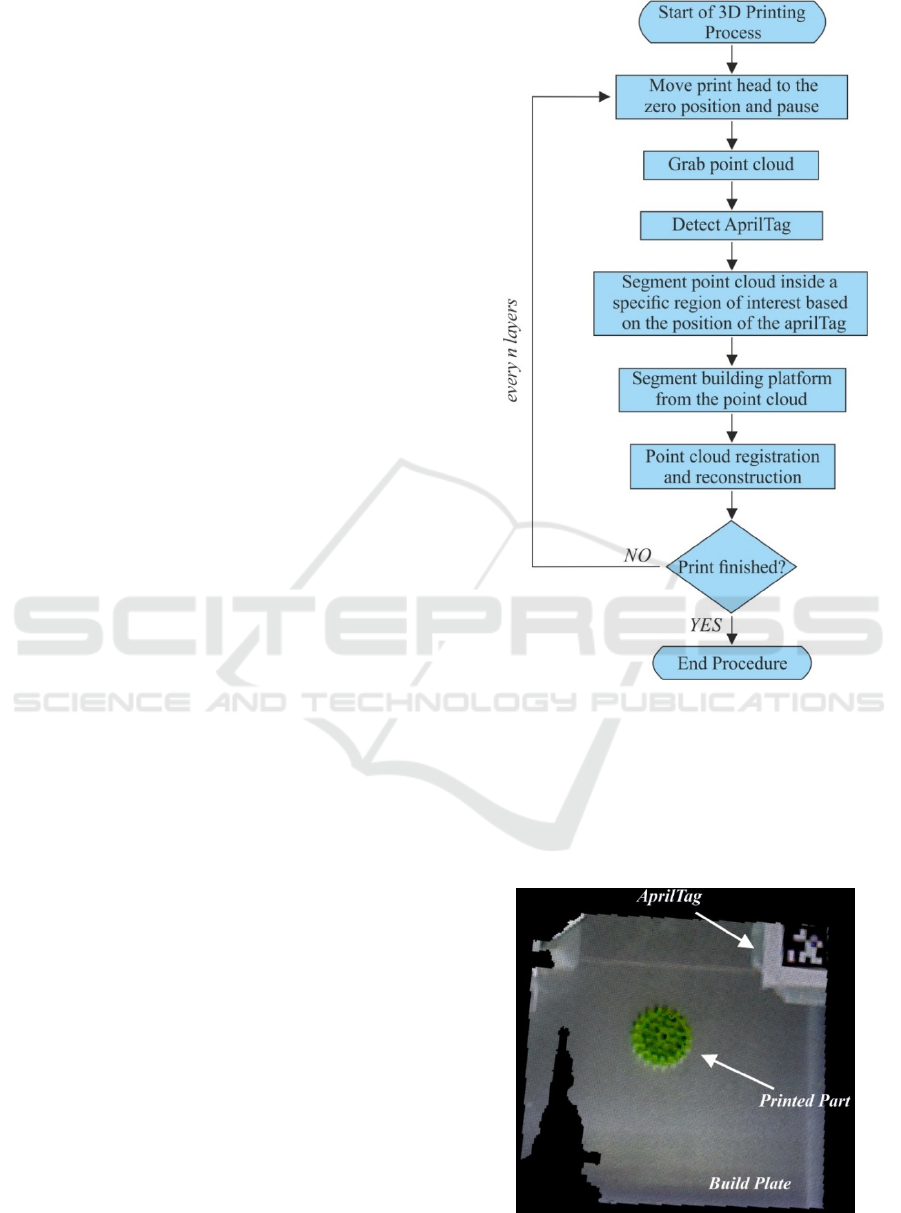
Figure 6 demonstrates a brief overview of the
applied optical monitoring process. As it was
described in the previous section, the print head
moves to the zero position of the 3D printer every ‘N’
layers, so the employed camera can capture a clear
point cloud of the printed part during the FDM
procedure. Due to the low resolution and broad field
of view of the acquired point cloud by the Asus Xtion
sensor, a fiducial marker was used to filter out the
background and determine the area of interest to crop.
The AprilTag visual fiducial system has been applied,
which is widely used for a variety of tasks including
augmented reality, robotics and camera calibration
(Olson, 2011). Targets can be printed in any size on a
simple piece of paper, thus allowing a low cost and
accessible integration of the marker with the
employed experimental setup. By placing a small
AprilTag on the build platform of the 3D printer, the
calculation of an orthogonal region of interest and
filtering out any outliers from the initial point cloud
is accomplished. The orthogonal region consists of
the build platform, the AprilTag and the 3D printed
model as shown in Fig. 7. This technique allows a fast
filtering of the noise; hence focus on a small region
of interest where the model is printed was ultimately
achieved.
Once the original point cloud has been cropped
down to the region of interest, consisting of the
printed part, build platform and AprilTag, the next
step comprises their separation acquiring only the
printed layer in order to reconstruct the model and
evaluate its quality. This issue boils down to a plane
detection and segmentation problem. There is a
variety of methods targeting towards plane
segmentation of 3D point cloud data in literature.
Ransac algorithm has been selected and applied in the
present study, which is easily implemented in PCL
providing accurate results. Ransac is relatively slow
when provided with big data sets, however the crop
of the original point cloud reduced the overall size
heavily and thus applying it did not influence the
performance of the introduced optical monitoring
system. Using the algorithm on the cropped point
cloud resulted in a fairly accurate segmentation of the
build platform, although there were still some areas
with a small concentration of outlier points (namely
the area where the AprilTag was placed upon) as
exhibited in the left part of Fig. 8. In order to tackle
this issue, a technique has been developed in
accordance to which a point cloud representation is
obtained that retain only the inlier points belonging to
the constructed model, excluding thus the outliers.
Increasing the distance threshold, which Ransac
applies to extract the points on the detected plane,
Figure 6: Flowchart of the monitoring procedure.
resulted in segmenting away points originally
belonging on the printed model. The issue has been
solved by applying a distance–based clustering
algorithm to the remaining point cloud and
segmenting the biggest cluster, which resulted in a
point cloud consisting only from points belonging to
Figure 7: Region of interest.
IVAPP 2020 - 11th International Conference on Information Visualization Theory and Applications
322
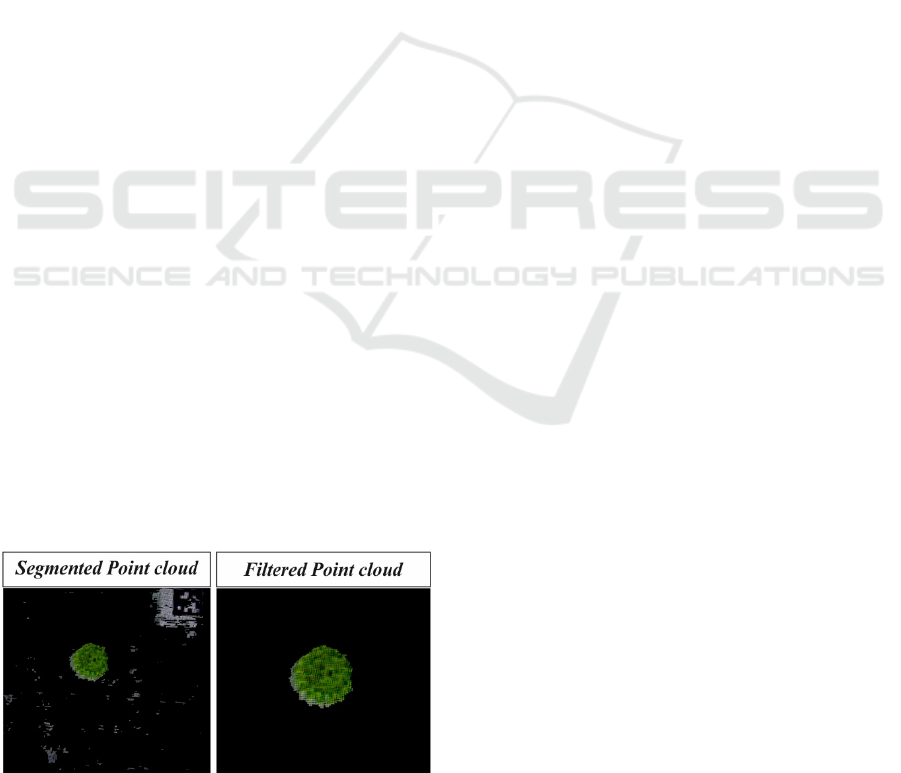
the printed layer of the part. To this end, a Euclidean
distance clustering algorithm has been utilized which
clusters the remaining points based on the 3D
Euclidean distance from their neighbors. Due to the
sparsity of the outlier points, clustering the point
cloud using distance between points as a metric
leaded in a successfully filtering of the printed model
as exhibited in the right part of Fig. 8.
Having successfully implemented a method for
locating and segmenting each printed layer, the final
step was to reconstruct the printed model and
correlate it with the theoretical point cloud of the
3Dmodel. In situations where the build platform of
the 3D printer was stationary, the reconstruction of
the model using the methodology presented in this
work would be as simple as concatenated all the
obtained point clouds from each individual deposited
layer. However, on the employed 3D printer
(Ultimaker 3 Extended), the print head is stationary in
the vertical direction and the build platform moves
during the process. Therefore, preprocessing of the
acquired point clouds of each printed layer before
their concatenating was imperative. In the first step,
the transformation between two subsequent layers
was computed by aligning their build platforms. The
alignment was conducted utilizing the Iterative
Closest Point (ICP) algorithm (Bellekens, 2014),
which is usually deployed in order to minimize the
difference between two point clouds. Thus, the ICP
algorithm was applied between two subsequent point
clouds before the segmentation of the build platform.
Due to the high concentration of points on the build
platform, it was feasible to match the individual build
platforms of two subsequent point clouds, acquiring
ultimately their transformation. Hence, the
segmentation of the build platform as well as the
transformation of the extracted layers have been
accomplished, enabling the representation of the
physical printed object. Finally, it is a matter of
concatenating the printed layers into a single point
cloud to reconstruct the 3D model as illustrated in the
left part of Fig. 9.
Figure 8: Segmentation of the build platform using Ransac
and the filtered point cloud.
Results of the employed optical monitoring
system are displayed also in Fig. 9, where in the
middle the theoretical point cloud of the test
specimen, which was obtained through the introduced
methodology described in Section 3.2, is presented.
Additionally, in the right part of Fig. 9 the correlation
between the theoretical and the actual reconstructed
point cloud of the examined model is exhibited. As it
can be observed qualitatively, the reconstructed
model is in decent agreement with the theoretical one.
For the qualitative comparison, a point cloud spatial
change detection method based on octrees has been
employed to compare the reconstructed point cloud to
its theoretical counterpart. An octree is a tree data
structure in which each internal node has exactly
eight children and is often used to partition a 3D space
by recursively subdividing it into octants (Tang,
2016). By calculating both point clouds octrees, it
was feasible to retrieve points that are stored at voxels
of one octree structure but do not exist in the other.
Using the abovementioned method on the generated
point clouds with a voxel size of 0.5 mm, the
differential point cloud representing the spatial
change between the theoretical and reconstructed
model was calculated and amounts to 9.6%. One
reason for the deviation between the examined point
clouds is a result of poor resolution of the employed
low cost optical sensor. Nevertheless, the proposed
optical monitoring system composes an efficient
method for real time monitoring of the FDM process
and in case of utilizing a more accurate optical sensor;
the introduced methodology could be efficiently
applied for any real time error detection in AM
procedures.
5 CONCLUSIONS AND FUTURE
WORK
In the present study, a low cost solution for online
monitoring of the FDM process has been introduced
through the integration of sensors on the 3D printer
and the implementation of image analysis algorithms.
In this sense, an optical scanning system was
integrated to a commercial FDM type 3D printer
using a low cost RGB-Depth camera and performed
initial experiments. The suggested system provides an
automatic optical monitoring system with no human
oversight. Taking into account the generated Gcode
for the manufacture of the product, a theoretical point
cloud of the 3D model has been obtained. This digital
representation of the part is in the most suitable form
in order to evaluate the accuracy of the 3D printing
In Situ Visual Quality Control in 3D Printing
323
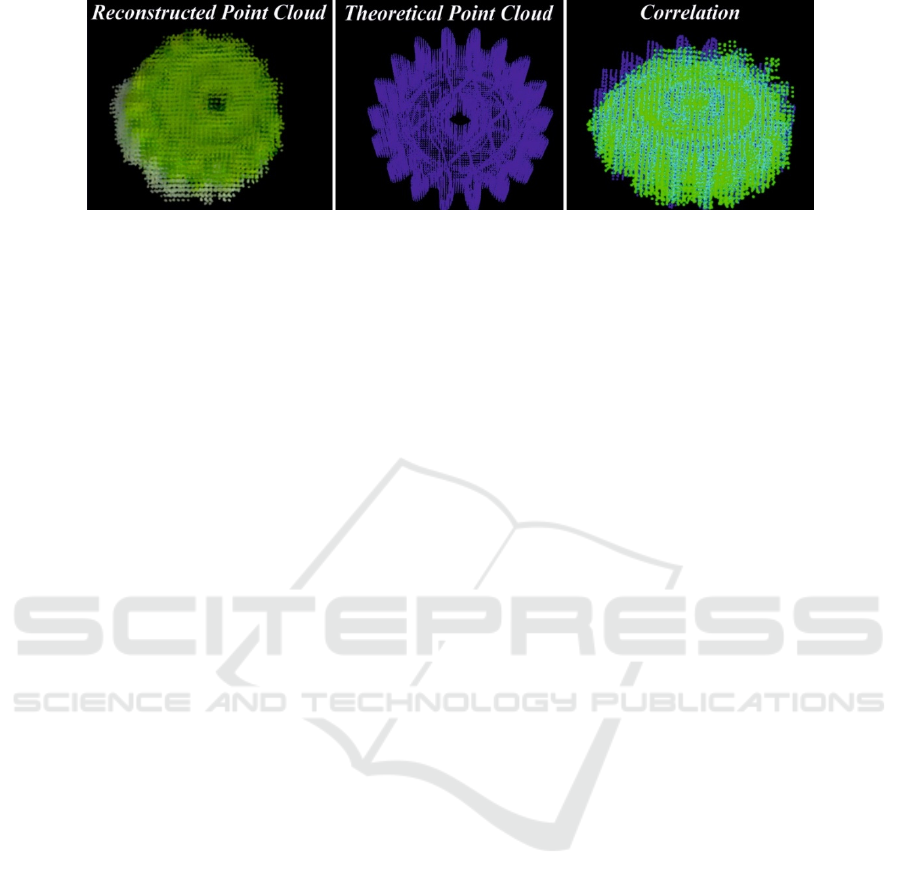
Figure 9: The reconstructed and theoretical point cloud of the test specimen and their correlation.
process, as it contains both the lattice and the support
structures of the examined model. Albeit the fact that
the resolution of the optical sensor is relatively low,
the developed algorithms by means of computer
vision and the obtained results exhibit that the
suggested method is a promising tool in real time
monitoring and detecting errors in 3D printing
technology.
ACKNOWLEDGEMENTS
«This research has been co-financed by the European
Union and Greek national funds through the
Operational Program Competitiveness,
Entrepreneurship and Innovation, under the call
RESEARCH – CREATE – INNOVATE (project
code:T1EDK- 04928)».
REFERENCES
Bellekens, B., Spruyt, V., Berkvens, R., & Weyn, M., 2014.
A survey of rigid 3D pointcloud registration algorithms.
In AMBIENT 2014: the Fourth International
Conference on Ambient Computing, Applications,
Services and Technologies, pages 8-13.
Delli, U. and Chang, S., 2018. Automated Process
Monitoring in 3D Printing Using Supervised Machine
Learning. Procedia Manufacturing, volume 26, pages
865–870.
Dimitrov, D., Van Wijck, W., Schreve, K., and De Beer, N.,
2006. Investigating the achievable accuracy of three
dimensional printing. Rapid Prototyping Journal,
volume 12, no. 1, pages 42-52.
Dinwiddie, R.B. and Love, L.J., Rowe, J.C., 2013. Real-
time process monitoring and temperature mapping of a
3D polymer printing process. In Proceedings of SPIE -
The International Society for Optical Engineering.
Faes, M., Vogeler, F., Coppens, K., Valkenaers, H.,
Abbeloos, W., Goedemé, T. and Ferraris, E., 2014.
Process Monitoring of Extrusion Based 3D Printing via
Laser Scanning. In International Conference on
Polymers and Moulds Innovations, pages 363-367.
Fang, T., Jafari, M., Danforth, S.C., and Safari, A., 2003.
Signature analysis and defect detection in layered
manufacturing of ceramic sensors and actuators.
Machine Vision and Applications, volume 15, pages
63–75.
Gibson, I., Rosen, D. and Stucker, B., 2014. Additive
Manufacturing Technologies: 3D Printing, Rapid
Prototyping, and Direct Digital Manufacturing.
Springer.
Holzmond, O. and Xiaodong, Li, 2017. In situ real time
defect detection of 3D printed parts. Additive
Manufacturing, volume 17, pages 135-142.
Kocisko, M., Teliskova M., Torok, J., and Petrus J., 2017.
Postprocess options for home 3D printers, Procedia
Engineering, volume 196, pages 1065-1071.
Kubicek, B., 2011. https://github.com/pbrier/gcode2vtk.
Malik, A., Lhachemi, H., Ploennings, J., Ba A. and Shorten,
R., 2019. An Application of 3D Model Reconstruction
and Augmented Reality for Real-Time Monitoring of
Additive Manufacturing, In Procedia CIRP, volume 81,
pages 346-351.
Nuchitprasitchai, S., Roggemann, M., and Pearce, J. M.,
2017. Factors effecting real-time optical monitoring of
fused filament 3D printing. Progress in Additive
Manufacturing, volume 2, pages 133-149.
Olson E., 2011. AprilTag: A robust and flexible visual
fiducial system. In IEEE International Conference on
Robotics and Automation, pages 3400-3407.
Rusu, R., B., and Cousins, S., 2011. 3D is here: Point Cloud
Library (PCL). In IEEE International Conference on
Robotics and Automation (ICRA).
Straub, J., 2015. Initial work on the characterization of
additive manufacturing (3D printing) using software
image analysis. Journal of Machines, volume 3, pages
55-71.
Tang, L., Fei-peng Da, and Huang, Y., 2016. Compression
algorithm of scattered point cloud based on octree
coding. In 2nd IEEE International Conference on
Computer and Communications (ICCC), pages 85-89.
Volpato, N., Aguiomar, Foggiatto J. and Coradini, Schwarz
D., 2014. The influence of support base on FDM
accuracy in Z. Rapid Prototyping Journal, volume 20,
no. 3, pages 182-191.
IVAPP 2020 - 11th International Conference on Information Visualization Theory and Applications
324
