
A Vehicle Telematics Service for Driving Style Detection:
Implementation and Privacy Challenges
Christian Kaiser
1a
, Alexander Stocker
1b
, Andreas Festl
1
, Marija Djokic Petrovic
1
,
Efi Papatheocharous
2
, Anders Wallberg
2
, Gonzalo Ezquerro
3
, Jordi Ortigosa Orbe
3
, Tom Szilagyi
4
and Michael Fellmann
4
1
Virtual Vehicle Research GmbH, Graz, Austria
2
RISE (Research Institutes of Sweden), Kista, Sweden
3
JIG, Logroño, Spain
4
University of Rostock, Rostock, Germany
{efi.papatheocharous, anders.wallberg}@ri.se, {gonzalo, jordi}@jig.es, michael.fellmann@uni-rostock.de
Keywords: Automotive, Connected Vehicles, Data-driven Services, Vehicle Telematics Service, Privacy, Trust, Cloud
Computing, Mobile Driver Application, Quantified Vehicles.
Abstract: Connected mobility is not only a future market, but also holds great innovation potential. The analysis of
vehicle telematics data in the cloud enables novel data-driven services for several stakeholders, e.g. a mobile
application for the driver to obtain his driving style. This inevitably leads to privacy concerns and the question
why and when are users willing to share driving telematic data, which we addressed in an empirical study.
The paper presents an implementation of a data-driven service based on vehicle telematics data and discusses
how privacy issues can be tackled. For the data-driven service, the most interesting steps along the vehicle
data value chain are described in detail, firstly (i) vehicle telematics data collection, secondly, (ii) the wireless
data transfer to a cloud platform, and thirdly, (iii) pre-processing and data analysis to evaluate the drivers’
driving style and analyse the driving risk. Finally, (iv) a smartphone application for drivers presents driving
style and driving risk data on the smartphone in an interactive way, so that the driver can work on improving
both, which has a positive effect on driving and road safety.
1 INTRODUCTION AND
MOTIVATION
Increasing road safety is a major worldwide
challenge. Though road safety in the EU has
improved in the last decades, still more than 25.000
people have lost their lives on EU roads in 2017
(European Commission, 2018). Harsh driving
remains one of the major causes of accidents. A report
from the NSTSCE (Camden et al., 2015) lists
violating speed limits, excessive speed and lateral
acceleration on curves, unplanned lane departures,
frequent hard braking, close following distances,
lateral encroachment, failure to yield at intersections,
and general disobedience of the road rules as risky
driving behaviour. The NSTSCE report continues that
a
https://orcid.org/0000-0002-5738-766X
b
https://orcid.org/0000-0002-3758-1617
a reduction in such risky driving should lead to a
reduction in accidents and related deaths and injuries.
Hence, making harsh and risky driving better visible
to drivers and other stakeholders such as traffic
planners or public authorities is a useful tool to
develop better strategies for road safety improvement.
In order to make it visible, vehicle telematics data of
so-called Quantified Vehicles (Stocker et al, 2017)
provides the baseline of data needed for the analysis.
However, in the current age of glass people, the road
to total monitoring, such as automated penalties, is
not far away. Hence, privacy and trust are among
research relevant topics in that field (Kaiser et al.,
2018) and must be achieved to get drivers to join in.
In the following sections, the paper presents an
empirical study on vehicle telematics data sharing
which results into a preliminary model of the
Kaiser, C., Stocker, A., Festl, A., Petrovic, M., Papatheocharous, E., Wallberg, A., Ezquerro, G., Orbe, J., Szilagyi, T. and Fellmann, M.
A Vehicle Telematics Service for Driving Style Detection: Implementation and Privacy Challenges.
DOI: 10.5220/0009329400290036
In Proceedings of the 6th International Conference on Vehicle Technology and Intelligent Transport Systems (VEHITS 2020), pages 29-36
ISBN: 978-989-758-419-0
Copyright
c
2020 by SCITEPRESS – Science and Technology Publications, Lda. All rights reserved
29

willingness to share data and five privacy levels that
users would like to have to choose from. Although
there is empirical evidence in the literature on actors
of a service ecosystem (e.g. Kaiser at al., 2019b) and
the value-adding steps, descriptions of concrete
implementations are still missing. Hence, an actual
implementation of a vehicle telematics service is
described afterwards, by outlining the required data
acquisition, the data analytics process from data
collection, the data computing in the cloud, and data
use within an information system running on a
smartphone developed along the steps of the so called
Vehicle Data Value Chain (Kaiser et al., 2019a). The
paper concludes with a discussion of the results and
their benefits to drivers and other stakeholders and a
brief outlook.
2 EMPIRICAL STUDY ON
PRIVACY IN VEHICLE DATA
SHARING
For a long time, the industry was told that one would
have large data treasures lying around if one only had
to lift them. That this is not the case is shown by many
practical examples where it is found that large
amounts of data are available but not the right data to
derive profitable findings. The situation is similar
with vehicle telematics data: Exciting applications
require big amounts of detailed data from a range of
vehicles and drivers. Unfortunately, after several
scandals in recent years where data was stolen or
misused, many users lost their basic trust and are now
more sensitive about who they give the data to.
To investigate background in this field, we
conducted a literature review and came up with the
search string „Data Sharing“ OR „Data Sharing
Theories” AND (Automotive OR Automobile OR
Vehicle OR Car OR “Vehicle Data”), which we
applied to popular scientific search engines
(SCOPUS, Google scholar, AISel) to identify 16
relevant results with data sharing theories. As a
summary, the majority of the 16 papers focus on
technologies and application possibilities and give
just little insights why someone would or would not
share his driving data.
In a next step, models and theories widely used for
technology acceptance were investigated by the
authors. However, neither the Technology Acceptance
Model (e.g. TAM3) (Venkatesh and Bala, 2008), nor
the three theories Unified Theory of Acceptance and
Use of Technology (e.g. UTAUT2) (Venkatesh et al.,
2012), the Theory of Reasoned Action (TRA) (Fishbein
and Ajzen, 1975), or the Theory of Planned Behavior
(TPB) (Ajzen, 1991) seem to fit ideally. In contrast, Ju
and Mou (2018) show in their research model
hypotheses that the willingness to disclose personal
information depends not only on Controls, e.g. age or
gender, which influence willingness, but also on the
Costs and Rewards for disclosing privacy, an
interesting approach.
Based on the literature analysis, two of the authors
compared their practical knowledge with the above-
mentioned models and theories, and finally derived
their own model, which is described in the following.
2.1 A Data Sharing Willingness Model
The authors found out, that the willingness to share
vehicle data depends on the intended usage, which in
turn depends on a mix of Benefits and Efforts, as
visualized in Figure 1. Per intended usage, different
benefits have a positive effect and can range from
self-awareness, optimization, rewards, image,
comfort to predictive maintenance and thus tempt a
potential user to consider sharing vehicle telematics
data for the intended usage. In contrast, per intended
usage, different efforts have a negative effect, e.g.
costs (acquisition), the technical effort for
installation, ongoing expenses (operation, mobile
phone costs), irritation through advertising/spam and
lower privacy speak against a use.
Figure 1: A preliminary model of the willingness to share
data, e.g. vehicle telematics data.
On this basis, we conducted an empirical online
survey, which was distributed to members of the
Faculty of Computer Science at the University of
Rostock and to researchers at Virtual Vehicle
Research GmbH. With the 42 survey participants, we
tried to find out whether someone would pass on their
vehicle telematics data, for which application cases
they would do so, and whether they would change this
situationally, for example to block data transfer in
certain periods of time. For the situational adaptation
of the data transfer, it was particularly interesting for
us how many levels there should be here. Levels can
range from, e.g. a binary level system that is either on
or off, up to a fine-granular system with several levels
which offer anonymization options and forwarding
for selected service providers/services only.
Willingness to
share data
Intended
usage
Benefits
Efforts
VEHITS 2020 - 6th International Conference on Vehicle Technology and Intelligent Transport Systems
30

Figure 2: Empirical result: privacy levels for vehicle data sharing.
2.2 Empirical Results
Although the average of the 42 study participants
proposed to provide four privacy levels (average 3.97,
standard deviation 1.15) and described them, the two
researchers who analyzed the results and synthesized
the individual statements into the model shown in
Figure 2 detected five privacy levels, as only five
levels include all viewpoints mentioned, namely
contractual services vs. open services, anonymized
data vs. not-anonymized data, private usage vs. public
usage. However, if it has to be four levels, then the
privacy levels Private Usage and Anonymized Usage
can be merged, as this aspect has the lowest priority.
The individual levels are described in the following.
Level No Usage does not allow any collection or
sharing of vehicle telematics data, and thus prevents
any services.
Level Private Usage uses collected vehicle
telematics data locally in the vehicle to create e.g.
statistics on driving behavior, which only the
driver/owner can see in order to interpret and
optimize oneself. However, no data is shared with any
third parties, thus no services, other than installed
services in the vehicle, can be used.
Level Anonymized Usage includes the services
installed in the vehicle, and additionally sends small
amounts, e.g. statistics or histograms, of anonymized
data to chosen third-party services. The driver can not
be identified, due to anonymization, e.g. location data
is not shared.
Level Limited Usage is intended to optimize
traffic for everybody, thus road specific data like
traffic jams, potholes, accidents, slipping wheels, etc.,
is shared with other drivers on this road through a
service. Hence, also a bigger amount of vehicle
telematics data is shared, but still not all of them. and
again, anonymized for third-party services.
Level Public Usage does not restrict data transfer
– all data will be shared using a proper sampling rate
per signal (perhaps on demand). Third parties will be
able to use this data without anonymization, e.g. to
enable the comparison between friends or services
which analyze regional differences in driving
behavior.
The survey participants also were asked to state,
how interested they are in sharing their data for a
particular domain, ranging from 1 (not likely) to 5
(very likely). In general, the survey participants’
willingness to share their vehicle telematics data for
each domain (c.f. Table 1) were lower than in their
interest. To summarize, the majority would provide
data for traffic improvement and emergency services,
while all the other mentioned domains would have to
offer an individual added value (benefit) so that users
give their data for it.
Vehicle
Telematics Data
PublicUsage
(unrestricteddata
transfer)
OpenIndividualS.
(driving styleanalysis)
andPublicServices
(road sta t i stics)
LimitedUsage
(position dataincluded,
restricted sharing)
Contractual Services
(driving styletuto rin g)
Anonymiz ed
Usage
(e.g.no position data)
StatisticalServices
(comparison of braki ng
/accelerating
behaviour with others)
PrivateUsage
(data notshared with
anythird parties)
StatisticalServices
(vehicle usage,typical
braking/accelerating
behaviour)
No Usage
(no data sharingatall)
No Servic es
DataInput PrivacyLevel Service(example)
A Vehicle Telematics Service for Driving Style Detection: Implementation and Privacy Challenges
31
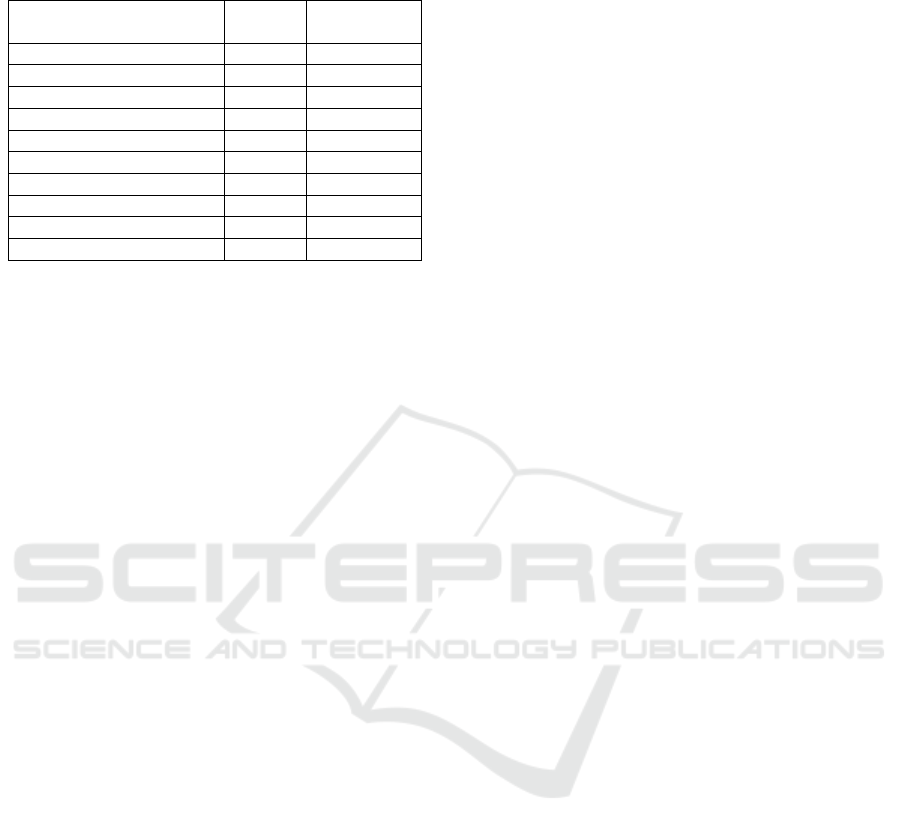
Table 1: How willing are survey participants to share their
data for a given set of domains.
Domain
Average
(1 to 5)
Standard
deviation
Community games 1.64 1.06
Automobile club 1.86 1.18
Pay as you drive insurance 2.02 1.33
Weather detection 2.98 1.56
Services for drivers 2.74 1.43
Vehicle improvement 2.86 1.41
Public governance 2.86 1.39
Research (novel services) 3.29 1.49
Traffic improvement 3.67 1.44
Emergency services 4.00 1.40
Since different privacy levels lead to an increased
effort for the service development if one offers a
reduced solution for the privacy levels Private Usage,
Anonymized Usage and Limited Usage,
functionalities for setting privacy levels are difficult
to find or not implemented at all in reality, although
the customers would approve of this.
Hence, in the following sections, we show how
selected steps of an actual implementation approach
of a vehicle telematics service for the driver can be
done, and thereby reflect where and how privacy
levels have to be taken into account.
3 VEHICLE TELEMATICS
SERVICE IMPLEMENTATION
In order to develop a smartphone application prototype
which informs the driver about his recent driving style,
several steps along a vehicle data value chain are
involved and thus explained in the following
subsections, to provide an overview of complexity and
dependencies. According to (Kaiser et al., 2019a), the
value chain consists of the steps Data Generation,
Data Acquisition, Data Pre-Processing, Data
Analysis, Data Storage and Data Usage.
In the following implementation example, the
Vehicle Data Logger (Data Acquisition) collects data
generated by vehicle sensors from the vehicle’s bus
system via the OBD interface and additional data
generated from sensors at the logging device (Data
Generation). A Cloud Platform receives the data and
acts as temporary raw data storage and platform for
data pre-processing and analysis (Data Pre-
Processing and Data Analysis), e.g. use of an
algorithm to detect harsh brake events. The
processing results are then stored permanently (Data
Storage) and provided to end users in a proper form
(Data Usage), e.g. using a smartphone application.
Privacy should play a role in data acquisition, so
that only authorized data is collected. Per privacy
level, different services are made possible with the
data, meaning that individual data pre-processing and
data analysis processes are needed per privacy level.
In our service, the driver wants to learn about his
driving style, e.g. get a score per trip which indicates
if it was good (100), bad (0) or somewhere in-
between, and wants to be able to check where events
like harsh braking or harsh accelerating have been
detected. While event detection and route recording
can be done locally in the vehicle with a low privacy
level, at least privacy level Anonymized Usage is
needed to calculate the driving score, as in this case
the amount of events are compared with the data from
other drivers.
3.1 Vehicle Data Logger
The first building block of this service is a data
acquisition system, called vehicle data logger, which
acts as gateway device to collect vehicle telematics
data. Our vehicle data logger is based on a
BeagleBoard single platine computer featuring an
additional, sensor “cape” stacked onto it with GPS,
rotation and acceleration sensors. The time-series data
captured by the logger is stored on a MariaDB database
on the logger. As soon as a connection is established
via the mobile network, the logger can send captured
data to the cloud platform. A rotary switch on the
hardware device can be used to set the privacy level.
To reduce the workload of mobile network connections
and to increase the throughput, SenML data format is
used for transmitting the data. SenML is a
compromised data format especially developed for IoT
device data. A TPM module is added via another
stackable “cape” to provide encryption possibilities. A
configuration file on the SD card can be used to
configure database name, username, password, which
sensors are recorded and the online API the data is sent
to. A more detailed specification of the logger is
provided in Papatheocharous et al. (2018) or Lechner
et al. (2019).
3.2 Cloud Platform
The data logger described in the previous sub-section
sends data to a defined channel of a message broker,
in this case a MQTT (Message Queuing Telemetry
Transport) Broker. One of the MQTT listeners is
triggered, parses and formats the data if needed and
forwards it to a cloud platform hosted by the company
RISE. The cloud platform aims to support the
exchange of data between devices and accommodate
VEHITS 2020 - 6th International Conference on Vehicle Technology and Intelligent Transport Systems
32

the deployment of cloud computing services.
Connection between the cloud platform and devices
occurs either directly or through a gateway. Any
authorized smart device with connectivity can go
through a gateway (a device or software designed for
the purpose) to exchange data with the cloud
platform. Devices may also choose to bypass the
gateway and exchange data with the cloud platform
directly. The data exchange can be carried out
through MQTT or HTTP connections.
The cloud platform offers telemetry ingestion
(accepts data), stream processing (data flows are
processed and converted to unified formats), storage
(data is stored in one or several databases), analytics
(data is statistically and semantically analyzed to
extract information), machine learning (data is
processed with machine learning algorithms to
extract knowledge and intelligence), visualization
(data is depicted in meaningful charts and graphs to
extract summarized information, generalizations,
locate anomalies, etc.), lifecycle management
(consists of supporting functions for the management
of devices, such as software updates or
(re)configuration), state (consists of storing the state
of devices at all given times), and, finally, apps
(consist of extended applications and services that can
extend the platform, and offer some additional
functionality or end-user value).
3.3 Cloud Computing Services
Different types of cloud computing services can be
deployed on the cloud platform. Foremost the
solution provisions for edge and cloud computing
services for safe and secure connected mobility
applications. The services accommodate data
ingestion, storage, processing and management.
Data ingestion is made primarily through an
MQTT broker, formatted as SenML JSON (Jennings
et al., 2018). Use of the broker and the publish-
subscribe pattern (Birman and Joseph, 1987) makes it
possible for remote and external trusted partners to
receive raw data, if necessary. Additionally, to
increase trust in privacy, users should be able to listen
to the defined channel (decrypted for them) to be able
to check which data is sent.
Data is stored through deployed databases, after
any required preprocessing is carried out. Timescale
(a module of PostgreSQL) for time-series data is
used. Access to the databases is encrypted with
Transport Layer Security (TLS) and certificates from
Let's Encrypt. Let's Encrypt (Internet Security
Research Group (ISRG), 2019) is a certificate
authority that provides free certificates for TLS
encryption via an automated process.
Management is accomplished through the use of
several Docker (Merkel, 2014) tools, i.e., Engine,
Compose, Swarm, Machine, and Machinery (Frécon,
2018). They offer efficient system architecture
deployments for any type of cloud provider and
provision for the daily operations of a number of
containers and solutions necessary for the
applications, such as data backup, restore and
application supervision.
3.4 Processing of Data
Docker containers were set up in this prototype to
process the data. Pre-processing and data analysis are
dependent on the privacy level chosen, as each
service has specific requirements for sampling rate or
the need of position data. However, in this case, to
inform the driver about his recent driving style, the
two pre-processing steps (i) resampling and (ii)
coordination system alignment of vehicle and logging
device start the processing, before algorithms detect
four event types (harsh brakes, harsh accelerations,
standstills and potholes) in the data. Later, they are
used to calculate an indicator how safe a driver’s trip
was, compared to other trips in the database.
Hence, the initial phase in the pre-processing of
data is the resampling of the raw data, namely the
measurement signals (e.g. acceleration, speed, GPS,
etc.) which were recorded with individual sample
rates on the data logging device. In data analytics this
step is a challenge, as some measurement signals are
recorded at irregular time intervals. For example, to
receive data collected from the vehicles OBD
interface, the Vehicle Data Logger is posting a
request to the OBD interface. As the OBD device has
low priority, while all other ECUs in the vehicle have
a higher priority, it might happen that time intervals
between two values for one signal type increase up to
seconds. For each signal the recorded values must be
interpolated/extrapolated using polynomial functions
(e.g. natural splines), so there are no discontinuities in
curves, and they are smooth. Hence, in this case a
resampling of the signal values at the regular time
interval of 10 Hz (1/10 sec) provides the data for the
further analysis.
The next pre-processing step is to align the
coordinate system of sensor with coordinate system
of the vehicle. It is usually unknown, how the Vehicle
Data Logger was exactly mounted in the vehicle.
Hence this is an important step to e.g. detect forward
driving as forward driving if the logging device was
mounted in the wrong direction, but also a few
A Vehicle Telematics Service for Driving Style Detection: Implementation and Privacy Challenges
33
degrees shift would already make an impact in
detecting i.e. hard accelerations and hard brakes. For
solving this data analytics task, the following
assumptions are adopted: the position of sensor is
fixed during the trip and on average the vehicle Z-
direction coincides with gravity vector, due to the fact
that the vehicle drives horizontally. Then the
following steps can be taken: identify Z-direction of
the vehicle as direction of gravity, identify periods of
deceleration and acceleration in the measurement
using OBD data, identify driving direction as vector
between the mean values for acceleration and
deceleration, orthogonalize the driving direction and
gravity vectors, compute vector in lateral direction as
cross product of driving direction and gravity,
compute rotation matrix from the driving direction,
gravity and lateral direction vectors and finally rotate
accelerometer and gyroscope measurements.
From the pre-processed measurement data, four
different event types are extracted: brake,
acceleration, standstill and pothole. Categorizing
brake and accelerate events is based on the vehicle
speed in combination with acceleration and
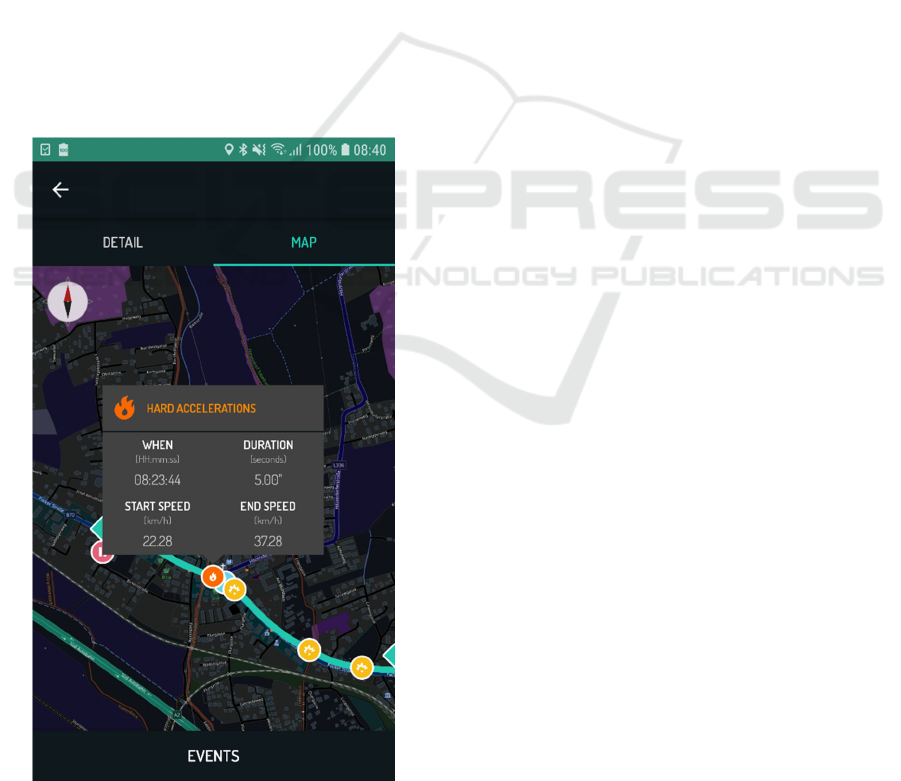
deceleration values. Figure 4 shows a detected harsh
acceleration event, where the driver accelerated from
22.28 km/h to 37.28 km/h within five seconds.
Identifying a pothole event is based on detecting
acceleration in Z direction and rotation around Y-axis
(pitch). For example, both signals indicate short peaks
at the beginning and the end of a pothole.
The safe driving score is based on statistical
ranks. For each trip and each event type, event-rate
per time unit is calculated (e.g. a trip has 0.1 hard
brakes per hour). The trip-event-score is also
calculated as the percentage of trips with the lower
event-rate, for the current event-type. The score for
one trip, trip-score, is calculated as the mean of all
trip-event-scores for that trip. Finally, the driver-
score is the latest value of the exponentially smoothed
time series of trip-scores for that driver. The values
for driver-score and trip-score are scaled from 0 to
100. Hence, a safe driving driver-score of 97 would
mean, that this driver is currently better than 97% of
all drivers in the database. A low safe driving score
indicates a risky driver.
The results of data processing can be obtained on
trip level (trip meta-data like start time and end time,
trip specific events with GPS location and meta-data,
and a safe driving trip-score), or on driver level
(overall safe driving driver-score, summed up
statistics like kilometers driven or events for a
requested time-period like last month). A PostgREST
API takes data requests of authenticated users, and
provides the data, e.g. for the smartphone application
described in the following sub-section.
3.5 Smartphone Application
The Android Offline Trip Analyser (OTA) mobile
application, will present to the users the information
produced in the trips they conducted. The application
collects the trip and event information from the
PostgREST API. The purpose of the application is to
present the user detailed information per trip with a
focus on safe driving relevant events.
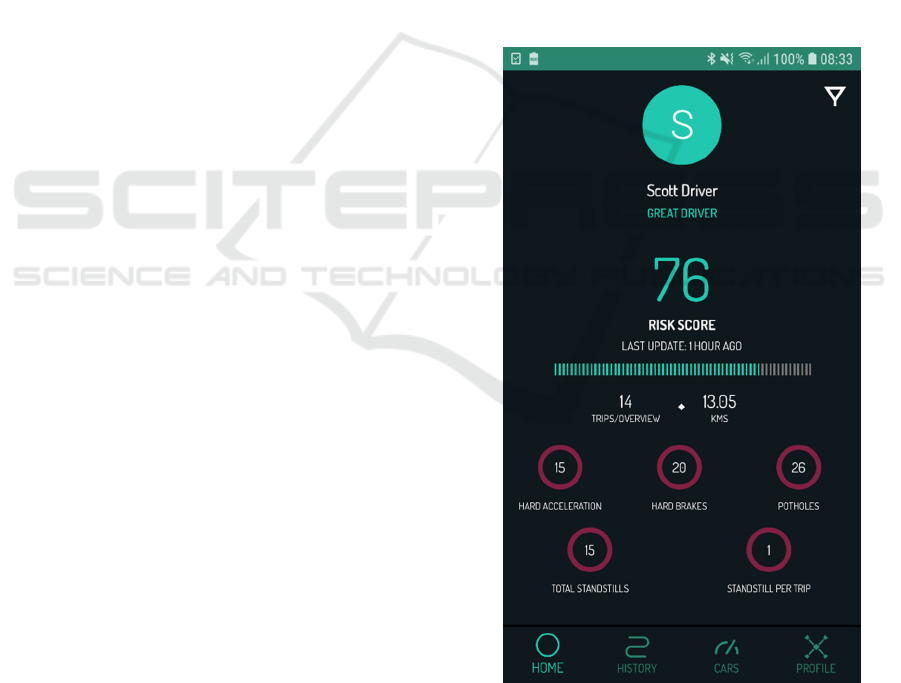
Once a user is logged into the application, the user
can switch between four menu items Home, History,
Cars and Profile (c.f. Figure 3, on the bottom).
The Home page, visualized in Figure 3, visualizes
a general summary and a summary of the events that
have occurred during a selected time period,
configurable with the filter on the right top, e.g. last
day, last week, a specific selected timeframe or always.
Figure 3: Smartphone App for drivers: Home.
On the History page, users will find the history of
their trips along with brief details, e.g. starting
position, ending position, trip-score and privacy level
per trip, sorted from the most recent to the oldest.
VEHITS 2020 - 6th International Conference on Vehicle Technology and Intelligent Transport Systems
34
Clicking a trip, if applicable, a sub-page on details of
the individual trip is shown, including graph
visualizations of the course of vehicle speed, RPM,
etc., and an event overview of the trip per event type.
The application user can also switch to a sub-page
visualizing a map of the individual trip (c.f. Figure 4),
to see the trip route on a map. Markers represent the
detected events at the event location and allow
interactive analysis of the events, as a tooltip pops up
on click providing detailed information, e.g. duration,
start- and end-speed of the acceleration event in
Figure 4. Hence, the user can zoom and navigate
through the map and click markers. Furthermore,
below the map, four tables (one per event type: brake,
acceleration, standstill, pothole) list all event
occurrences of the specific event type in this trip, to
provide another viewpoint on the data.
The SCOTT OTA aims to make it easier for the
drivers to keep detailed control of trips, learn from it
in order to improve their driving behavior. The safe
driving score per trip gives a quick indicator and an
objective evaluation of the driving style, while it is
possible to analyze every event in detail as well if
needed.
Figure 4: Smartphone App for drivers: Trip Map.
4 CONCLUSION AND OUTLOOK
In this paper, we investigate the potentials and issues
of vehicle telematics data sharing. Hence, we show a
preliminary model of the willingness to share vehicle
data, before we conduct an empirical study on the
topic of privacy. Furthermore, we show how an actual
implementation of a vehicle telematics service can
look like, and where privacy has to be taken into
account.
The results clearly show the single development
steps along the vehicle data value chain, namely data
collection, data computing in the cloud, and data use
within an information system running on a
smartphone, to provide a safe and secure connected
mobility smartphone application for drivers based on
vehicle data. Furthermore, for every step a privacy-
preserving way of a vehicle telematics service is
discussed.
While the potential of data-driven connected
mobility services as well as the potential of driver
statistic services is already proven by literature
(Kaiser et al., 2018) and a bunch of start-ups
operating in this field (Kaiser et al., 2017), this paper
misses a structured literature analysis for that topic,
which is a clear limitation. Furthermore, the presented
results, the data collection, the computing in the cloud
and the secure connected mobility smartphone
application need to be evaluated for scalability, to
prove if hundreds of users can use it simultaneously.
As an outlook, the mentioned privacy issues to be
tackled, which are now discussed in each
implementation step, will be implemented to evaluate
this as well.
ACKNOWLEDGMENT
This work is partially funded by the SCOTT
(http://www.scott-project.eu) project. SCOTT has
received funding from the Electronic Component
Systems for European Leadership (ECSEL) Joint
Undertaking under grant agreement No 737422. This
Joint Undertaking receives support from the
European Union’s Horizon 2020 research and
innovation programme and Germany, Austria,
France, Czech Republic, Netherlands, Belgium,
Spain, Greece, Sweden, Italy, Ireland, Poland,
Hungary, Portugal, Denmark, Finland, Luxembourg,
Norway, Turkey. In Austria the project was also
funded by the program “ICT of the Future” and the
Austrian Federal Ministry for Climate Action,
Environment, Energy, Mobility, Innovation and
A Vehicle Telematics Service for Driving Style Detection: Implementation and Privacy Challenges
35

Technology (BMK). The authors from VIRTUAL
VEHICLE Research GmbH in Graz also
acknowledge the financial support of the COMET K2
– Competence Centers for Excellent Technologies
Programme of the Federal Ministry for Climate
Action, Environment, Energy, Mobility, Innovation
and Technology (BMK), the Federal Ministry for
Digital and Economic Affairs (bmdw), the Austrian
Research Promotion Agency (FFG), the Province of
Styria and the Styrian Business Promotion Agency
(SFG).
REFERENCES
Ajzen, I., 1991. The theory of planned behavior.
Organizational behavior and human decision
processes, 50(2), 179-211.
Birman, K., Joseph, T., 1987. Exploiting virtual synchrony
in distributed systems. In Proceedings of the eleventh
ACM Symposium on Operating systems principles
(SOSP '87), pp. 123–138.
Camden, M. C., Hickman, J. S., Ha, R. J., 2015. United
States Department of Transportation: Federal Motor
Carrier Safety Administration. [Online]. Available:
https://cms.fmcsa.dot.gov/sites/fmcsa.dot.gov/files/doc
s/Guidance%20Document%20-%20Effective%
20Use%20of%20Onboard%20Safety%20Monitoring
%20Technologies.pdf
European Commission, 2018. Annual Accident Report
2018. [Online]. Available: https://ec.europa.eu/
transport/road_safety/sites/roadsafety/files/pdf/statistic
s/dacota/asr2018.pdf.
Fishbein, M., Ajzen, I., 1975. Belief, attitude, intention, and
behavior: an introduction to theory and research,
Addison-Wesley series in social psychology. Addison-
Wesley Pub. Co, Reading, Mass.
Frécon, E., 2018. Machinery, [Online]. Available:
http://www.docker-machinery.com/.
Internet Security Research Group (ISRG), 2019. Let’s
Encrypt. [Online]. Available: https://letsencrypt.org/.
Jennings, C., Cisco, Shelby, Z., ARM, Arkko, J., Keranen,
A., Ericsson, Bormann, C. and University Bremen TZI,
2018. Sensor Measurement Lists (SenML) draft-ietf-
core-senml-16. [Online]. Available:
https://tools.ietf.org/html/draft-ietf-core-senml-16
Ju, M., Mou, J., 2018. Privacy as a Commodity Is Not the
Case: Privacy Calculus Model for Connected Cars. In
WHICEB 2018 Proceedings (p. 44).
Kaiser, C., Festl, A., Stocker, A., Pucher, G., Fellmann, M.,
2019a. The Vehicle Data Value Chain as a Lightweight
Model to Describe Digital Vehicle Services. In
Proceedings of the 15th International Conference on
Web Information Systems and Technologies (WEBIST
2019), p. 68-79.
Kaiser, C., Stocker, A., Fellmann, M., 2019b.
Understanding Data-driven Service Ecosystems in the
Automotive Domain. In Proceedings of 25th Americas
Conference on Information Systems (AMCIS 2019).
Kaiser, C., Stocker, A., Festl, A., Lechner, G., Fellmann,
M., 2018. A research agenda for vehicle information
systems. In Proceedings of European Conference on
Information Systems (ECIS 2018).
Kaiser, C., Stocker, A., Viscusi, G., Festl, A., Moertl, P.,
2017. Quantified cars: An exploration of the position of
ICT start-ups vs. car manufacturers towards digital car
services and sustainable business models. In
Proceedings of 2nd international conference on new
business models, p. pp. 336–350.
Lechner, G., Fellmann, M., Festl, A., Kaiser, C., Kalayci,
T. E., Spitzer, M., Stocker, A., 2019. A Lightweight
Framework for Multi-device Integration and Multi-
sensor Fusion to Explore Driver Distraction. In
International Conference on Advanced Information
Systems Engineering (pp. 80-95). Springer, Cham.
Merkel, D., 2014. Docker: Lightweight Linux Containers
for Consistent Development and Deployment. Linux
Journal, Bd. 239, pp. 1075-3583, 2014.
Papatheocharous, E., Frécon, E., Kaiser, C., Festl, A.,
Stocker, A., 2018. Towards a Generic IoT Platform for
Data-driven Vehicle Services. In IEEE International
Conference on Vehicular Electronics and Safety, Bd.
doi: 10.1109/ICVES.2018.8519505.
Stocker, A., Kaiser, C., Fellmann, M., 2017. Quantified
vehicles. Business & information systems engineering,
59(2), 125-130.
Venkatesh, V., Bala, H., 2008. Technology acceptance
model 3 and a research agenda on interventions.
Decision sciences, 39(2), 273-315.
Venkatesh, V., Thong, J. Y., Xu, X., 2012. Consumer
acceptance and use of information technology:
extending the unified theory of acceptance and use of
technology. MIS quarterly, 36(1), 157-178.
VEHITS 2020 - 6th International Conference on Vehicle Technology and Intelligent Transport Systems
36
