
Prior Knowledge as a Predictor for Persistence
Shirin Riazy
1
, Katharina Simbeck
1
, Robert Woestenfeld
2
and Marco Traeger
2
1
Hochschule f
¨
ur Technik und Wirtschaft, Berlin, Germany
2
Mathe im Leben gGmbH, Berlin, Germany
Keywords:
MOOC, Persistence, Virtual Learning Environment, Early Adopters, Language Analysis.
Abstract:
Prior knowledge has been known to play a large role in the success of MOOCs. Using the virtual learning
environment of “Mathe im Advent” (MiA), we have analyzed possibly influential factors for the persistence
of students, specifically prior mathematical and language abilities. Furthermore, we have connected linguistic
indicators of text difficulty to fluctuations and differences in participating populations. MiA is a German
virtual advent calendar offering 24 daily mathematical tasks with over 100,000 users annually. Survey results
of the years 2017 and 2018 with over 8,000 participants were further analyzed. The result of the examination is
that persistence, as well as the reparticipation of students strongly depended on prior mathematical knowledge
and German abilities. This effect was especially visible when the language of the tasks was difficult and their
readability was low.
1 INTRODUCTION
Learning analytics (LA) methods, which serve to “un-
derstand and optimize learning and the environments
in which it occurs” (Siemens, 2013), have shown to
improve outcomes in early adopters (Sclater et al.,
2016). While trends and demographics of students
in virtual learning environments (VLE) and MOOCs
have been studied (e.g. (Ruip
´
erez-Valiente et al.,
2019)), Meaney and Fikes (Meaney and Fikes, 2019)
have recently proposed that the feedback-loops of the
innovations, as well as the research in LA are influ-
enced by the bias of the early adopters. Specifically,
they have found that the participants of MOOCs are
often well-educated and less in need of learning in-
terventions (Meaney and Fikes, 2019). The educat-
edness of students as a predictor for success has also
been found in other contexts (Kennedy et al., 2015;
Smith et al., 2019; Gardner and Brooks, 2018). When
it comes to language abilities of students, Crossley
and colleagues (Crossley et al., 2015) have found
that sophistication and organization of a student’s lan-
guage is a strong predictor for success.
In this paper, we present the results of an evalu-
ation of a German MOOC for students between the
ages 9 – 14. Specifically, we examine whether prior
mathematical and language abilities are predictors for
mathematical performance and persistence, leading to
the following research questions
RQ1: Does prior mathematical success influence the
success in a MOOC?
RQ2: Do prior language abilities influence the suc-
cess in a MOOC?
RQ3: How do readability and text difficulty influence
the participation of students?
To conduct this analysis, survey results of between
8,000–50,000 students were evaluated.
2 PREDICTORS OF SUCCESS IN
MATHEMATICAL MOOCs
For the past decade, massive open online courses have
been explored as a part of blended learning settings
(Borba et al., 2016), with a peak in the years 2012 and
2013 (Lopes et al., 2015). When it comes to math-
ematical MOOCs, the focus often lies on bridging
the gap between school and university (Daza et al.,
2013; Najafi et al., 2014; Vihavainen et al., 2013),
specifically addressing older, well-educated students
(Meaney and Fikes, 2019). Apart from obvious ad-
vantages of MOOCs, the permanent availability and
large outreach, they have also been found to activate
other groups of students than face-to-face teaching
(Jiang et al., 2016). In an attempt to analyze and im-
prove user participation, the attrition and performance
of students is often predicted (Kennedy et al., 2015).
Riazy, S., Simbeck, K., Woestenfeld, R. and Traeger, M.
Prior Knowledge as a Predictor for Persistence.
DOI: 10.5220/0009324201370144
In Proceedings of the 12th International Conference on Computer Supported Education (CSEDU 2020) - Volume 1, pages 137-144
ISBN: 978-989-758-417-6
Copyright
c
2020 by SCITEPRESS – Science and Technology Publications, Lda. All rights reserved
137
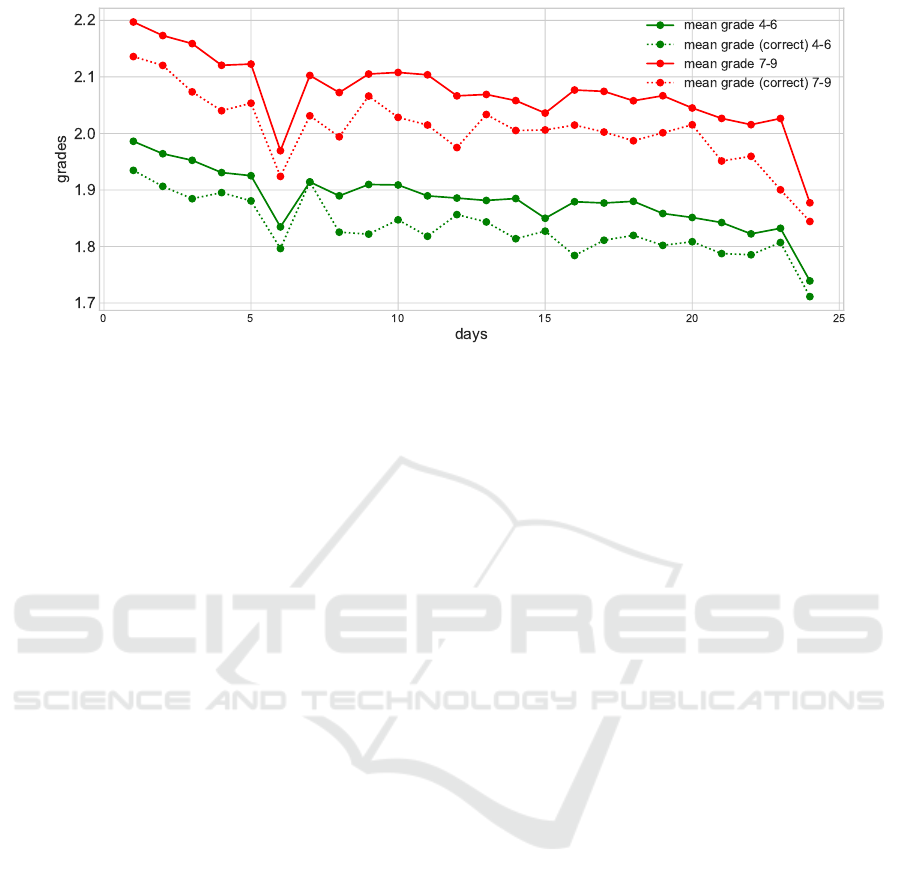
Figure 1: Average Grade (1 ˆ= Best Grade, 6 ˆ= Worst Grade) of All Students Who Have Submitted the Solution to a Task for
the Calenders “4-6” (r = −0.84161, p < 10
−5
) and “7-9” (r = −0.73428, p = 0.0004), Respectively, of the Advent Calendars
in 2017. Dotted: Average Grades of All Students Who Have Submitted Correct Solutions to Those Tasks.
The pre-course performance of students (beside
the general course performance and the engagement
of students) is one of the most prevalent factors used
for the prediction of student performance (Hellas
et al., 2018). This falls in line with the construc-
tivists’ approaches of learning situations, which em-
phasize the importance of taking the individual “start-
ing points” of students into account (Kennedy et al.,
2015). When predicting computer science students’
performance, for example, the majority of the investi-
gations point towards the significance of pre-existing
mathematical and programming knowledge (Smith
et al., 2019). This has also been observed in a mathe-
matical context (Abeer and Miri, 2014).
However, not only technical skills play a role in
the processing of a task. Garman (Garman, 2010)
has found that the reading comprehension (measured
through a cloze test (Taylor, 1953)) has a signifi-
cant impact on the scores of students (in a begin-
ning database management class). Wojciechowski
and Palmer (Wojciechowski et al., 2005) similarly
find that student reading comprehension (among other
prior knowledge factors) was a predictor for success
in an online undergraduate business course at a com-
munity college.
A portion of MOOC performance prediction fur-
ther deals with language in discussion forums. While
several of these publications use NLP-features for the
prediction of performance (Crossley et al., 2016; Wen
et al., 2014; Yang et al., 2015), others identify so-
cial structures (Ros
´
e et al., 2014). Wen et al. (Wen
et al., 2014) use linguistic markers of learner motiva-
tion (such as “apply” and “need”-words) and Yang et
al. (Yang et al., 2015) study the effects of expressed
confusion from these forum posts. However, Rose et
al. (Ros
´
e et al., 2014) have found the social clustering
to be more feasible as a predictor using discussion fo-
rum data than the language.
Crossley and colleagues (Crossley et al., 2016)
compared forum-based NLP-features with activity-
based features and, while the NLP features did predict
the completion of the MOOC, adding activity-based
features improved the outcome by 10%.
3 MATHE IM ADVENT
In the current examination, student data from the ad-
vent calendar of “Mathe im Advent” of the years 2017
and 2018 were used. The advent calendar is split into
two parts, one calendar for students of the grades 4–
6 (ages 9 – 12), and one for students of the grades
7–9 (ages 12 – 15). Each of these calendars consists
of 24 math text problems, which are to be submitted
on the i-th day of December (i = 1, .. . , 24). On the
weekends, the deadline is extended to the following
Monday.
The advent calendar is set up as a prize compe-
tition, where students who successfully solve all 24
questions may win the main prizes. Aside from the
main prizes, competitors who have submitted 20 tasks
(out of which 13 must be correct) may win smaller
prizes.
Gardner and Brooks (Gardner and Brooks, 2018)
have defined MOOCs with the following attributes:
Aside from being massive, open and online, they are
generally low- or no-stakes, asynchronous in their us-
age and to be used by a heterogeneous group. “Mathe
im Advent” may also be considered low- or no-stakes,
since there is no penalty for repeating or failing to
CSEDU 2020 - 12th International Conference on Computer Supported Education
138

complete the course (Gardner and Brooks, 2018).
However, it is not completely asynchronous, meaning
that the tasks generally have to be submitted in the
right order, on specific days. Furthermore, the group
of students is more homogeneous than in traditional
MOOCs, when it comes to demographics and inten-
tions.
3.1 Comparison to Other MOOCs
A lot of effort has gone into preparing mathemat-
ical courses and lectures for learning in MOOCs.
Coursera, EdX, iversity and Udacity, for example,
offer mathematical classes at approaching or under-
graduate level (Burrill and Ben-Zvi, 2019). When it
comes to more basic mathematical knowledge, Khan
academy
1
offers basic mathematical learning materi-
als for classes 1 through 8. Stanford university offers
a self-paced MOOC on how to learn math
2
.
Moving away from classical MOOC formats to
competition-based online resources, name-worthy of-
fers are made by Math Kangaroo
3
, as well as classical
Math Olympiads
4
, which recently expanded their of-
ferings to online recourses.
The most obvious discrepancy between any of the
presented formats and “Mathe im Advent” are the
theme-inspired tasks, which also serve the purpose of
conveying a Christmas-motivated story in a fictional
setting. The materials are openly available as is the
prize competition.
3.2 Rules and Mechanisms of the
Advent Calendar
In the advent calendar, 24 mathematical text questions
are (mostly) to be solved on consecutive days. Unlike
typical tasks, they are embedded within a fictional sto-
ryline with fixed characters. The tasks begin with a
description of the setting, similar to a story leading
up to a problem. The tasks are designed as multiple
choice questions. If a solution was not submitted on
time or wrong, the students may apply a “Joker” op-
tion (up to three times), where the false/missing an-
swer is treated as a correct answer.
Together with each submission, the participants
were able to judge how much they liked the task (“rat-
1
https://de.khanacademy.org/. Last accessed 2019-11-15.
2
https://lagunita.stanford.edu/courses/Education/
EDUC115-S/Spring2014/about. Last accessed 2019-
11-15.
3
http://www.mathkangaroo.us/mk/default.html. Last ac-
cessed 2019-11-15.
4
https://www.moems.org/. Last accessed 2019-11-15.
ing”), as well as how difficult they thought the task
was (“difficulty”).
The text questions were designed by pedagogical
experts and often influenced by user submissions. If a
user-submitted task is chosen for the advent-calendar,
this is remarked at the bottom of the page.
3.3 Surveys before and after the Advent
Calendar
In order to improve their offer, “Mathe im Advent”
launches two surveys per season, one at the beginning
of December and one at the end. These surveys are
voluntary and the registered users are asked via e-mail
to participate.
While over 100,000 students participated in the
advent calendars of 2017 and 2018, only a portion
of these students participated in the surveys before
and after the advent calendar. In the survey, they
were asked a variety of questions, such as whether
they were interested in mathematics in general and
whether they thought mathematics was fun. The stu-
dents had the possibility to opt-out on single ques-
tions, as well as the whole survey.
The questions that we have examined were as fol-
lows:
1. What was your most recent grade in mathematics?
2. How long did you find the text problems in gen-
eral?
The answers to all of these questions were given
on ordinal scales. For question (1), the answer was
given in the German grading system, where 1 equates
to the highest grade and 6 is the lowest possible grade.
Question (1) was asked in the surveys 2017 and 2018
at the beginning (or prior to the) advent calendar,
while question (2) was asked at the end of the com-
petition.
3.4 Available Data for Analysis
The data available for analysis was
1. the submission data for 2017 (110,995 partici-
pants) and 2018 (101,254 participants), including
difficulties and ratings of tasks (Section 3.2),
2. the survey data (Section 3.3),
3. the text problems of “Mathe im Advent” between
2015 and 2018.
Prior Knowledge as a Predictor for Persistence
139

Table 1: Number of Participants Who Have Answered the
Questions from Section 3.3 in the Calendars “4-6” and “7-
9”, the Years 2017 and 2018 and the Surveys before or after
the Advent Calendar.
Year Survey question Number of
Participants
Survey
2017 Recent grade 58,285 Before
Recent grade 8,733 Before
2018 Length 11,243 After
perception
4 METHOD
The current examination consists of three parts. First,
the survey data (see Section 3.3) was connected to
the submissions of the 24 tasks in 2017 and 2018, re-
spectively. This was done in order to find submission
trends in relation to (estimated) pre-existing mathe-
matical and language skills. As one would expect,
there is a falling trend, when it comes to the number
of submissions alone. In order to find out, which stu-
dents tend to persist until the end of the competition,
the average grade of all the students having submit-
ted a task per day was computed. Note that this en-
tails only students who chose to take part in the sur-
vey. Furthermore, from the participants of the survey,
not everyone chose to answer each of these questions.
Details for the answers are listed in Table 1.
Note that a single answer to the survey ques-
tion was used as an indicator for pre-existing knowl-
edge over the course of the whole advent calendar.
For example, for each task, the average mathematical
grades of the students prior to beginning the advent
calendar were evaluated.
The second part of the examination was the evalu-
ation of the daily ratings and difficulties (see Section
3.2) of the tasks. In order to find trends, we have an-
alyzed the means of all ratings and difficulties. Note
that the number of submissions for these values dif-
fered (ranging from 9,265 to 40,668 in 2018) each day
and that they were not only submitted by students, but
also potentially by teachers and any registered user
who submitted the task.
Thirdly, we have examined the language proper-
ties of the tasks and their evolution over the years.
Since all of the tasks are formulated as text prob-
lems, their correct processing presupposes sufficient
language skills. To estimate the coherence of the text
problems in general, we have evaluated text statistics,
such as the average syllable count, the average word
count and so on. All of the variables used for the cal-
culations of text statistics are listed in Table 2.
Table 2: Basic Text Statistics (and Their Explanations)
Used for the Analysis of the Tasks.
Text Statistic Explanation
Syllable count Total number of syllables in
a task.
Lexicon count Total number of words in a
task.
Sentence count Total number of sentences in
a task.
As the first text statistic, we have used the Flesch
reading ease score (FRES) (Flesch, 1948)
FRES := 180 −
total words
total sentences
− 58.5 ·
total syllables
total words
.
The FRES score of a task lies in the interval [0, 100]
and rates the text difficulty from “Very Confusing”
(0-29) to “Very Easy” (90-100). The listed version
was corrected by Toni Amstad for the German lan-
guage (Amstad, 1978). The next statistic, the Flesch-
Kincaid grade level (FKGL) (Kincaid et al., 1975)
calculates a grade level for which the difficulty of a
given text would be appropriate. It was developed for
the English language and US-american grade system.
Above grade level 12 may be interpreted as College
level.
FKGL :=0.39 ·
total words
total sentences
+ 11.8 ·
total syllables
total words
− 15.59
The Wiener Sachtextformel (WSTF, first of three)
(Bamberger and Vanecek, 1984) is a readability index
by Bamberger and Vanecek. It was specifically devel-
oped for German texts and it outputs a grade level for
which the difficulty of the text would be appropriate.
WSTF :=0.1935 ·
words with ≥ 3 syllables
total words
+ 0.1672 ·
total words
total sentences
+ 0.1297 ·
words with > 6 letters
total words
− 0.0327 ·
words with 1 syllable
total words
− 0.875.
We have evaluated these text statistics for MiA
tasks during the years 2015 until 2018.
5 RESULTS
In the following, we will explain the results of the
three parts of the examination.
CSEDU 2020 - 12th International Conference on Computer Supported Education
140
5.1 Part 1: Survey Questions
With at least 8,000 answers per survey question (Ta-
ble 1), we have connected these answers to the actual
task submissions of these users. Students submitting
any answer to the task of the day tended to have better
grades (mathematics) towards the end of the competi-
tion (Figures 1 and 2), with highly significant correla-
tion coefficient r > 0.7, over the course of the month.
The submissions of Jokers were not taken into con-
sideration.
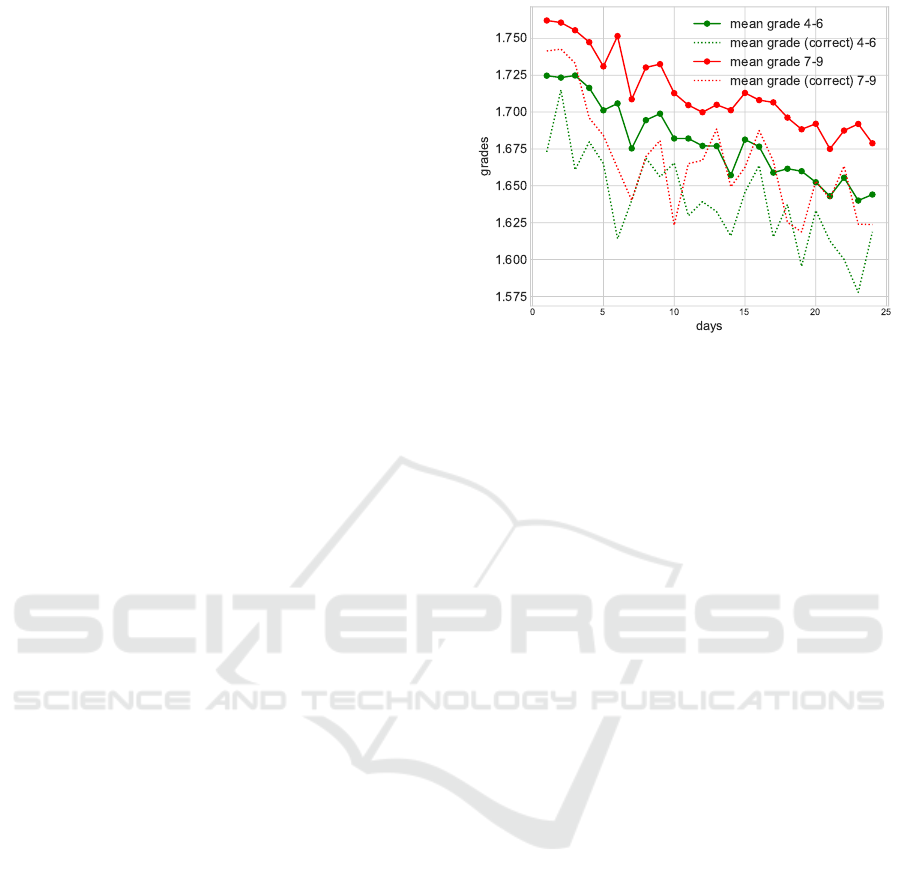
Furthermore, those students who have submitted
correct answers to the tasks tended to have higher
grades in mathematics, with a tendency towards better
grades the end of the month.
On the weekends (around the 6th and 15th in
2017, Figure 1), there were visible peaks in the
grades, meaning that students who submitted the tasks
on the weekends tended to have better grades. Simi-
larly, there was a peak on the final day (24th), when
the holiday break had started.
The second question, the perceived overall length
of the text problems, was used as an indicator for the
ease of text comprehension of the student. Students
who found the task problems rather too short than
too long, seemed to persist in relation to all of the
students. Moreover, the averaged text length percep-
tion of those students who submitted correct answers
tended more towards “too short” than “too long”.
It should be noted that the text length percep-
tion differs more between general submissions and
the correct submissions for the calendar “7 – 9” in
comparison to the calendar “4 – 6”.
5.2 Part 2: Difficulties and Ratings
As the second part of our examination, we have plot-
ted the averaged perceived difficulties and ratings of
the tasks in Figure 3. We have not found a significant
difference between the scores of students who sub-
mitted correct answers (see Figure 3, dotted line) in
comparison to the general scores.
Furthermore, we did not find any trends of ris-
ing/falling difficulties or ratings over the course of the
month. It was, however, noticeable that the rating and
the difficulties of the tasks were closely linked, with
highly significant correlation coefficients over r = 0.8
(see Figure 3).
5.3 Part 3: Text Statistics
In the third part of our analysis, we have calculated
different text statistics in order to get measures of the
difficulties of the language of the text problems. All
Figure 2: Average Grade (1 ˆ= Best Grade, 6 ˆ= Worst
Grade) of All Students Who Have Submitted the Solution
to a Task for the Calenders “4-6” (r = −0.948, p < 10
−5
)
and “7-9” (r = −0.91968, p < 10
−5
), Respectively, of the
Advent Calenders in 2018. Dotted: Average Grades of All
Students Who Have Submitted Correct Solutions to Those
Tasks.
of the measures used are listed in Table 2. The results
of the analysis are depicted in Table 3.
While the syllable and lexicon counts seem to
have a rising tendency over the years, the sentence
count has a clear drop in 2017. This is likely a reason
for the increase in text difficulty, when measured by
FRES, FKGL and WSTF. The singular increase of the
difficulty in 2017 also coincides with the lowest total
number of user-submitted tasks within a season.
In general, the difficulties of the text problems
seem to be rather high (WSTF between 7 and 9 for
the calendar “4 – 6”) and similar between the two cal-
endars.
6 DISCUSSION
All in all, we have detected several trends in the
persistence of students in a virtual learning environ-
ment. Firstly, there were trends in average grades in
2017 (Figure 1) and 2018 (Figure 2), such that stu-
dents with higher grades (mathematics) were more
likely to persist until the end of the advent calen-
dar, even though the difficulties were not rising (Fig-
ure 3). In addition, those students, who are more at
ease with longer texts (measured by perceived text
length), were more strongly represented towards the
end of the competition. As for how well-liked the
tasks were, there was a strong connection between the
(inverted) ratings and the perceived difficulties of the
tasks, meaning that most students preferred easy tasks
(highly significant r > 0.8).
Prior Knowledge as a Predictor for Persistence
141
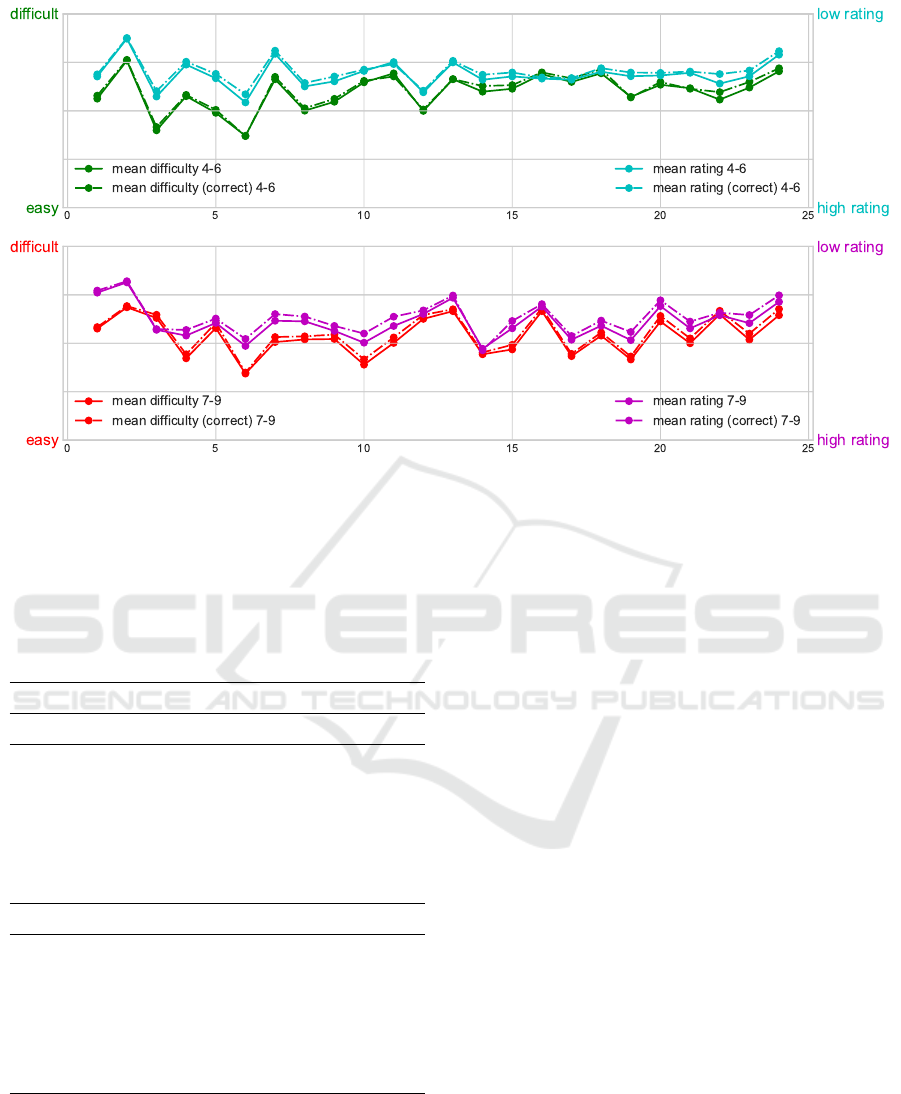
Figure 3: Average Difficulty and Rating of the Advent Calendar Problems per Day for the Calendars “4-6” (Top, Correlation
r = 0.858, p < 10
−5
between Difficulty and Rating) and “7-9” (Bottom, Correlation r = 0.86107, p < 10
−5
between Difficulty
and Rating), Respectively, in 2018.
Table 3: Averaged Text Statistics of the “Mathe Im Ad-
vent” Math Problem Texts of the Calendars “4 – 6” and “7
– 9” from 2015 until 2018. “User Tasks” Denotes the To-
tal Number of Tasks (out of 24) That Were Accepted from
User Recommendations. Syllables, Lexicon and Sentences
Refer to the Basic Text Statistics (See Table 2).
Text statistics 2015 2016 2017 2018
calendar 4 – 6
User tasks 10 9 7 12
Syllables 435.96 441.88 441.92 527.42
Lexicon 250.71 253.17 249.38 305.46
Sentences 15 15.33 13.75 20.42
FRES 61.03 59.48 57.38 63.49
FKGL 7.43 7.71 8.2 6.42
WSTF 8.25 8.44 8.97 7.02
calendar 7 – 9
User tasks 12 6 5 9
Syllables 511.42 533.33 476.08 630.29
Lexicon 288.17 301.46 265.79 362.38
Sentences 17.29 17.17 14.71 20.83
FRES 59.52 57.56 55.59 60.46
FKGL 7.84 8.08 8.69 7.67
WSTF 7.46 7.63 8.55 6.71
In the operationalization of the difficulty of the
tasks, we have focused specifically on the language
properties of the tasks, as the sophistication of lan-
guage has been found to predict success in MOOCs
(Crossley et al., 2015; Abeer and Miri, 2014). Here,
we have noticed peaks in all of the statistical measures
in the year 2017. The language of the tasks was noti-
cably more difficult than in other years. Furthermore,
the total number of participants, as well as the number
of participants of the survey, dropped drastically after
2017 (see Table 1). Also, the average of the grades of
students participating in the survey in 2018 were far
better than the grades of the students from 2017 (see
Figures 1 and 2). This points towards a sifting effect
of the difficult tasks of 2017.
One of the dangers in the development of virtual
learning environments is an excessive focus on (well-
educated) early adopters, who are less in need of inter-
ventions (Meaney and Fikes, 2019). It is a pedagogi-
cal challenge in learning analytics to supply learning
environments, which are suitable for a wide range of
participants. Furthermore, it is relevant to examine
possible obstacles (such as lacking language skills),
which are a priori independent of the task at hand.
As a tool for the analysis of text problem difficul-
ties, we have implemented three reading ease / text
difficulty indices, which have successfully detected a
peak in the difficulty of text problems in 2017. This
has likely led to a sifting effect. We propose these
measures as possible tools for prior analysis of the
tasks, in order to assure consistency and appropriate-
ness.
CSEDU 2020 - 12th International Conference on Computer Supported Education
142

7 CONCLUSION
In conclusion, the persistence, as well as the repartic-
ipation of students in the “Mathe im Advent” calen-
dar strongly depended on prior mathematical knowl-
edge and command of German language. This ef-
fect was especially visible when the language of the
tasks was difficult and their readability was low. As
an outlook, we would like to further investigate the
connection between the perceived level of difficulty
of a task and their reading ease scores. This evalu-
ation, in a task-specific setting, would allow to au-
tomtically pre-assess tasks with regards to difficulty.
Future work will include the prediction of task dif-
ficulty using more sophisticated (machine learning)
methods.
ACKNOWLEDGEMENTS
This research has been funded by the Federal Ministry
of Education and Research of Germany in the frame-
work “Digitalisierung im Bildungsbereich” (project
number 01JD1812A).
REFERENCES
Abeer, W. and Miri, B. (2014). Students’ preferences and
views about learning in a MOOC. Procedia-Social
and Behavioral Sciences, 152:318–323.
Amstad, T. (1978). Wie verst
¨
andlich sind unsere Zeitungen?
Z
¨
urich: Studenten-Schreib-Service.
Bamberger, R. and Vanecek, E. (1984). Lesen, verstehen,
lernen, schreiben: die Schwierigkeitsstufen von Texten
in deutscher Sprache. Jugend und Volk.
Borba, M. C., Askar, P., Engelbrecht, J., Gadanidis, G.,
Llinares, S., and Aguilar, M. S. (2016). Blended learn-
ing, e-learning and mobile learning in mathematics
education. ZDM, 48(5):589–610.
Burrill, G. and Ben-Zvi, D. (2019). Topics and Trends in
Current Statistics Education Research: International
Perspectives. ICME-13 Monographs. Springer Inter-
national Publishing.
Crossley, S., McNamara, D. S., Baker, R., Wang, Y., Paque-
tte, L., Barnes, T., and Bergner, Y. (2015). Language
to completion: Success in an educational data mining
massive open online class. International Educational
Data Mining Society.
Crossley, S., Paquette, L., Dascalu, M., McNamara, D. S.,
and Baker, R. S. (2016). Combining click-stream data
with NLP tools to better understand MOOC comple-
tion. In Proceedings of the sixth international confer-
ence on learning analytics & knowledge, pages 6–14.
ACM.
Daza, V., Makriyannis, N., and Rovira Riera, C. (2013).
MOOC attack: closing the gap between pre-
university and university mathematics. Open Learn-
ing: The Journal of Open, Distance and e-Learning,
28(3):227–238.
Flesch, R. (1948). A new readability yardstick. Journal of
applied psychology, 32(3):221.
Gardner, J. and Brooks, C. (2018). Student success predic-
tion in MOOCs. User Modeling and User-Adapted
Interaction, 28(2):127–203.
Garman, G. (2010). A logistic approach to predicting stu-
dent success in online database courses. American
Journal of Business Education (AJBE), 3(12):1–6.
Hellas, A., Ihantola, P., Petersen, A., Ajanovski, V. V.,
Gutica, M., Hynninen, T., Knutas, A., Leinonen, J.,
Messom, C., and Liao, S. N. (2018). Predicting aca-
demic performance: a systematic literature review.
In Proceedings Companion of the 23rd Annual ACM
Conference on Innovation and Technology in Com-
puter Science Education, pages 175–199. ACM.
Jiang, S., Schenke, K., Eccles, J. S., Xu, D., and
Warschauer, M. (2016). Females’ enrollment and
completion in science, technology, engineering, and
mathematics massive open online courses. arXiv
preprint arXiv:1608.05131.
Kennedy, G., Coffrin, C., De Barba, P., and Corrin, L.
(2015). Predicting success: how learners’ prior
knowledge, skills and activities predict MOOC perfor-
mance. In Proceedings of the fifth international con-
ference on learning analytics and knowledge, pages
136–140. ACM.
Kincaid, J. P., Fishburne Jr, R. P., Rogers, R. L., and
Chissom, B. S. (1975). Derivation of new readability
formulas (automated readability index, fog count and
flesch reading ease formula) for navy enlisted person-
nel.
Lopes, A. P., Soares, F., and Vieira, I. (2015). Challenges
in the creation and development of a mathematics
MOOC. In Proceedings of the International Confer-
ence of Education, Research and Innovation (ICERI),
8th, pages 1862–1867. IATED.
Meaney, M. J. and Fikes, T. (2019). Early–adopter itera-
tion bias and research–praxis bias in the learning an-
alytics ecosystem. In Companion Proceedings of the
9th International Learning Analytics and Knowledge
Conference (LAK’19), pages 513 – 519.
Najafi, H., Evans, R., and Federico, C. (2014). MOOC in-
tegration into secondary school courses. The Inter-
national Review of Research in Open and Distributed
Learning, 15(5).
Ros
´
e, C. P., Carlson, R., Yang, D., Wen, M., Resnick, L.,
Goldman, P., and Sherer, J. (2014). Social factors that
contribute to attrition in MOOCs. In Proceedings of
the first ACM conference on Learning@ scale confer-
ence, pages 197–198. ACM.
Ruip
´
erez-Valiente, J. A., Halawa, S., and Reich, J. (2019).
Multiplatform MOOC analytics: Comparing global
and regional patterns in edX and Edraak.
Sclater, N., Peasgood, A., and Mullan, J. (2016). Learning
Prior Knowledge as a Predictor for Persistence
143

analytics in higher education. London: Jisc. Accessed
February, 8:2017.
Siemens, G. (2013). Learning analytics: The emer-
gence of a discipline. American Behavioral Scientist,
57(10):1380–1400.
Smith, IV, D. H., Hao, Q., Jagodzinski, F., Liu, Y., and
Gupta, V. (2019). Quantifying the effects of prior
knowledge in entry-level programming courses. In
Proceedings of the ACM Conference on Global Com-
puting Education, CompEd ’19, pages 30–36, New
York, NY, USA. ACM.
Taylor, W. L. (1953). “cloze procedure”: A new
tool for measuring readability. Journalism Bulletin,
30(4):415–433.
Vihavainen, A., Luukkainen, M., and Kurhila, J. (2013).
MOOC as semester-long entrance exam. In Pro-
ceedings of the 14th annual ACM SIGITE conference
on information technology education, pages 177–182.
ACM.
Wen, M., Yang, D., and Ros
´
e, C. P. (2014). Linguistic re-
flections of student engagement in massive open on-
line courses. In Eighth International AAAI Conference
on Weblogs and Social Media.
Wojciechowski, A., Palmer, L. B., et al. (2005). Individ-
ual student characteristics: Can any be predictors of
success in online classes. Online journal of distance
learning administration, 8(2):13.
Yang, D., Wen, M., Howley, I., Kraut, R., and Rose, C.
(2015). Exploring the effect of confusion in discussion
forums of massive open online courses. In Proceed-
ings of the second (2015) ACM conference on learn-
ing@ scale, pages 121–130. ACM.
CSEDU 2020 - 12th International Conference on Computer Supported Education
144
