
Sweat Detection with Thermal Imaging for Automated Climate Control
and Individual Thermal Comfort in Vehicles
Diana Schif
1
, Ulrich Theodor Schwarz
2
and Holger Forst
1
1
BMW AG, Knorrstraße, Munich, Germany
2
Department of Physics, TU Chemnitz, Chemnitz, Germany
Keywords:
Sweat, Perspiration, Thermal Imaging, Thermal Comfort, Vehicle.
Abstract:
In addition to autonomous driving, the automation of comfort functions is currently one of the development
focuses of the automotive industry. In particular, the automation of the climate function is considered, as
manual operation often leads to distraction from the driving task. In order to implement this automation,
various data about the vehicle interior and the occupants are needed. Besides interior temperature, gender or air
speed, the sweat status of the occupants is relevant. In this work it is examined to what extent the sweat status
can be detected with the help of a thermal imaging camera. The aim is to show if it is possible to distinguish
the status not sweating, shortly before sweating and sweating using thermal imaging. For this the part of the
thermal image showing the forehead is analyzed. More specifically, the difference between minimum and
maximum temperature is compared for the different sweat statuses. At an ambient air temperature of 21 °C
the thermal comfort level and sweat status of 20 subjects is inquired and skin temperature is measured by a
thermal camera during sport activity. Results indicate that there is a significant difference (p < 0.05) between
status not sweating and shortly before sweating and also between status not sweating and sweating. Sweat
can therefore be detected with the help of thermal imaging cameras. This result provides important input for
automated air conditioning. If sweat is detected for one or more occupants, then with the climate control a
corresponding regulation can take place to dry the sweat and to prevent further sweating.
1 INTRODUCTION
Autonomous driving is currently the focus of the au-
tomotive industry. But in addition to the autonomous
vehicle, the interior is more and more automated to
keep the overall value within the vehicle constant. So
the aim is to design and set an ideal interior for each
occupant. Functions such as the automatic seat ad-
justment, individual massage functions, and also the
independent adjustment of the climate control are de-
veloped. Especially when setting the air condition-
ing, the driver can easily be distracted from the road
and the driving task. Another problem with manually
handling the climate in the car is that a wrong tem-
perature tends to reduce the attention state (Dentel
and Dietrich, 2013), (van Hoof, 2008). Both results
in an increased risk for car accidents. To minimize
this risk, the climate control in vehicle should have a
personalized temperature, personalized air outlets and
personalized air flow. Therefore an automated system
has to recognize the individual demand for thermal
comfort. Thermal comfort is a subjective sensation
and is defined as the condition in which satisfaction is
expressed with the thermal environment (ASHRAE,
2004), (Epstein and Moran, 2006). To ensure this,
much information about the individual behavioral fac-
tors and also the interior of the vehicles, so called
environmental factors, has to be known. For the in-
cabin space, the ambient temperature, radiant temper-
ature, air humidity and air movement speed is relevant
(Fanger, 1970), (Epstein and Moran, 2006). Currently
all these environmental parameters are measured by
different sensors in the car. But to automate the com-
plete system, we also need information about the be-
havioral factors from the individual persons in the car.
These include:
• Age, Origin, Sex (Nakano et al., 2002), (Kar-
jalainen, 2007), (De Dear, 2004);
• Clothing (Fanger, 1970);
• Arousal Level, Emotion (Fanger, 1970), (Ebisch
et al., 2012), (Merla and Romani, 2007);
• Size, Weight (Fiala et al., 2001);
Schif, D., Schwarz, U. and Forst, H.
Sweat Detection with Thermal Imaging for Automated Climate Control and Individual Thermal Comfor t in Vehicles.
DOI: 10.5220/0009324004250431
In Proceedings of the 6th International Conference on Vehicle Technology and Intelligent Transport Systems (VEHITS 2020), pages 425-431
ISBN: 978-989-758-419-0
Copyright
c
2020 by SCITEPRESS – Science and Technology Publications, Lda. All rights reserved
425

• Sweating (Fanger, 1970), (Djongyang et al.,
2010).
It is possible to detect most of the required data
like age, sex, clothing, and arousal with an RGB cam-
era or a time of flight camera. But there is little in-
formation in literature about measuring methods for
sweat especially without direct contact to the human
skin. Sweating or perspiration is apart from shiv-
ering the main mechanism for regulating body core
temperature (Kuno, 1934). If the body core temper-
ature is too high, down-regulation of this tempera-
ture is the most important role of perspiration. Dur-
ing sweating, thermal energy is released by evapora-
tion of water from the surface of the skin, so that the
skin and also the body core temperatures are lowered.
Besides for regulating the body core temperature be-
cause of extreme ambient temperature or physical ac-
tivity, sweating can be stimulated by emotional stress
or spicy food (Kuno, 1934), (Wilke et al., 2007). The
cooling process on the skin is especially visible on
the human face, because of a high number of sweat
glands (Wilke et al., 2007). Hence the process of
sweating should be visible on the thermal image of
the face. In the vehicle a contact free measurement
is important to not interfere with the driver and the
other passengers. So placing a humidity sensor or a
thermocouple on the forehead is obviously not fea-
sible. Another possibility is to include these sensors
in the car seat. But then the sensor cannot measure
the temperature on the skin because it is covered with
clothes. In addition one goal of the automobile in-
dustry is to detect many attributes with one sensor,
instead of having specialized sensors for each func-
tion. Concerning this matter a camera for example
can not only detect sex, body parts, and emotions, it
can also detect temperature and sweat, especially with
a thermal camera. The thermal camera is measuring
the skin temperature with infrared thermography. In-
frared cameras generate thermal images by electro-
magnetic waves (Fern
´
andez-Cuevas et al., 2015). The
measured radiation is directly related to skin temper-
ature. The research question is to find out if there is
a significant difference on the thermal images during
not sweating, shortly before sweating and sweating.
The dependent variable is the sweat status and the in-
dependent variable is the facial skin temperature.
2 STUDY DESIGN AND METHOD
2.1 Subjects
14 male and 6 female volunteers between 20 and
45 years were recruited to participate in the experi-
ment. All subjects were free of any known cardiac
abnormalities. Verbal and written informed consent
was obtained from each subject. Subjects wore regu-
lar sportswear like a sport shirt, trainers and running
shorts or leggings.
2.2 Instrumentation
Subjects face skin temperature was measured with a
thermal camera (Thermal Expert Q1). The face was
chosen as a measuring point, as it is usually not cov-
ered by clothing. Especially in the forehead area
where you can find a lot of sweat glands (Machado-
Moreira et al., 2008). Another positive aspect of fo-
cusing onto the forehead is that in most cases the area
is not covered by facial hair. The representation of
the thermal camera image is a false color image. In
this study we used a color map where colder tempera-
tures are represented as more red to purple colors and
higher temperatures are represented as more orange
and yellow. The camera was installed in a car’s rear
view mirror area. During the measurement the subject
was seated in a car, viewing to the camera and breath-
ing deeply while not talking. The measure interval
was 2.5 minutes (Sammito and B
¨
ockelmann, 2015),
(Liu et al., 2011).
Besides of thermal image measurement, different
biofeedback indicators (HasoMed) were tracked. A
blood-volume-pulse sensor was attached to the left
hand and a skin conductance sensor on the right hand.
The biofeedback sensors were included in the mea-
surement for having a reference for sweating. In this
paper only the subjective sweat status from the ques-
tionnaire was used to analyze the possibility of sweat
measurement via thermal image and not the biofeed-
back data. Air temperature and air humidity were kept
as stable as possible throughout the experiments.
2.3 Experimental Protocol
The experiment was performed in a climate chamber
with 21 °C and approximately 50 % air humidity dur-
ing May to July. Each subject needed 1.5 hours for
the experiment. The experiment was done for one or
maximum two subjects on a single day.
Before the experiment was started, the subject
had 15 minutes time to accommodate to the climate
chambers temperature. During this time the subject
changed clothes and filled out the letter of consent.
After that, the main part of the study started. First
question for each participant was about thermal com-
fort with ASHRAE scale. ASHRAE scale is a 7-point
scale used for occupant thermal sensation vote. The
scale is based on a measure how cold or how hot the
VEHITS 2020 - 6th International Conference on Vehicle Technology and Intelligent Transport Systems
426
subjects feel. Subjects can choose between cold, cool,
slightly cool, neutral, slightly warm, warm, and hot.
In literature a sensation vote of cold, cool, warm and
hot is connected with uncomfortable feeling in the
ambient condition (Liu et al., 2011). Whereas a sen-
sation vote of slight cool, neutral, and slightly warm
represents a comfortable ambient condition. The ther-
mal comfort question was followed by the question
about individual sweat status. The sweat status was
differentiated between not sweating, shortly before
sweating and sweating. The scale was a modification
from the questionnaire by (Nielsen et al., 1989). Af-
ter the questions the first measurement started. The
subjects were seated in a BMW 7 series on drivers
place. After the first sensor measurement the subjects
got out of the car and started a high intensive interval
training (HIIT) for 1 minute and 50 seconds. Then
the thermal comfort and the sweat status were queried
again. If the sweat status changed, the subject had to
go back to the car seat to measure the second sweat
status (shortly before sweating). If the status didn’t
change, another HIIT part with 1 minute 50 seconds
was started. This was repeated until the sweat status
sweating was accessed. Then a last measurement in
the car was made and the study was finished. The
work resulted in a collection of 60 recordings with
three sweat status recordings for each of the 20 par-
ticipants.
2.4 Method
To find out a significant difference between the differ-
ent perspiration statuses, the face was recorded with
the thermal camera. For each of the 60 recordings a
part of the forehead area was cut from the image and
analyzed for specific values like the minimum temper-
ature in the area, the maximum temperature, and the
average value. The minimum temperature is impor-
tant as it represents the cooling process of sweating.
Sweating causes perspiration to come out of the sweat
glands on the forehead. The sweat, which mainly con-
sists of water (Kuno, 1934), cools directly when evap-
orating. This has a cooling effect on the body core
temperature. In addition, the cooling effect is directly
visible on the thermal image. The maximum values
on the forehead vary less strongly due to the perspi-
ration status. This increases the difference between
the minimum and maximum temperature values due
to the onset of sweating.
3 RESULTS
First, the results of the subjective perspiration status
and the associated thermal comfort vote are evaluated.
The results show that with increasing sweating the
condition is described as less comfortable. When not
sweating, most subjects feel more comfortable than
with the status shortly before sweating and sweating.
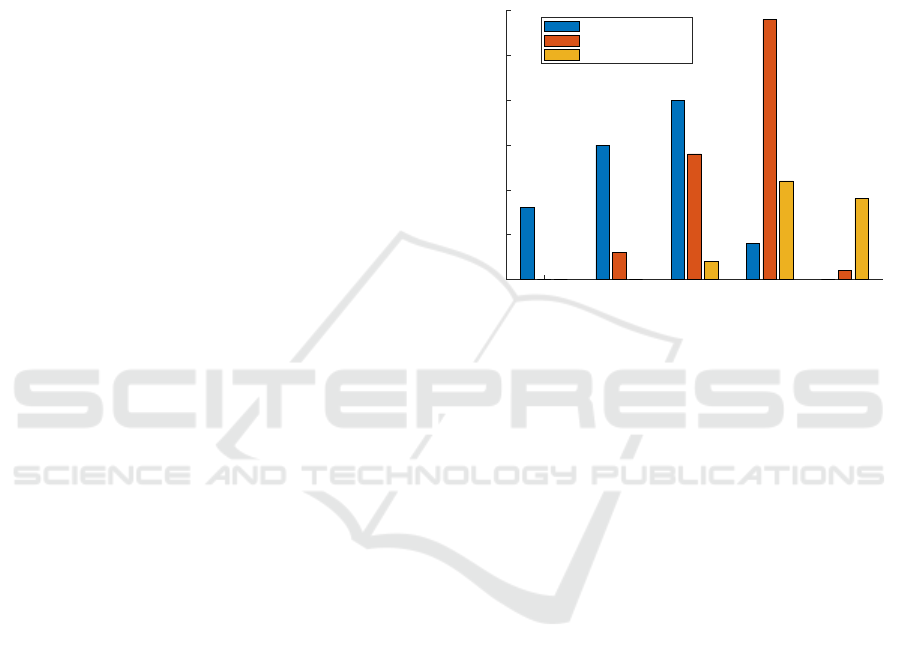
Figure 1 illlustrates this fact.
slightly cool
neutral
slightly warm
warm
hot
thermal comfort vote
0
5
10
15
20
25
30
frequency
not sweating
shortly before sweating
sweating
Figure 1: Thermal Comfort with Different Sweat Status
of the Individual Subjects. When Sweating Is Starting the
Comfort Level Tends to Be More Warm and Hot. Without
Sweating the Comfort State Is More Neutral and Comfort-
able.
Next, the recorded thermal images are evaluated
in detail. The subjects came on average after 2.1 sport
intervals to the status shortly before sweating and af-
ter 4.6 intervals to the status of sweating. Some par-
ticipants sweat already after the second sports inter-
val and others after the seventh. The subjects most
often start to sweat after the sixth sports interval. This
shows that the onset of sweating is individually differ-
ent, which is consistent with results from the literature
(Kuno, 1934). The thermal images show that there is a
visible difference in temperature depending on sweat
status. Not sweating forehead areas have a lower tem-
perature, visible as a more yellow color on the false
color rendering and the sweating forehead areas have
a warmer and more blotchy temperature distribution
as seen in figure 2. This is related to the high number
of sweat glands on the forehead (Machado-Moreira
et al., 2008),(Thomson, 1954).
The average values over all subjects for the min-
imum, maximum and average temperature for each
sweat status are shown in table 1.
On the sweating forehead image some locations
are still yellow caused by the less strong variation of
the maximum temperature. This is because the distri-
Sweat Detection with Thermal Imaging for Automated Climate Control and Individual Thermal Comfort in Vehicles
427
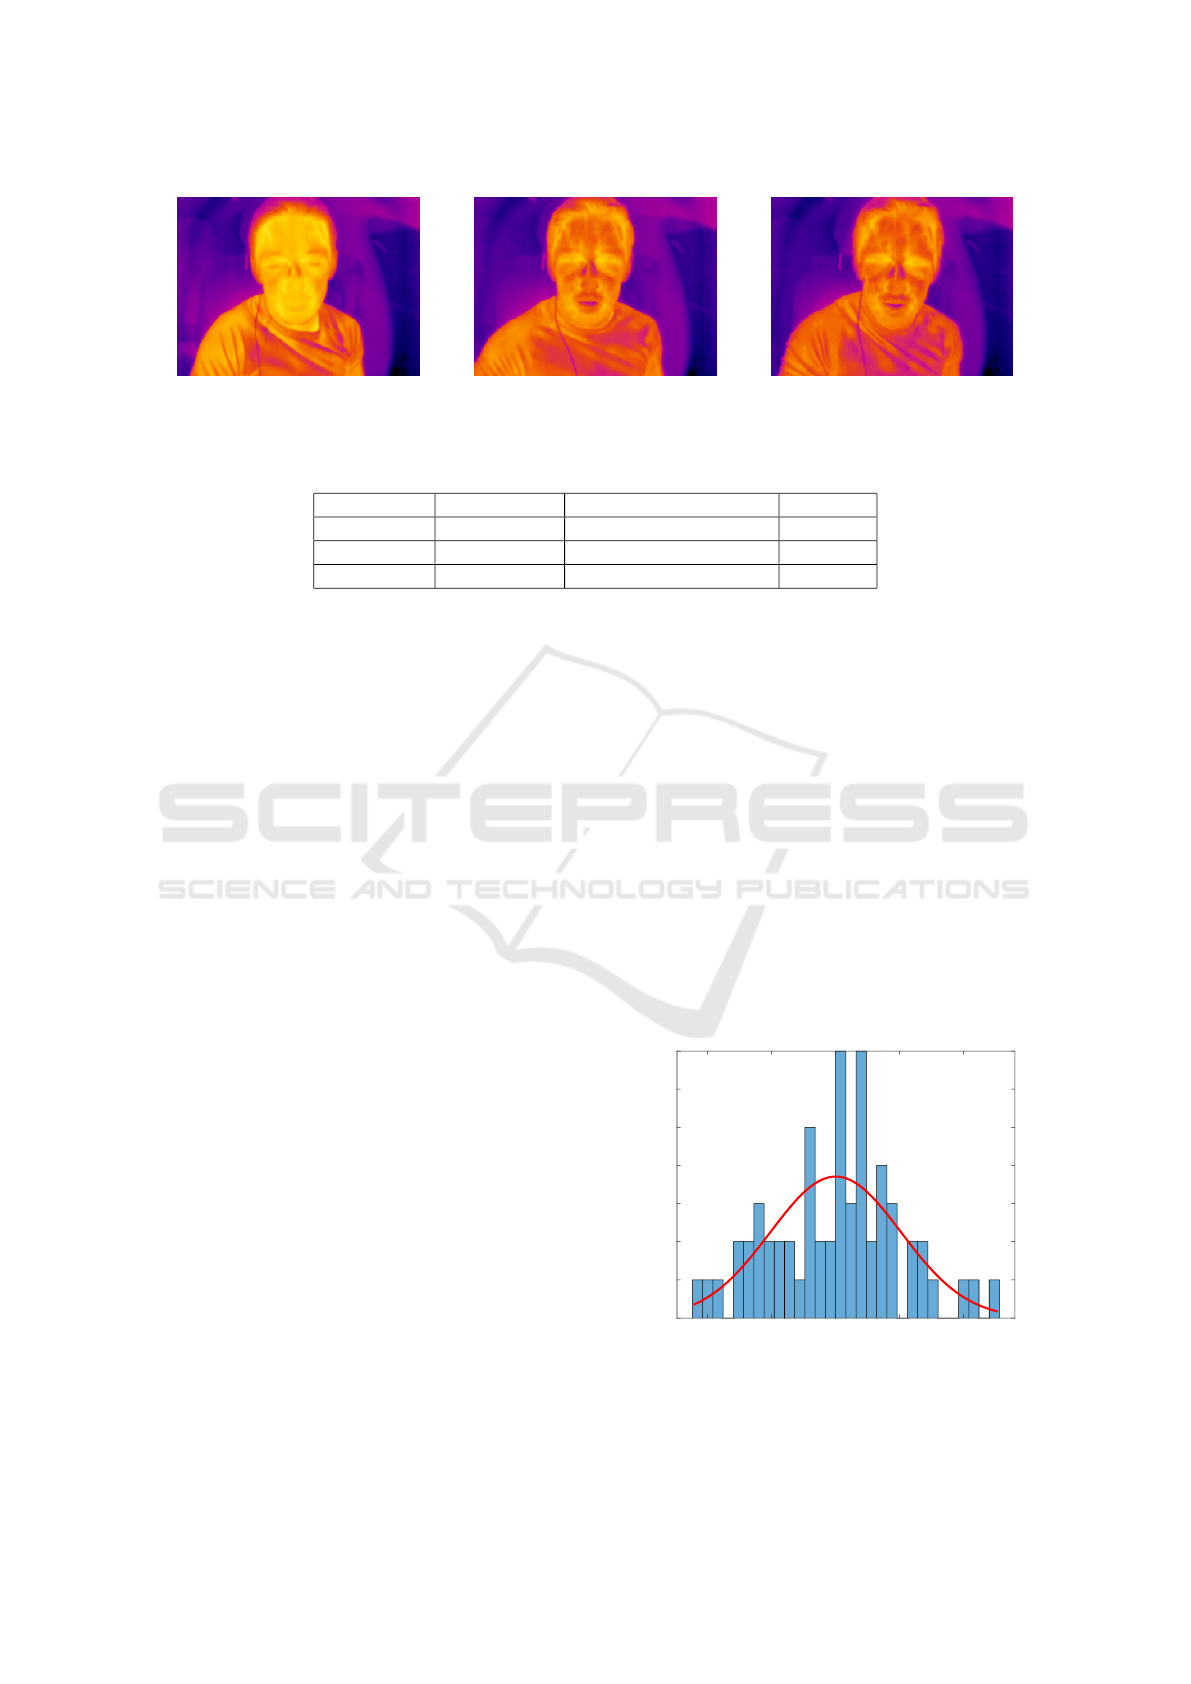
Figure 2: Thermal Images of Face during Study. From Left to Right: Status “not Sweating”, “shortly before Sweating” and
“sweating”. the Color on the Forehead Changes from Yellow to More Orange and Red. This Represents the Cooling Process
Caused by the Sweating.
Table 1: Minimum, Maximum and Average Temperature Values in Forehead Area during the Different Sweat Statuses.
Not sweating Shortly before sweating Sweating
T
Min
in [°C] 33.66 31.20 30.82
T
Max
in [°C] 35.08 33.66 33.23
T
Avg
in [°C] 34.41 32.45 32.19
bution of the sweat glands on the head and thus also
on the forehead is individual and not uniform (Ran-
dall, 1946). So the difference between minimum and
maximum temperature in this area is a good indica-
tor for sweating. The bigger the difference, the more
sweat is on the humans face. Because of that, the
difference between maximum and minimum forehead
area temperature is analyzed for a significance test.
The next table 2 shows the differences for each sweat
status.
To find out whether there is a significant difference
on the thermal image between the different sweat sta-
tuses a 1-way analysis of variance (ANOVA) for re-
peated measures is used. The SPSS program is em-
ployed to make the statistical analysis and alpha is set
at < 0.05 level.
The variance analysis with repeated measure-
ments (assumed sphericity: Mauchly-W (2) = .844,
p = .218) shows that the sweat status is related to
the temperature difference on the forehead (F (2.28)
= 51.656, p = .00, η
2
p
= .731, n = 20). The η
2
p
says that 73.1% of the variation between the sweating
states can be explained via the temperature difference.
Bonferroni-corrected pairwise comparisons show that
the sweat status not sweating (M = 1.43, SD = 0.32) is
significantly higher than shortly before sweating (M =
2.47, SD = 0.60) and sweating (M = 2.69, SD = 0.60).
It can be seen that the temperature difference between
not sweating and shortly before sweating (p < .05)
and not sweating and sweating (p < .05) differ signif-
icantly. In contrast, the temperature difference does
not differ significantly between these two measuring
times shortly before sweating and sweating (p = .46).
The effect size f according to Cohen (1988) is 1.65
and corresponds to a strong effect. In order to con-
sider the unexplained variance and to check whether
another factor influences the change in the tempera-
ture difference, the residuals and their distribution are
considered. The histogram of the residuals is shown
below in Figure 3, including a normal distribution
curve (red). The residuals are normally distributed,
as assessed by the Kolmogorov-Smirnov test showed
(α = .01, p = .03). It is therefore assumed that there is
no missing variable that has an influence on the cal-
culation. This means that no data transformation has
to be carried out.
The biofeedback data is used as a kind of refer-
ence to the subjective perspiration status. The evalua-
tion of the skin conductance data indicate an increase
with increasing sweating. From the measurement of
the blood volume pulse sensor, heart rate variability
(HRV) data is considered. In particular, the time-
based RMSSD value and the frequency-based LF/HF
rate is evaluated. RMSSD is the square root of the
mean squared differences of the successive heartbeat
histogram for residuals
-1 -0.5 0 0.5 1
residue temperature difference
0
1
2
3
4
5
6
7
frequency
Figure 3: Histogram for the Residuals with Normal Distri-
bution. It Can Be Seen, That the Residues Follow a Nor-
mal Distribution. A Kolmogorov-Smirnov Test with α =
.01 Also Reflects This.
VEHITS 2020 - 6th International Conference on Vehicle Technology and Intelligent Transport Systems
428
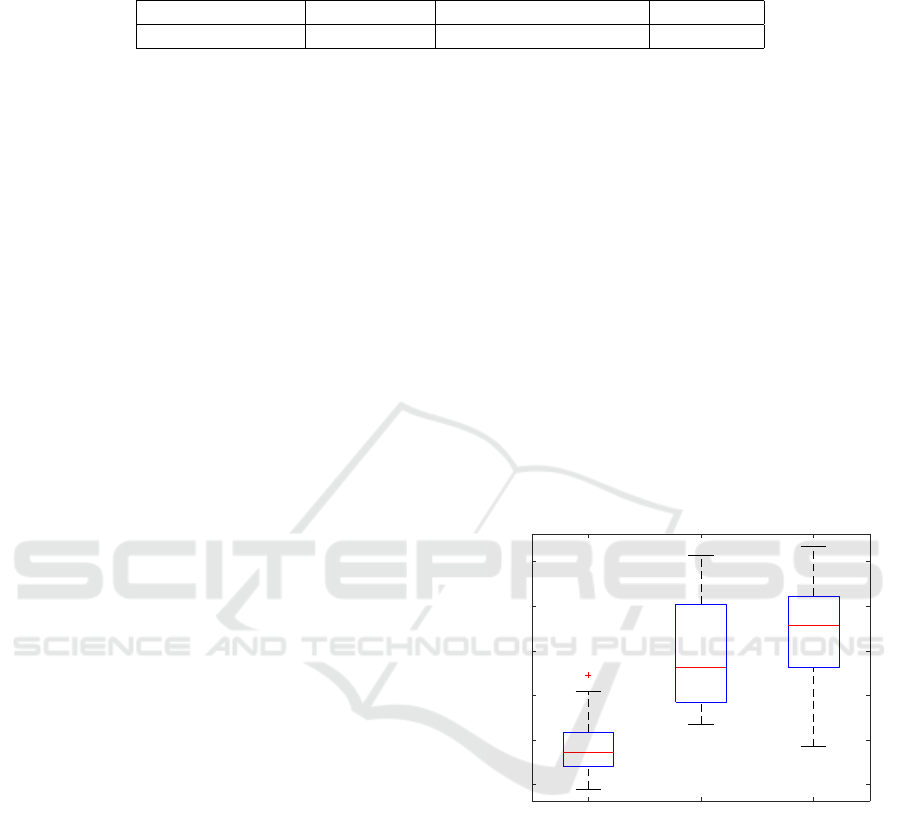
Table 2: Descriptive Statistics for the Difference between Maximum and Minimum Temperature in the Forehead Area with
Mean and Standard Deviation (SD) for Different Sweat Statuses.
Not sweating Shortly before sweating Sweating
Mean ± SD in [K] 1.43 ± 0.31 2.47 ± 0.58 2.69 ± 0.58
interval (Bricout et al., 2010). LF/HF ratio reflects the
balance of the autonomic nervous system with the low
frequency part (LF), which is representing the parasy-
mathetic and sympathetic activities (Pomeranz et al.,
1985) and the high frequency part (HF), which is rep-
resenting the parasympathetic activity. As described
in the literature (Liu et al., 2008), (Liu et al., 2011),
(Nkurikiyeyezu et al., 2018), (Bricout et al., 2010),
the RMSSD value decreases with sweating and the
LF/HF rate increases.
4 DISCUSSION
The results show, that there is a significant difference
between status not sweating and shortly before sweat-
ing and also between status not sweating and sweat-
ing. The study found no significant difference be-
tween the status shortly before sweating and sweat-
ing. One possible reason for this could be the study
design, because the subject has passed about 2 min-
utes between the query of the perspiration status and
the actual measurement. During this time, the sub-
ject was sit into the vehicle and the sensors were put
on. One possibility would be, that the sweating has
set within this 2 minute time break and thus the sec-
ond measurement time actually represents the status
of sweating. Therefore, in the following discussion
only between not sweating and sweating is differenti-
ated. The status shortly before sweating is counted to
status sweating.
For a final decision if a person is sweating or not,
the temperature difference is not perfect, because of
overlapping values for both statuses. In the follow-
ing boxplot (figure 4) it is possible to see the critical
values. Critical values are all the values appearing
in status not sweating and also status sweating. For
finding a criterion to differ between the statuses only
with the temperature difference, it is possible to use
the boxplot boxes without the whiskers as a criterion
for status sweating or not sweating. If the tempera-
ture difference on the forehead is lower than 1.58 K
the subject is detected as not sweating. If the value is
higher than 1.96 K the subject is identified as sweat-
ing. Between these two values the status is unclear.
For these data sets, with these limits, sweat sta-
tus can be correctly distinguished between status not
sweating and status sweating in 78% of cases. In 17%
of the recorded images, no precise statement can be
made because the value lies between the two limits.
Only 5% of the images would be misclassified with
the decision support.
With the given thermal images, other data can be
used to differentiate the sweating status in addition
to the temperature. For example, spotting can be de-
tected using a frequency analysis and can therefore be
used as a further decision factor. The results of this
will be presented in further publications.
For having a more accurate decision of the sys-
tem, other values like heart rate variability or skin
conductance are interesting to know. In addition to
the method of sweat detection based on the tempera-
ture difference on the forehead, there are other ways
to detect whether a person is sweating or not. For ex-
ample, the average temperature value of the forehead
area can be considered or also the spatial frequency
over the area can be analyzed. These possibilities are
currently being evaluated in detail.
not sweating shortly before sweating sweating
time of measurement
1
1.5
2
2.5
3
3.5
temperture difference in [K]
Figure 4: Boxplot of the Different Sweat Status. The Values
Show the Difference between the Minimum and Maximum
Temperature for a Forehead Area. The Higher the Differ-
ence Value, the More Sweating.
Further investigation handle with sweat detection
using a machine learning algorithm. For this, the
recorded images of the subjects and the forehead ar-
eas are labeled and then a network is taught.
5 CONCLUSION
This work investigates whether it is possible to detect
in the vehicle if an occupant is sweating or not. To
Sweat Detection with Thermal Imaging for Automated Climate Control and Individual Thermal Comfort in Vehicles
429

test this, a study was designed that records the indi-
vidual subjects in different sweat status using a ther-
mal imaging camera. For evaluation a forehead area
is used to find out the difference between the maxi-
mum and minimum temperature. Due to the set deci-
sion thresholds, 78% of the images can be classified
correctly. This means that then the status not sweat-
ing was distinguished from sweating. The result also
shows that there is a significant difference between
the sweating and the non-sweating subjects based on
a temperature difference in a forehead area. With this
result, an important step in the direction of climate
automation is done. For this automation, in addi-
tion to already known interior data and personal data,
data about the sweat status of the various occupants
is required. So far, there was no way to detect this
status without contact. Only humidity sensors and
thermocouples were previously used for sweat detec-
tion. With the non-contact sweat detection by thermal
imaging cameras, it can be easily detected in the vehi-
cle, which climate setting is suitable for the individual
occupants.
Since the presented method found only a recog-
nition accuracy of 78%, further alternative methods
are examined to increase the accuracy. Other alterna-
tives of sweat detection without thermal camera are
currently under investigation.
REFERENCES
ASHRAE (2004). ASHRAE handbook fundamentals: At-
lanta, american society of heating. Refrigeration, and
Air Conditioning Engineers, (ANSI/ASHRAE Stan-
dard 55-2004).
Bricout, V.-A., DeChenaud, S., and Favre-Juvin, A. (2010).
Analyses of heart rate variability in young soccer play-
ers: the effects of sport activity. Autonomic Neuro-
science, 154(1-2):112–116.
De Dear, R. (2004). Thermal comfort in practice. Indoor
air, 14(7):32–39.
Dentel, A. and Dietrich, U. (2013). Thermische Be-
haglichkeit – Komfort in Geb
¨
auden. Dokumentation
Primero–Komfort. Hamburg, HafenCity Universit
¨
at,
Institut f
¨
ur Energie und Geb
¨
aude.
Djongyang, N., Tchinda, R., and Njomo, D. (2010). Ther-
mal comfort: A review paper. Renewable and sustain-
able energy reviews, 14(9):2626–2640.
Ebisch, S. J., Aureli, T., Bafunno, D., Cardone, D., Romani,
G. L., and Merla, A. (2012). Mother and child in syn-
chrony: thermal facial imprints of autonomic conta-
gion. Biological psychology, 89(1):123–129.
Epstein, Y. and Moran, D. S. (2006). Thermal comfort and
the heat stress indices. Industrial health, 44(3):388–
398.
Fanger, P. O. (1970). Thermal comfort. Analysis and appli-
cations in environmental engineering. Copenhagen,
Danish Technical Press.
Fern
´
andez-Cuevas, I., Marins, J. C. B., Lastras, J. A., Car-
mona, P. M. G., Cano, S. P., Garc
´
ıa-Concepci
´
on,
M.
´
A., and Sillero-Quintana, M. (2015). Classifica-
tion of factors influencing the use of infrared thermog-
raphy in humans: A review. Infrared Physics & Tech-
nology, 71:28–55.
Fiala, D., Lomas, K. J., and Stohrer, M. (2001). Com-
puter prediction of human thermoregulatory and tem-
perature responses to a wide range of environmental
conditions. International journal of biometeorology,
45(3):143–159.
Karjalainen, S. (2007). Gender differences in thermal com-
fort and use of thermostats in everyday thermal en-
vironments. Building and environment, 42(4):1594–
1603.
Kuno, Y. (1934). Physiology of human perspiration. J. And
A. Churchill: London.
Liu, W., Lian, Z., Deng, Q., and Liu, Y. (2011). Evaluation
of calculation methods of mean skin temperature for
use in thermal comfort study. Building and Environ-
ment, 46(2):478–488.
Liu, W., Lian, Z., and Liu, Y. (2008). Heart rate variability
at different thermal comfort levels. European journal
of applied physiology, 103(3):361–366.
Machado-Moreira, C. A., Wilmink, F., Meijer, A., Mek-
javic, I. B., and Taylor, N. A. (2008). Local differ-
ences in sweat secretion from the head during rest
and exercise in the heat. European journal of applied
physiology, 104(2):257–264.
Merla, A. and Romani, G. L. (2007). Thermal signatures
of emotional arousal: a functional infrared imaging
study. In 2007 29th Annual International Conference
of the IEEE Engineering in Medicine and Biology So-
ciety, pages 247–249. IEEE.
Nakano, J., Tanabe, S.-i., and Kimura, K.-i. (2002). Dif-
ferences in perception of indoor environment between
japanese and non-japanese workers. Energy and
Buildings, 34(6):615–621.
Nielsen, R., Gavhed, D. c., and Nilsson, H. (1989). Ther-
mal function of a clothing ensemble during work: de-
pendency on inner clothing layer fit. Ergonomics,
32(12):1581–1594.
Nkurikiyeyezu, K. N., Suzuki, Y., and Lopez, G. F. (2018).
Heart rate variability as a predictive biomarker of ther-
mal comfort. Journal of Ambient Intelligence and Hu-
manized Computing, 9(5):1465–1477.
Pomeranz, B., Macaulay, R., Caudill, M. A., Kutz, I.,
Adam, D., Gordon, D., Kilborn, K. M., Barger, A. C.,
Shannon, D. C., and Cohen, R. J. (1985). Assessment
of autonomic function in humans by heart rate spec-
tral analysis. American Journal of Physiology-Heart
and Circulatory Physiology, 248(1):H151–H153.
Randall, W. C. (1946). Quantitation and regional distribu-
tion of sweat glands in man. The Journal of clinical
investigation, 25(5):761–767.
Sammito, S. and B
¨
ockelmann, I. (2015). Analyse der
Herzfrequenzvariabilit
¨
at. Herz, 40(1):76–84.
VEHITS 2020 - 6th International Conference on Vehicle Technology and Intelligent Transport Systems
430

Thomson, M. (1954). A comparison between the number
and distribution of functioning eccrine sweat glands
in europeans and africans. The Journal of physiology,
123(2):225.
van Hoof, J. (2008). Forty years of fangers model of thermal
comfort: comfort for all? Indoor Air, 18:182–201.
Wilke, K., Martin, A., Terstegen, L., and Biel, S. (2007).
A short history of sweat gland biology. International
journal of cosmetic science, 29(3):169–179.
Sweat Detection with Thermal Imaging for Automated Climate Control and Individual Thermal Comfort in Vehicles
431
