
Online Automatic Characteristics Discovery of Faulty Application
Transactions in the Cloud
Shay Horovitz
1 a
, Yair Arian
2 b
and Noam Peretz
2 c
1
School of Computer Science, College of Management Academic Studies, Israel
2
Huawei, China
Keywords:
Application Faults, Transaction, Cloud, Insights, Online.
Abstract:
Performance debugging and fault isolation in distributed cloud applications is difficult and complex. Existing
Application Performance Management (APM) solutions allow manual investigation across a huge space of
metrics, topology, functions, service calls, attributes and values - a frustrating resource and time demanding
task. It would be beneficial if one could gain explainable insights about a faulty transaction whether due to
an error or performance degradation, such as specific attributes and/or url patterns that are correlated with the
problem and can characterize it. Yet, this is a challenging task as demanding resources of storage, memory and
processing are required and insights are expected to be discovered as soon as the problem occurs. As cloud
resources are limited and expensive, supporting a large number of applications having many transaction types
is impractical. We present Perceptor – an Online Automatic Characteristics Discovery of Faulty Application
Transactions in the Cloud. Perceptor discerns attributes and/or values correlated with transaction error or
performance degradation events. It does so with minimal resource consumption by using sketch structures and
performs in streaming mode. Over an extensive set of experiments in the cloud, with various applications and
transactions, Perceptor discovered non-trivial relevant fault properties validated by an expert.
1 INTRODUCTION
Cloud application performance degradation and fault
debugging is a challenging task becoming more
widely spread with the migration of applications to
the cloud. Even when transaction trace data is avail-
able there are many transactions and attributes mak-
ing it difficult to discern the attributes and the values
related to a problem. In the current state of debug-
ging large scale distributed system, there are tools like
PinPoint (Chen et al., 2002) and other APM tools that
present application topology, monitor the application
in real-time, and install APM agents without requir-
ing code modification by using instrumentation. The
instrumentation data collection can be implemented
using a tracing mechanism (Leavitt, 2014). For appli-
cation developers, traces contain valuable information
that may explain the reason for a transaction failure or
performance degradation.
In Figure 1 a simple web application is presented.
a
https://orcid.org/0000-0002-9285-3937
b
https://orcid.org/0000-0003-4720-656X
c
https://orcid.org/0000-0002-9867-4446
OpenTracing agents track the trace of each transac-
tion and report it using for example the Zipkin format.
The Publish-Subscribe (Yongguo et al., 2019) plat-
form assembles and distributes the transaction data in
streaming mode. Perceptor - an insights engine, re-
ceives per transaction trace data from which it extracts
insights. The insights produced by Perceptor are dis-
played to the user to help in the debugging process.
In the figure, the rows with green bullets display pa-
rameter values typical of the normal (no faults) traffic,
while the red contain the same parameters but with
values typical of faulty transactions. For instance,
the URL parameter values in the buy transaction have
a range [1001-1991] in the Normal traffic while in
faulty traffic the range is [1-531].
Other insight types include certain SQL query
structure or parameter values that may be linked with
database performance issues or HTTP specific status
codes and user-agent values that may be related to
transaction errors. Such insights on the correlation
between certain values and errors or performance is-
sues are essential in order to narrow down the poten-
tial causes. Yet, a cloud service may contain mil-
lions of customers or applications, each may con-
Horovitz, S., Arian, Y. and Peretz, N.
Online Automatic Characteristics Discovery of Faulty Application Transactions in the Cloud.
DOI: 10.5220/0009320402450252
In Proceedings of the 10th International Conference on Cloud Computing and Services Science (CLOSER 2020), pages 245-252
ISBN: 978-989-758-424-4
Copyright
c
2020 by SCITEPRESS – Science and Technology Publications, Lda. All rights reserved
245
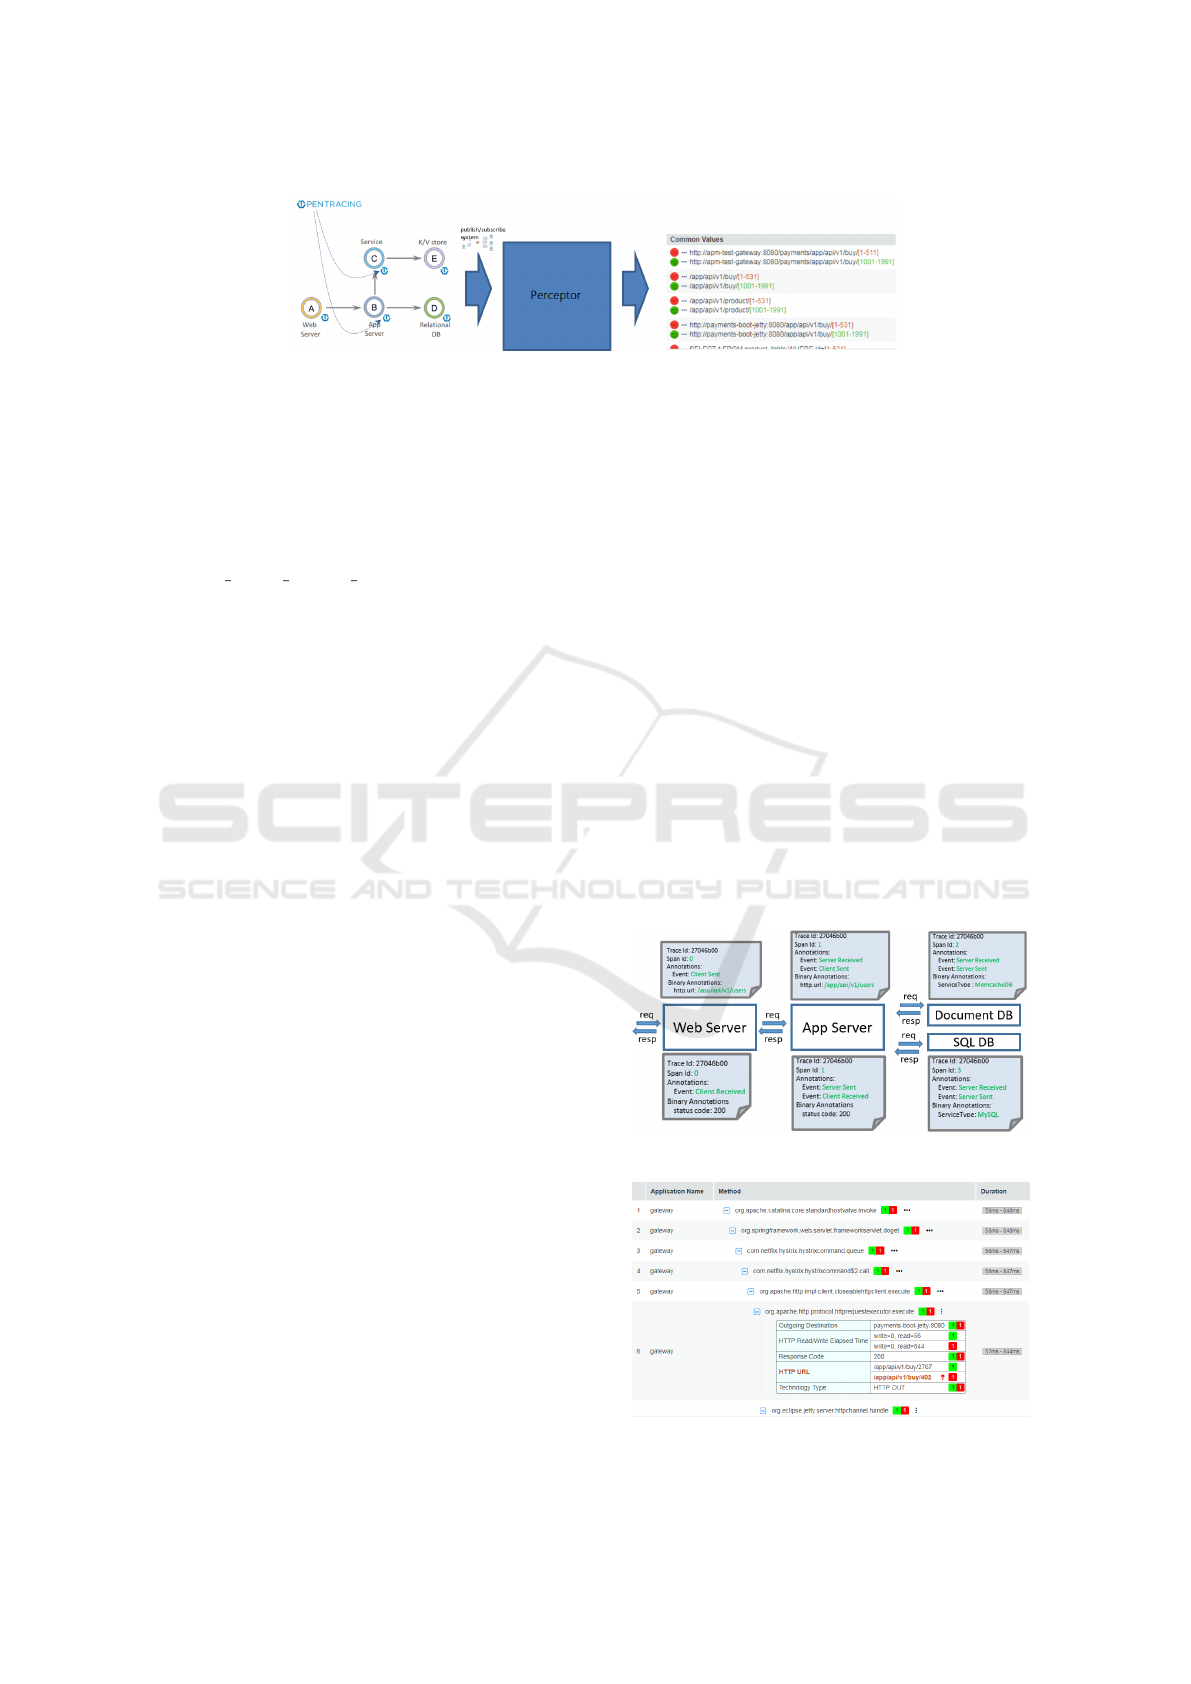
Figure 1: High-Level Insights Process.
tain tens of transaction types, where each transaction
trace may have tens of spans (trace data structure)
and each span contains tens of Key:Value attributes,
thus it would be challenging to manually track for
the attribute values that may link to a certain prob-
lem. A Zipkin trace is denoted here as a Call Chain,
with annotations as Key:Value attributes. For exam-
ple, CPU QUEUE LENGTH AVG represents the average
CPU queue length with a value of 0.8.
Traversing through all of the above instrumented
data and extracting values that are related to the trans-
action faults is tedious. This challenge calls for an
automatic solution that would scan all call-chain data
and filter only the key-value pairs that are highly cor-
related with problems. Perceptor is designed for au-
tomating the discovery of insights that characterize
the faulty transaction call-chain attribute values. Per-
ceptor analyses call chain data (attribute value pairs)
of each transaction and compares the presence and
value of each attribute under normal transaction op-
eration (denoted ”good” transaction) with the values
under faulty conditions (denoted ”bad” transaction)–
such as errors or performance degradation. It does
so online in streaming mode by employing an ef-
ficient data structure for accumulating statistics on
each attribute using a collection of sketch data struc-
tures (Count Min Sketch, histogram, Linear Count-
ing) for minimal memory footprint. The attributes in
the Call Chain, to name a few, include HTTP Url,
Tier Name, Host Name, Service Instance, Method
Name, Response Code, HTTP Status Code etc. For
each transaction, its key-value pairs are aggregated in
a sketch data structure. Perceptor deduces insights
by comparing counts of an attribute that differ be-
tween the “bad” sketch and the “good” sketch in a
statistically significant amount. For example, for at-
tribute “HTTP status code” and value 404, if the count
for good transactions is 0 and for bad transactions
is 5, http.status.code:404 is displayed among the in-
sights. “Bad” transaction traffic includes also slow
transaction traffic (e.g. the tail of the 95-percentile).
In figure 3, the HTTP URL of /app/api/v1/buy/402
ends up with an error while for another URL such as
/app/api/v1/buy/2767 there’s no error. Perceptor can
handle both categorical and numerical attributes.
Call chain terminology is discussed in (Leavitt,
2014; OpenTracing, 2020). In Figure 2 an example
of a call chain is displayed where a request is sent to
a Web Service with a specific trace id of 27046b00,
traversing through the other services. Each service
method belongs to a specific span. The RPC spans
between services contain timestamped events (a.k.a
logs or annotations) such as Client Sent (CS), Server
Received (SR), Server Sent (SS) and Client Received
(CR). Additional Key-Value information under each
span is regarded as Tags or binary annotations, such as
message/payload size, HTTP method or status code,
and Service type. With Perceptor, a call chain as dis-
played in Figure 3 is enriched with insights on the
difference between good and bad transactions. The
following is a list of call chain attributes accord-
ing to hierarchical order of invocation: Tier, Tier to
Tier, Instance, Instance to Instance, Method, Method-
to-Method, Categorical Binary Annotation Attribute,
Numerical Attribute, Categorical Annotation feature.
Figure 4 lists examples of Insight types that Perceptor
is able to automatically discover.
Figure 2: Zipkin Call Chain.
Figure 3: Call Chain Attributes of the Payment Application.
CLOSER 2020 - 10th International Conference on Cloud Computing and Services Science
246
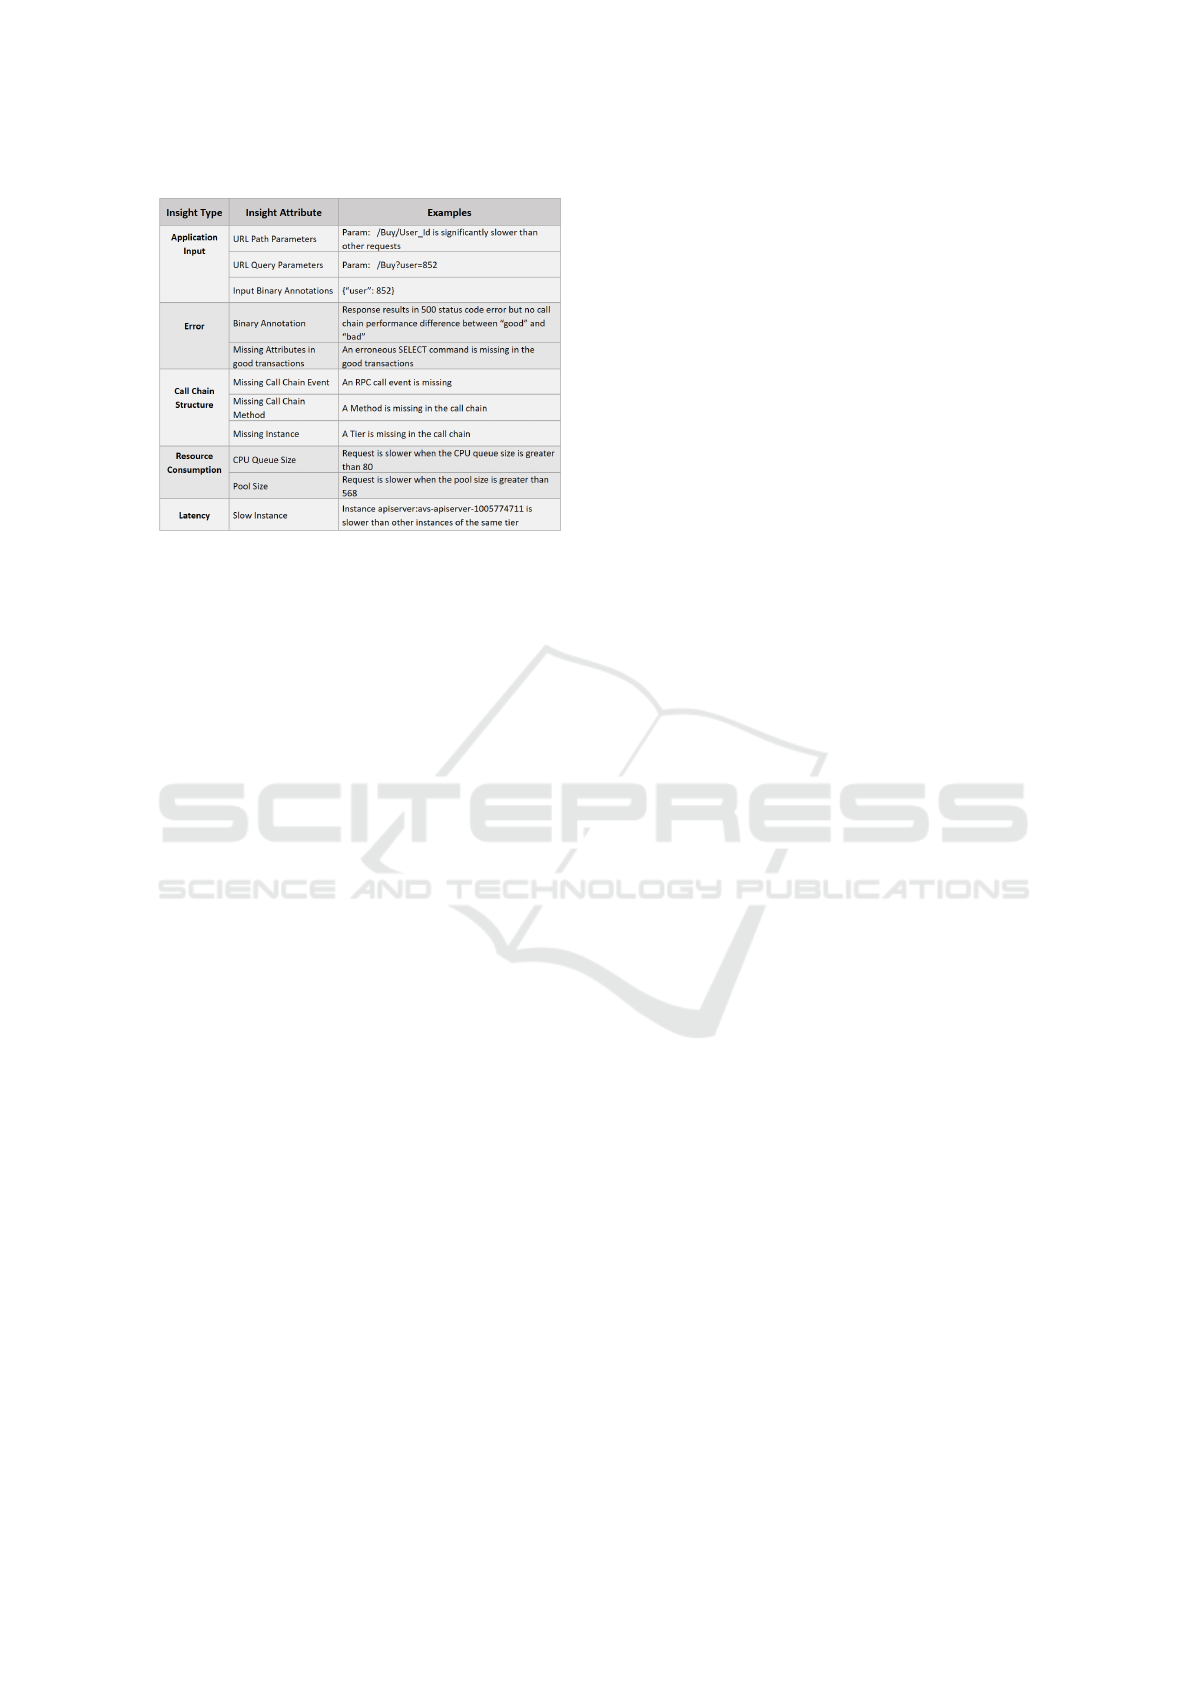
Figure 4: Table of Insight Types.
The remainder of the paper is organized as fol-
lows. In section 2 we review related work. In section
3 we describe the data structures used for automatic
discovery of Insights in streaming mode. In section
4 the details of the Insights auto-discovery process
are presented. Sections 5 and 6 provide extensions
for CMS Error Reduction and for Numerical attribute
treatment. In section 7 we present experimental re-
sults and in section 8 the conclusions.
2 RELATED WORK
In order to track for errors or performance degrada-
tion of applications, Application Performance Man-
agement (APM) products are used, mainly focused on
application mapping and transaction profiling. Appli-
cation mapping is concerned with metric level real-
time discovery and visualization of all the interac-
tions of an application with the underlying infrastruc-
ture. Transaction profiling distinguishes unique trans-
actions and tracks the unique flow and code execu-
tion of a single business transaction across the under-
lying distributed application infrastructure. Yet, both
of these features do not currently allow to automat-
ically find transaction-level attributes that are corre-
lated with faults or with performance degradation.
Existing methods for fault isolation in APM in-
clude topology based tools that provide visualization
of service dependency e.g., Dynatrace, Stackify, Ap-
pDynamics and Kieker (Brunnert et al., 2015). These
allow the user to narrow the search for signals of a
problem on the tier level. At a deeper level Code-
level diagnostics such as AppDynamics diagnostics
(Diagnostics, 2020) allow the user to diagnose down
to an individual line of code. YTrace (Kanuparthy
et al., 2016), an End-to-end Performance Diagnosis
in Large Cloud and Content Providers is another ex-
ample of a tool that aims at troubleshooting and fix-
ing performance problems after the problems occur.
It requires the system to deliver near real time, ac-
tionable insights as to the signs of performance prob-
lems. However, in all these diagnostic tools the user
has to manually look for the cause of a problem rather
than have an automatic tool that discovers the insights
linked to the problem without any user intervention.
Error profiling is another set of tools that pro-
vides information about attribute values that differen-
tiate between errors and non-errors. For each call the
attributes and their values are provided using APM
monitoring capabilities and instrumentation. Indus-
trial solutions such as New Relic (NewRelic, 2020)
take advantage of this data to provide insight as to
possible attributes or values related to a problem.
However, current approaches require the user to pro-
vide the list of suspected attributes that relate to the
debugged problem. In addition, they also require a
manual configuration of thresholds for the values of
these attributes in order to check whether the values
below or above the thresholds are related to the prob-
lem at hand. Currently, error profiling is limited to
metrics or requires custom defined attributes.
All existing methods lack automatic insight dis-
covery at the level of call-chain attributes and val-
ues that allows deeper understanding of the problem,
without having the user pre-configure where the in-
sight might be found.
Large-Scale complex distributed systems need a
special tracing infrastructure to gather timing data
needed to troubleshoot latency problems and faults.
Understanding system behavior requires observing
related activities across many different programs and
machines. Dapper (Sigelman et al., 2010) by Google
and its derivation Zipkin (Leavitt, 2014) provide a
distributed tracing system for micro-service architec-
tures that manages both the collection and lookup of
tracing data. Pinpoint (Chen et al., 2002) provides
the runtime tracing needed by Zipkin using instru-
mentation. It traces requests as they travel through a
system and it is agnostic to application-level knowl-
edge. Pivot-Tracing (Mace et al., 2018) is a dy-
namic instrumentation framework that enables opera-
tors to iteratively install new queries during the diag-
nosis process. Canopy (Kaldor et al., 2017) is Face-
book tracing system constructing and sampling per-
formance traces by propagating identifiers through
the system. Finally, the Open Tracing Project (Open-
Tracing, 2020) is an open tracing standard for dis-
tributed applications with micro-services.
Online Automatic Characteristics Discovery of Faulty Application Transactions in the Cloud
247

3 DATA STRUCTURES FOR
INSIGHT DISCOVERY
The Insights discovery method of comparing at-
tributes and values between “good” transactions and
“bad” transactions requires the handling of many at-
tributes and their values per each transaction per each
application per each user. This makes it very expen-
sive to store and analyze the data in batch mode and
requires a low memory footprint and a scalable solu-
tion. In addition, it is desirable to have the insights
as close as possible to the time of fault. Therefore,
an online streaming solution is preferable to a batch
mode solution.
A Decision Tree (Salzberg, 1994) solution pro-
vides explainable rules for the user, with optional effi-
cient versions such as Hoeffding Decision Tree (Bifet
et al., 2017). Yet, the disadvantages include large
space, instability, and overfitting.
An alternative solution could be having a key
value store of counters – where each attribute key
has 2 counters – one for bad transactions and one for
good transactions. Yet, this solution will be expen-
sive in memory, as for example a value may represent
a timestamp of a business transaction or a product id
in a large online retail service.
A hash table is a good alternative due to the con-
trol over memory – in particular for large cardinality
cases, yet an even more space efficient alternative is
a Count Min Sketch (CMS) (Cormode, 2008) where
unlike a hash table uses only sub-linear space, at the
expense of over-counting some events due to colli-
sions. Perceptor utilizes the CMS structure for ag-
gregating statistics on each feature:value pair and can
provide an insight without the lead time required by
a batch solution. For each transaction we maintain a
data structure storing the minimum necessary data to
detect insights online.
A sketch is maintained storing counts of fea-
ture:value pairs for the good call chains and a sep-
arate sketch is maintained for the bad call chains
(per transaction type). Counts are compared between
the bad and the good sketches to detect feature:value
pairs that differ between the sketches. For each at-
tribute:value pair there are k counters each having a
different hash function and therefore a different hash
value for the pair. Each counter is in a separate hash
“table”, a row of size m. Since we aggregated many
attribute:value pairs in the same table, collisions may
arise and therefore the redundancy of several hash
functions and hash “tables” are needed. When adding
an attribute:value pair to the matrix, k hashes are cal-
culated for the pair (in the range [1 : m]) and the coun-
ters at those k locations are incremented by 1. To ex-
tract the counter value of an attribute:value pair, the
minimum counter from all the k hashed locations is
chosen. The reason is that collisions can cause some
of the counters to have a greater value than the true
count.
Perceptor maintains a separate CMS matrix for the
good and for the bad transaction instances (per trans-
action). It then looks for an insight by comparing
counters between the bad sketch and the good sketch
in real time when the attribute:value pair is inserted
into the CMS. Since most transactions are good, the
good sketch will usually have enough statistics while
the bad sketch may have only rare events. Therefore,
when the attributes of the bad transaction are inserted
into the bad sketch, the counters of the attribute can
be compared to their value in the good sketch at that
moment and an insight can be produced if no such
value exists in the good sketch. It is also possible
to compare the “good” and “bad” counters of an at-
tribute:value when inserting the pair for a good trans-
action. An additional case for an insight is when the
“bad” counter is significantly higher than correspond-
ing “good” counter. Wilk’s theorem (Wilks, 1938)
can be used to quantify the statistical significance as
in the coin tossing example in reference (WilksTheo-
rem, 2020).
Comparing a “good” attribute:value pair to the
corresponding entry in the “bad” sketch is more sub-
tle. For example, HTTP status code 200 OK is likely
to appear in the good sketch and not in the bad sketch.
Yet, this attribute:value pair does not provide any use-
ful insight as to the cause of the faulty transaction
behavior. For some attributes such as topological at-
tributes (Tier, Instance, method, etc.) if the attribute
exists in the good sketch and does not appear in the
bad sketch, an insight can be derived as to missing
services and methods in the bad transactions.
The use of CMS is memory efficient especially for
long strings since the hashed value can be either a
short or a long taking only up to 4 bytes for the at-
tribute:value pair. In addition, all the attributes of a
transaction can be stored in the same CMS data struc-
ture. In principle the attributes of several transactions
can be stored in the same CMS table by hashing the
combination transaction:attribute:value. This requires
a larger hash table but is more efficient since some
transactions may have less attributes resulting in a
waste of memory with a dedicated CMS per transac-
tion.
Features having many distinct values can pollute
the CMS data structure and therefore should be de-
tected and their value range limited. We detect such
features using a Linear Counting (Whang et al., 1990)
count-distinct algorithm discussed in section 5. We
CLOSER 2020 - 10th International Conference on Cloud Computing and Services Science
248

use the same algorithm to detect when the CMS data
structure has been polluted so that we can either ex-
pand it or limit new attributes and values from using
the data structure. This is necessary in order to limit
the amount of FP and FN in practical applications (see
section 5 for CMS sizing).
4 INSIGHTS AUTO-DISCOVERY
PROCESS
We describe the steps taken in Perceptor to discover
Insights for application transactions.
In Figure 5, the process of insights discovery is
depicted. The first step is Data Collection, Tracing
and collecting call chain data from agents as in Zip-
kin (Leavitt, 2014) collection of span data. Zipkin is
a distributed tracing system which helps gather data
needed to troubleshoot latency problems in micro-
service architectures. It manages both the collection
and lookup of this data.
The next step is Data Distribution, the call chain
streaming data from all agents is collected and dis-
tributed per application per transaction using for ex-
ample a Publish-Subscribe system (Yongguo et al.,
2019). The data is then normalized by eliminating
duplicates, arranging the data according to time, and
breaking the call chains and spans into feature:value
pairs in the Featurizer.
The call chain data is then sent to the Cache Man-
ager as well as to the Insight Detector. The reason
we need a Cache Manager is that we do not know
if the transaction is good or bad until span 0 is com-
plete (with the final response of the transaction). Only
when the transaction is complete we can insert the at-
tribute:value pairs of the call chain to the right sketch,
to the “bad” sketch or to the “good” sketch. On the
other hand the Insight Detector does not have to wait
for span 0 completion. It compares the bad sketch
with the good sketch so it has to look up the counters
in both sketches anyway. The Insight Detector does
not insert attributes into the CMS (Cormode, 2008),
this is the role of the Count Manager. Instead, the In-
sight Detector utilizes the attribute:value pairs to look
up their counts in the hash tables. It compares the
counts between the bad and the good sketches for the
specific attribute:value pair.
The features passed to the Insight Detector are
ranked according to the progress in the call chain
so that instances appearing earlier in time are ranked
higher. In addition, concurring features are ranked ac-
cording to their order, for example, a missing method
is ranked higher than its attributes. The ranking pre-
vents a flood of Insights since as in the last exam-
ple when the missing method produces an Insight, all
lower ranked attributes under this method are disre-
garded.
The Count Manager receives transactions that are
labeled good or bad and inserts all attributes of a
transaction into the right sketch counting the fre-
quency of each feature:value pair. However, there is
a problem of discovering Insights in streaming mode,
for example, discovering problems that show up in
the last minute. To overcome this problem, the Count
Manager maintains a rotating window of for exam-
ple 10 minutes with each minute having its own CMS
counters. Together with the Sketch Aggregator the
streaming mode insights of the last minute can be
discovered. The Sketch Aggregator aggregates coun-
ters to a larger time interval depending on the desired
window size. For example, when each sketch spans
one minute, aggregation is done by adding sketch
matrixes of several minutes to a single aggregated
sketch. Since the per minute sketch and the per win-
dow size sketch are of the same size, it is possible
every minute to add the new one minute sketch to the
aggregated sketch and at the same time subtract the
oldest one minute sketch from the aggregated sketch.
With this mechanism a memory-efficient history of
window size duration for the good and bad transac-
tions can be maintained up-to-date and insights can
be drawn as they occur. The Insights Detector, upon
each feature:value pair arrival checks for an insight in
the aggregated sketch.
The insights are then sent to the Insight Aggrega-
tor whose role is to consolidate them to a few distinct
insights since each attribute:value pair may produce
the same insight several times per each transaction in-
stance. The distinct insights are sent to the Insight
Presentation service and it presents them to the user
via a User Interface.
5 CMS ERROR REDUCTION
The sketch data structure is a two-dimensional array
of w columns and d rows that are chosen by set-
ting w =
d
e/ε
e
and d =
d
1/δ
e
, where the error in
answering a query is within an additive factor of ε
with probability 1 − δ and e is Euler’s number (Cor-
mode, 2008). The use of CMS is dynamic in our case,
and therefore we cannot tell in advance if transactions
may have too many attributes or if attributes may have
too many distinct values. As new values are added to
the sketch more collisions occur, and the gap between
our approximated counts using the minimum value of
the counters, and the true count grows larger. If the
number of distinct attributes and values becomes too
Online Automatic Characteristics Discovery of Faulty Application Transactions in the Cloud
249
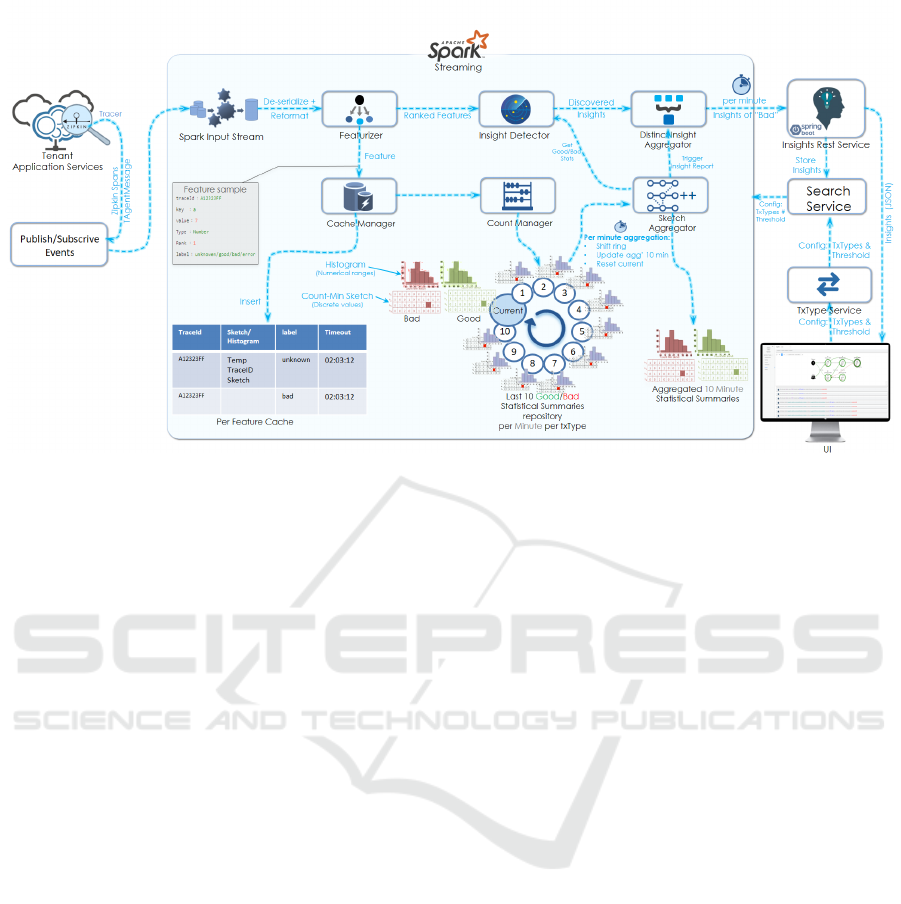
Figure 5: Perceptor Insight Discovery Process.
large they may pollute the sketch making the initial
chosen parameters w and d not reflect the current er-
ror and probability of answering a query. Therefore,
count-distinct data structures (Whang et al., 1990) are
used to limit the extreme cases from polluting the
sketch.
The count-distinct problem is a cardinality estima-
tion problem where the number of distinct elements
in a data stream with repeated elements is calculated
using an efficient time and space algorithm. The Hy-
perLogLog (Flajolet et al., 2007) (based on the orig-
inal Flajolet–Martin algorithm (Durand and Flajolet,
2003)) is a very efficient algorithm for estimating the
cardinality of a multiset. However we have used the
Linear Counting (LC) (Whang et al., 1990) algorithm
as it is better for small cardinalities. The memory re-
quired by the algorithm is very low, one bit per each
distinct value.
The count-distinct algorithm has been used in two
cases: to track and control the size of the sketch and
to track the range of values of an attribute. In the first
case, since the algorithm provides an estimate of the
current number of occupied CMS cells, we can con-
trol the use of the sketch when the number of distinct
values is of the order of w, by either enlarging the
sketch or by limiting insertions of new attribute:value
pairs to the sketch. The count-distinct algorithm en-
ables the auto-scaling of the CMS, with one bit per
each cell of the sketch.
In the second case, the count-distinct algorithm is
used to track the range of values of a categorical at-
tribute taking several values. Even though the sketch
data structure is very efficient for long strings, a sin-
gle attribute may pollute the whole sketch which is
common to all the attributes of the transaction. It is
possible to limit the number of distinct values of each
attribute to a small number (e.g. 24) and since 24
bits take only 3 bytes of memory, it is possible with a
few bytes per attribute to track each categorical vari-
able. When a polluting attribute is detected, it can be
limited to the maximum distinct values allowed, and
any new values are not inserted into the sketch. The
new values are detected by having a minimum counter
value of 0 in the sketch.
6 NUMERICAL ATTRIBUTES
Attributes taking numerical values such as a User Id,
pose a problem to the CMS, each transaction instance
may have a different value for the attribute. For such
attributes the range of values typical of bad transac-
tions versus the range for the good transactions can
provide a valuable insight linking to the cause of a
fault.
As depicted in Figure 5, a histogram is used to
derive insights from numerical attributes. Two his-
tograms are maintained, one for the “good” transac-
tions and one for the “bad” transactions where each
numerical attribute can be added to a per-minute his-
togram. The per-minute-based Histograms are aggre-
gated to a ten minute histogram and the ten minute
histograms are compared between the good transac-
tions and the bad transactions. A High Dynamic
Range (HDR) (HdrHistogram, 2020) histogram may
be used to save memory, its sub-ranges have a log
CLOSER 2020 - 10th International Conference on Cloud Computing and Services Science
250
scale width and the accuracy of the aggregated values
is fixed in terms of the number of significant digits.
7 EXPERIMENTAL RESULTS
We have performed all experiments of the proposed
method on several applications in the Cloud, among
them providing sample insights for an online store ap-
plication with 7 micro-services.
Figure 6: Buy Product Insights Numeric.
In Figure 6 an Insight discovered for a URL pa-
rameter range is displayed where the range of the pa-
rameter differs between the bad (red) and the good
(green) transaction instances. This is an example of
a numerical attribute where we have used an HDR
(HdrHistogram, 2020) histogram to find the ranges of
the attribute.
Figure 7: Buy Product Good vs. Bad.
In Figure 7, we display two instances of the call
chain for the BuyProduct transaction of Figure 6, one
instance from the good transactions (green) and one
instance from the bad transactions (bad). For each
micro-service the duration of the spans for the two
instances is displayed on the right side of the figure.
The bad transaction has a degraded execution time of
around 840ms while the good transaction execution
time is around 60ms.
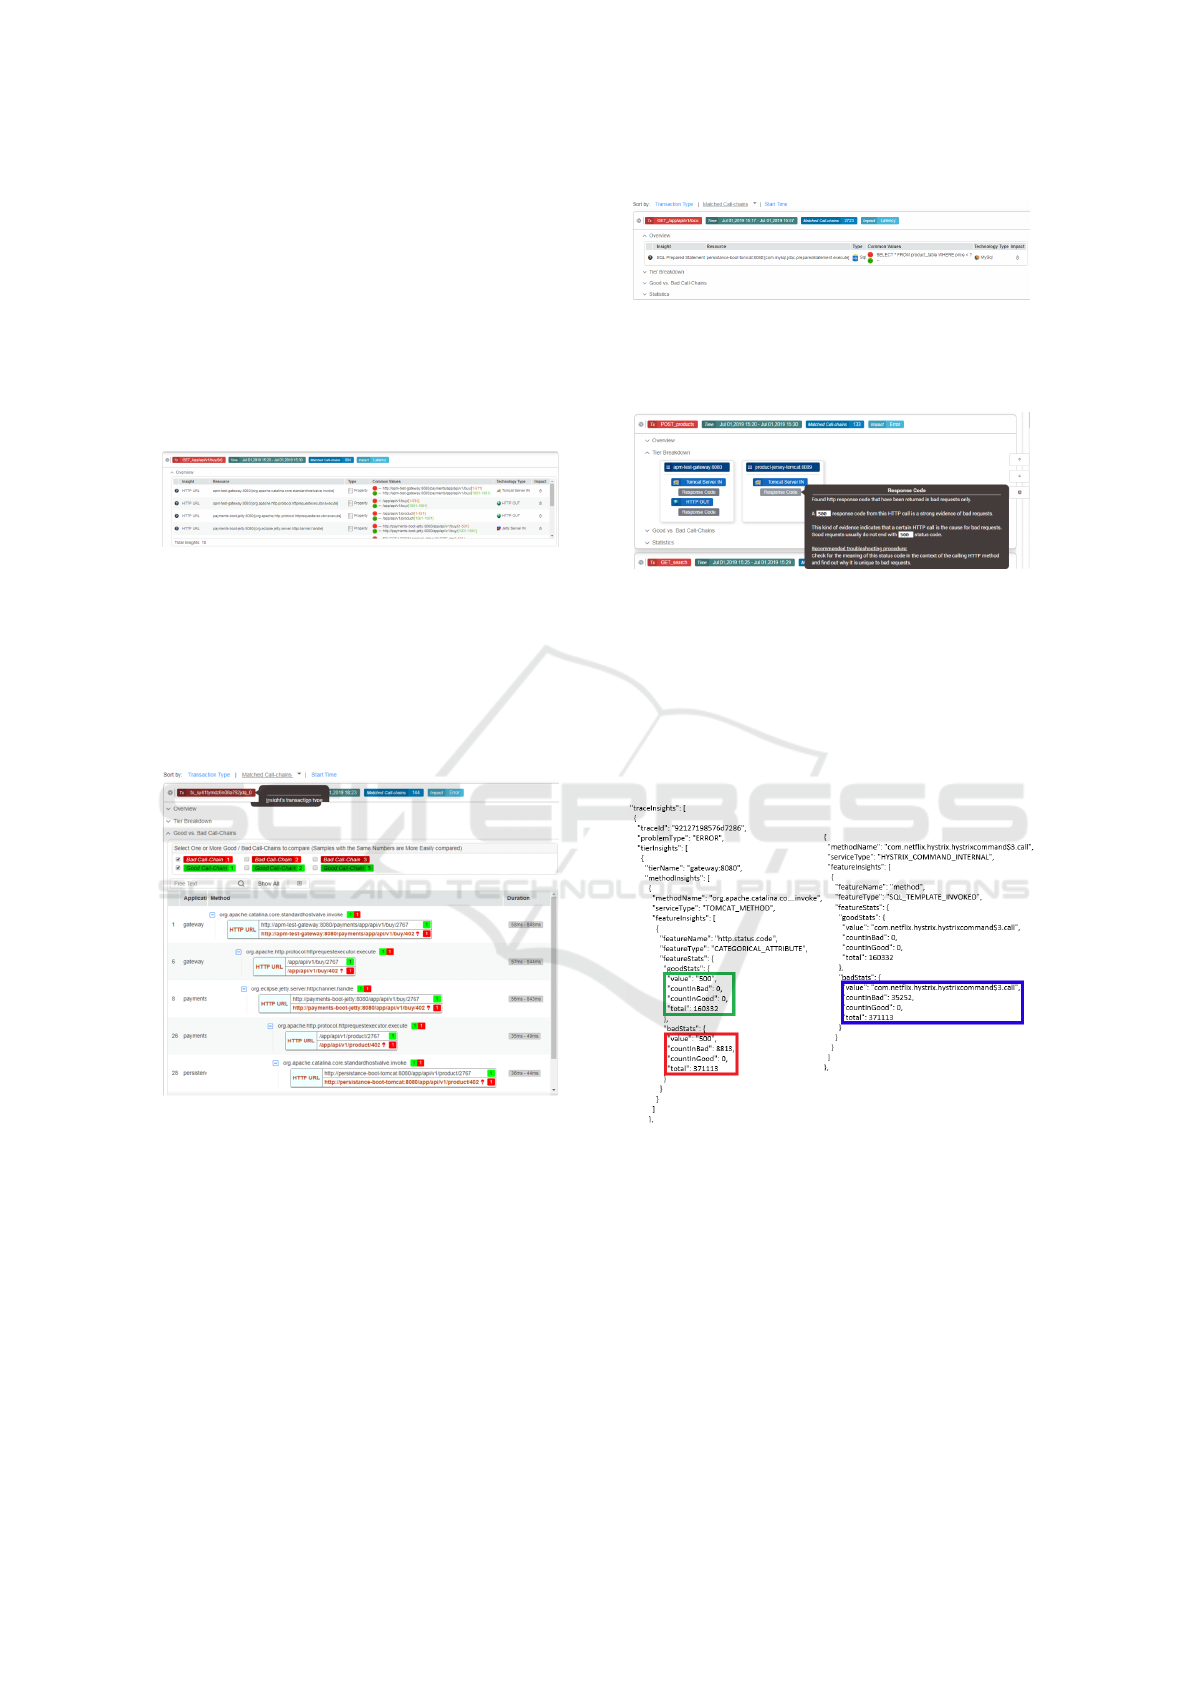
In Figure 8 an Insight for a categorical attribute
in an SQL SELECT sent from the Persistence to the
MySQL database is displayed. The SELECT com-
mand with the red dot does not appear in the good
Figure 8: Buy Product Insights Categorical Attributes.
transactions. The “bad” transactions here signify a
slow transaction relative to the good transactions.
Figure 9: Buy Product Insights Categorical Error.
In Figure 9 we depict an insight for a categorical
attribute where a bad transaction is one that returns an
error. The breakdown this time is according to the tier
and the attributes with the Insight are colored gray.
The insight found is that the attribute Response Code
has a value 500 that does not appear in the good trans-
action instances.
Figure 10: Buy Product Insight Error Detail.
In Figure 10 more information is provided for the
above Status Code insight. It can be seen on the
left that for the good transactions (in a green rect-
angle) there were 0 instances where the status code
was 500 (out of 160332 good transactions). On the
other hand the bad transactions (in red rectangle) had
8813 instances with status code 500 out of a total
of 371113 bad transaction instances. The other in-
sight presented in Figure 10 is a Structural Insight for
the same transaction and the same test. The method
com.net f lix.hystrix.hystrixcommand$3.call (in blue
rectangle) was executed for 35252 instances of the
Online Automatic Characteristics Discovery of Faulty Application Transactions in the Cloud
251

bad transactions but was never executed in the good
transactions.
8 CONCLUSIONS
The method we have developed can be used for Cloud
PaaS debugging and performance analysis, fault anal-
ysis and root cause analysis. It can be used online
in streaming mode and is efficient in both memory
and speed. It is possible to adjust the method to re-
duce False Positives by requiring that an insight be
restricted to an attribute:value pair appearing in the
“bad” transactions and not appearing in the “good”
transactions. This is very desirable in practical appli-
cations where customers lose trust in alerting systems
due to many False Positives.
Perceptor can find Insights of various types in-
cluding structural attributes such as micro-services,
methods, instances not visited by good transactions
versus bad transactions or the opposite. Attributes can
be categorical taking a small set of discrete values in-
cluding strings, or numerical attributes taking a large
set of values such as UserId. Call-chain data on which
Perceptor relies as input is rich with useful informa-
tion and makes Perceptor a major help in performance
debugging and in isolating faults.
REFERENCES
Bifet, A., Zhang, J., Fan, W., He, C., Zhang, J., Qian, J.,
Holmes, G., and Pfahringer, B. (2017). Extremely
fast decision tree mining for evolving data streams. In
Proceedings of the 23rd ACM SIGKDD International
Conference on Knowledge Discovery and Data Min-
ing, pages 1733–1742. ACM.
Brunnert, A., van Hoorn, A., Willnecker, F., Danciu, A.,
Hasselbring, W., Heger, C., Herbst, N., Jamshidi,
P., Jung, R., von Kistowski, J., et al. (2015).
Performance-oriented devops: A research agenda.
arXiv preprint arXiv:1508.04752.
Chen, M. Y., Kiciman, E., Fratkin, E., Fox, A., and Brewer,
E. (2002). Pinpoint: Problem determination in large,
dynamic internet services. In Proceedings Interna-
tional Conference on Dependable Systems and Net-
works, pages 595–604. IEEE.
Cormode, G. (2008). Count-min sketch. Encyclopedia of
Algorithms, pages 1–6.
Diagnostics (2020). Appdynamics diagnostics.
https://www.appdynamics.com/how-it-works/
application-diagnostics/.
Durand, M. and Flajolet, P. (2003). Loglog counting of
large cardinalities. In European Symposium on Algo-
rithms, pages 605–617. Springer.
Flajolet, P., Fusy,
´
E., Gandouet, O., and Meunier, F. (2007).
Hyperloglog: the analysis of a near-optimal cardinal-
ity estimation algorithm. In Discrete Mathematics and
Theoretical Computer Science, pages 137–156. Dis-
crete Mathematics and Theoretical Computer Science.
HdrHistogram (2020). Hdr histogram. http://hdrhistogram.
org/.
Kaldor, J., Mace, J., Bejda, M., Gao, E., Kuropatwa, W.,
O’Neill, J., Ong, K. W., Schaller, B., Shan, P., Vis-
comi, B., et al. (2017). Canopy: An end-to-end per-
formance tracing and analysis system. In Proceedings
of the 26th Symposium on Operating Systems Princi-
ples, pages 34–50. ACM.
Kanuparthy, P., Dai, Y., Pathak, S., Samal, S., Benson, T.,
Ghasemi, M., and Narayan, P. (2016). Ytrace: End-to-
end performance diagnosis in large cloud and content
providers. arXiv preprint arXiv:1602.03273.
Leavitt, J. (2014). End-to-end tracing models: Analysis and
unification. B. Sc. esis, Brown University,. Page.
Mace, J., Roelke, R., and Fonseca, R. (2018). Pivot
tracing: Dynamic causal monitoring for distributed
systems. ACM Transactions on Computer Systems
(TOCS), 35(4):11.
NewRelic (2020). New relic. https://newrelic.com/
products/insights/.
OpenTracing (2020). Open tracing project. https://
opentracing.io/.
Salzberg, S. L. (1994). C4. 5: Programs for machine learn-
ing by j. ross quinlan. morgan kaufmann publishers,
inc., 1993.
Sigelman, B. H., Barroso, L. A., Burrows, M., Stephenson,
P., Plakal, M., Beaver, D., Jaspan, S., and Shanbhag,
C. (2010). Dapper, a large-scale distributed systems
tracing infrastructure.
Whang, K.-Y., Vander-Zanden, B. T., and Taylor, H. M.
(1990). A linear-time probabilistic counting algo-
rithm for database applications. ACM Transactions
on Database Systems (TODS), 15(2):208–229.
Wilks, S. S. (1938). The large-sample distribution of the
likelihood ratio for testing composite hypotheses. The
Annals of Mathematical Statistics, 9(1):60–62.
WilksTheorem (2020). Wikipedia: Wilks theorem. https:
//en.wikipedia.org/wiki/Wilks%27 theorem/.
Yongguo, J., Qiang, L., Changshuai, Q., Jian, S., and Qian-
qian, L. (2019). Message-oriented middleware: A re-
view. In 2019 5th International Conference on Big
Data Computing and Communications (BIGCOM),
pages 88–97. IEEE.
CLOSER 2020 - 10th International Conference on Cloud Computing and Services Science
252
