
Adult First-time User of Handheld Computer System: Challenges
Guy Toko
1
, Ernest Mnkandla
2
and Babajide Adewumi
1
1
College of Business and Economics, School of Consumer Intelligence and Information Systems,
Department of Applied Information Systems, University of Johannesburg, Johannesburg, South Africa
2
Department of Computer Science, School of Computing, University of South Africa, Johannesburg, South Africa.
Keywords: Handheld Computer System, Adult, First-time User, Challenges.
Abstract: Handheld computing systems or devices can be defined as exceptionally portable, independent information
management and communication devices. Furthermore, handheld computing systems or devices can be seen
as a small or pocket-sized computing device with a touch screen keyboard and input and output interface.
According to the definition of handheld computing systems, numerous devices fit the description such as
smartphones, personal digital assistants (PDAs) and pagers. However, adult first- time users of computer
systems face different issues in adopting the device and the literature reviewed shows that most of them have
difficulties with the design, such as the touch screen. The negative views of technology devices by adult first-
time users can be attributed to the difficulty in adapting to new technology. Weakness, incapacity, distrust of
technology, absence of perceived value and trouble in understanding how to utilise the device are largely the
main problems observed by adult first-time users of handheld computer systems. However, they could accept
the use of the devices provided their needs are taken into consideration by the developers. The limitation of
the research was that only adults in the age range of 55 to 91 in Gauteng in South Africa were chosen for this
research.
1 INTRODUCTION
The introduction and use of technology (handheld
computer systems) in our daily activities have become
significant, regardless of the type of technology used.
At first, computer system evolution was limited to
computer experts.
Computers have now become working instruments
accessible to whoever can obtain and utilise them,
regardless of economic wellbeing, ability,
topographical area, education or training level and
sexual orientation (Toko, 2017). Older adults are now
broadly known to be a particularly diverse group who
do not regularly adapt to technology. However, there
has been a survey that shows that fears and concerns
linked to using computers, as well as opinions of skills
and capabilities in both utilising and learning to use
them, is lower or minimal compared to other age
groups (Marquié, et al., 2002). The use of technology
by adult individuals frequently relies on the
availability of training, and there is also the valid
question of whether it will provide precise value to
them.
The younger generation has an understanding and
knowledge of computers because they were often
taught how to use them at school or work, but this does
not necessarily apply to older adults, particularly those
whose jobs did not require the use of computers
(Barnard, et al., 2013).
Handheld computers can help connect the
computerised separation in this swiftly elderly world.
Older people did not experience the use of computers
in their childhoods, and a significant number of them
have never had computers. However, handheld
computing systems can expose older adults to better
and newer opportunities in the world of technology.
In creating or designing handheld computing
systems for adult first-time users, ease of use is one of
the problems they face (Kang & Yoon, 2008).
Usability challenges with input devices, list of options
and tasks, and output devices are hassled. Many of
these usability difficulties can be minimised with the
help of new technological innovations.
No matter how proactive, meticulous and efficient
the interactive design team of any electronic gadget,
household appliance or computing system is, it is not
always possible to predict human behaviour at the
time of development, and it is also difficult to predict
social aspects pertaining to the conditions the end-
users will be exposed to (Toko, 2017).
216
Toko, G., Mnkandla, E. and Adewumi, B.
Adult First-time User of Handheld Computer System: Challenges.
DOI: 10.5220/0009320202160227
In Proceedings of the 12th International Conference on Computer Supported Education (CSEDU 2020) - Volume 2, pages 216-227
ISBN: 978-989-758-417-6
Copyright
c
2020 by SCITEPRESS – Science and Technology Publications, Lda. All rights reserved

This research was undertaken to assess adult first-
time users of handheld computing systems and to
evaluate the types of challenges they face when it
comes to adopting a computing system.
For this study, three research questions were
generated to make an assessment of adult first-time
users of handheld computers and investigate the
crucial issues faced by them in adopting the devices.
2 LITTERATURE REVIEW
Handheld computing systems or devices can be
defined as portable, independent information
management and communication devices (Weiss,
2003). Furthermore, they can be described as a small,
or pocket-sized, computing device with a touch screen
keyboard and input and output interface. According to
the definition of a handheld computing system,
numerous devices can fit the description, such as
smartphones, personal digital assistants (PDAs) and
pagers.
In addition, the device should be able to function
without cables, apart from recharging and
synchronising with a desktop computer. It must be
easy to use with one hand and not require a table for
support; it should also allow internet connectivity and
application support such as wireless application
protocol (WAP) or email (Weiss, 2003).
2.1 Understanding the Importance of
Computing Systems
The continuous inventive nature of computing
systems brands them perfect tools to influence society
in general. Computing systems have influenced our
daily lives, from the way we sleep and wake, the way
we talk to each other and everything else involved in
daily human activity (Reiss, 2012). Current evidence
suggests that more older adults are becoming aware of
the move to computerisation and that they are
becoming mindful of the advantages of using
computing systems (Morrel, et al., 2000). For
instance, adults, in general, can now use automatic
teller machines (ATMs) to withdraw money rather
than going to the bank and also to use popular
transportation applications (apps) to request transport.
Another study suggests that utilising computing
systems with internet access gives older adults a sense
of freedom and control over their day-to-day activities
(Morris, et al., 2007). Older adults with disabilities or
partial mobility can utilise digital technology or
handheld computing systems to maintain their social
networks and assist in their well-being (Choi &
DiNitto, 2013). Computing systems with internet
access offer new methods of communication for all
individuals as well as assisting older adults to
overcome hurdles in social interaction among
themselves (Young & Lo, 2012).
More computing systems awareness can enable
older adults to remain independent and maintain their
informal communities by emailing, instant messaging
or online chatting, as well helping them to be more
knowledgeable about their health issues and upgrade
their insight into medical problems (Karavidas, et al.,
2005).
2.2 Types of Handheld Computing
Systems
Handheld computing systems are not limited to
tablets, and there are numerous sizes and shapes
available in the market with different ways of utilising
them (Becta, 2003).
Handheld computing systems or devices can be
broken down into three different classifications, being
mobile phones, pagers and personal digital assistants
(PDAs) (Weiss, 2003).
Mobile phones or smartphones: These can be
described as devices or telephones that are
fundamentally for voice calls with an optional
use for short message services (SMSs) and
wireless application protocol (WAP) or I-mode,
two protocols for the mobile Internet. With the
expansion in the availability of mobile
information and communication technologies,
mobile phones have become the most well-
known specialised gadgets to interconnect
individuals (Kleinberger, et al., 2007). With the
noteworthy advance in technological
development, mobile phones have become the
biggest selling items in current society and give
a new shape to our lifestyles (Ventä, et al., 2008).
Pagers are handheld gadgets used primarily for
two-way email correspondence, but also include
some PDA capabilities, for example, contact
management and a schedule. A few pagers offer
Internet browsing. Pagers have QWERTY
keypads appropriate for 'two-thumb' typing.
QWERTY keypads are a variation appropriate
for handheld gadgets. The distinctive feature in
pagers and PDAs is the touch screen, which plays
an important part in the way in which
applications are designed and planned (Weiss,
2003).
PDAs are component-rich independent gadgets
that have address books and timetable schedule
Adult First-time User of Handheld Computer System: Challenges
217

capacities. A PDA has been defined as a
handheld computing system that has various
components, for example, address books, day
plans and logbooks that can serve as aids to
memory (Mayhorn, et al., 2005).
2.3 Addressing Handheld Computing
Adoption
A few scientists have shown that people are growing
up progressively more acquainted with innovation and
technology (Matlabi, et al., 2012). Nevertheless,
adults usually have substantially diverse desires,
concerns, capacities and capabilities when it comes to
technology, compared to younger people (Chen &
Persson, 2002). Consequently, understanding the
innovation or technology such as handheld computing
device adoption conduct of adult is significant.
The adoption of technology by adults is influenced
in two ways: direct positive influence and direct
negative influence (Melenhorst, et al., 2006). Direct
positive influence is related to advantages and lack of
expense. In particular, a benefit can be described as
the merit of using technological products, and lack of
costs can be described as the demerits that are
eliminated by using technological products. On the
other hand, direct negative influence is related to
expense and lack of advantages. Here, expenses refer
to the demerits of technological product usability and
lack of merits refers to the benefits of reducing
technological products usability (Melenhorst, et al.,
2006). However, irrespective of whether the
experience with technology is negative or positive, it
is the apparent advantages of technological products
or devices that most matter to adults in accepting
technologies.
Also, help from relatives and non-family
members, social and cultural variables, identity
attributes, communication media conduct and
socioeconomic status have all been identified as
assisting adults in the adoption of technologies such as
handheld computing systems (Quan-Haase, et al.,
2016).
2.4 Discovering Handheld User
Challenges
Due to age-related, physiological weakening and
mental and social-ecological changes, it is difficult for
adult first-time users to adjust to new technology such
as handheld computing systems and a large number of
them dismiss the new devices quickly (Lee, et al.,
2014).
The negative view of technology devices by adult
first-time users can also be attributed to the acceptance
of technology. Weakness, incapacity, distrust of
technology, absence of perceived value and difficulty
in working out how to use the device are the main
problems encountered by adult first-time users in
endeavouring to accept new technologies such as
handheld devices (Czaja & Sharit, 2016).
Recently, five issues that adult first-time users face
have been identified, accessibility, right to use, way of
life, physical impediments and confidentiality (Yuan,
et al., 2016). There are a few physiological capabilities
that are basic requirements for the use of technology
devices, for example, vision, hearing and memory, all
of which decline with age (Schewe, 1998). Adults in
general slowly lose fundamental physical capabilities
which change their perspectives about technology
such as handheld computing systems (Buckner, 2004).
3 RESEARCH QUESTION
What is the importance of handheld computing
systems in adulthood? What are some of the
challenges when it comes to adopting handheld
computing systems? What are the best mechanisms to
have when it comes to adopting handheld systems?
What is a Handheld Computing System?
4 METHODOLOGY
Methodology is an understandable set of approaches
that complement each other and also have the
capability to deliver suitable data and results that will
answer the research question as well as uniform
research purpose (Castro, et al., 2010). Research
methodology can be portrayed as the methodical,
hypothetical examination of methods associated with
a field of study. A methodology does not set out to
provide answers. It is not the same thing as a method
but offers hypothetical support for understanding
which set of methods, or best practices can be used for
particular research (Ishak & Alias, 2005).
In addition, methodology is a framework of
theories and principles based on the methods and
procedures used. Research methodology can be
grouped into two aspects which are quantitative and
qualitative research methodologies (Bryman, 2012).
A quantitative method was used for this study,
based on the empirical investigation of social
incidence with the help of statistical, mathematical or
numerical data techniques (Kaplan, 2004). A
CSEDU 2020 - 12th International Conference on Computer Supported Education
218

descriptive research design was also used as it
explains the incidence of a variable, the connection
between different variables and also assists in deciding
when and how many observations or interviews to use
in assessing the challenges faced by adult first-time
users of handheld computing systems. In addition, a
survey was included because it is a non-experimental
strategy which was used to evaluate parameters such
as age, sex, conjugal status, conduct, assessments and
emotions for a particular subject (Shaughnessy, et al.,
2011).
4.1 Data Collection Techniques
Data collection can be defined as the orderly
assembling or gathering of data from numerous
sources for a particular reason and can include
questionnaires, interviews, observations or records
that already exist. Quantitative or qualitative
techniques can be used for collecting data (KPMG,
2010). In this case, a quantitative technique was used
to collect data with the help of a well-structured
questionnaire.
A questionnaire can be described as a cluster or
sequence of questions aimed at producing data from a
source or respondent when administered an
interviewer or by filling in the questionnaire.
Questionnaires can be categorised into three types,
namely unstructured, semi-structured and structured
(Guo, 2015).
4.2 Research Population
A research population is the number of items, subjects
or members that conform to a set of specifications
(Yogesh, 2006). The research population is the entire
group of a well-defined class of individuals, items,
places or proceedings identified as a result of the
research question (Hawe & Potvin, 2009). A
population is also said to be an accumulation of all the
objects, subjects or members that obey a set of plans.
A target population refers to a set of individuals,
objects, or features that might add important and
constructive documentations of the kind of effort they
may give (Marczyk, et al., 2005). Hence, the targeted
population for this research was adults in Gauteng
province, South Africa, who were first-time users of
handheld computing systems or those who had never
used any form of ICT device except a cellular
telephone.
4.3 Research Sampling
Sampling can be described as the process whereby
individuals are selected from the population in such a
way that each individual has an equal opportunity to
be chosen (Yogesh, 2006). A sample is a portion of
the population selected for particular research. It is a
subset of a population, and the technique for selecting
the sample might be centred on probability and non-
probability.
Probability sampling, individual partaker of the
population has a known non-zero probability of being
chosen. The probability technique consists of random,
systematic and stratified sampling. In non-probability
sampling, participants are assigned from the
population in a non-random manner. The non-
probability technique comprises convenience,
judgement, quota and snowball sampling.
Probability sampling was selected for this study
because sampling errors can be calculated and
eliminated. A sampling error is the degree to which a
sample might vary from the general population
(Marczyk, et al., 2005).
4.4 Research Sample Size
The bigger the sample, the more representative it will
be, smaller samples give less reliable results as they
are probably going to be less representative of the
population (Depoy & Gitlin, 2005). The decision
about sample size is not a direct one; it relies on
various considerations and does not have a conclusive
answer.
In this research, 50 questionnaires were distributed
to the targeted population, and 27 of the participants
responded about the challenges being faced by them
as first-time adult users of handheld computing
systems or devices.
4.5 Data Collection Procedures
The literature reviewed stated that adult first-time
users of handheld computing systems face some
challenges in using them. We met with various
participants of the research population and
administered structured questionnaires that contained
open-ended questions. The survey questionnaires
allowed participants to answer questions centred on
individual involvement with handheld computing
systems and the challenges they faced. The structured
questionnaire consisted of the following attributes and
was the instrument used to measure the integrity of the
data collected.
Adult First-time User of Handheld Computer System: Challenges
219
Validity can be referred to as the level of truth or
erroneousness of the data collected with the help of the
research instrument. It can also be characterised as
both the external and internal validity of the measuring
instrument (Graeme, et al., 2006). Validity states the
level of truth or erroneousness of the predicted
challenges adult first-time users of handheld
computing systems experienced while using it.
Reliability states the regularity of amount of a
concept (Singer, 2003). Reliability can be considered
as the measure of normality with which the instrument
estimates a characteristic (Shaughnessy, et al., 2011).
It can also be referred to as the sum to which
autonomous direction of a similar instrument delivers
similar results under proportionate conditions (Thyer,
2001). The less variety the instrument yields in
repetitive estimations of an element, the higher the
reliability. There is comparability connection among
reliability as well as validity. An instrument that is not
valid can never be reliable in research. Data Analysis
and Discussions
Data analysis is the procedure of getting raw data
and translating it into valuable information for
decision making by users or researchers. Data are
gathered as well as investigated to respond to
questions, test hypotheses or negate theories (Judd, et
al., 2011).
Tukey et al (1962) characterised data analysis as
the methodology for investigating data, techniques for
deciphering the outcome of such procedures, methods
for arranging the collection of data to make its
investigation simpler, more detailed or more exact and
all the apparatus and after-effects of (scientific) which
apply to analysing data [40].
Data analysis is the procedure of methodically
applying arithmetical and coherent systems to explain
and demonstrate, summarise, recap and assess data
(Shamoo & Resnik, 2003).
4.6 Data Analysis Techniques and
Procedures
Data analysis techniques allow research analysts to re-
evaluate assembled data and develop surmising or
reason from the data. There are different types of data
analysis, including quantitative and qualitative
analysis. Quantitative data analysis can be referred to
as the process of quantifying
5 RESULTS ANALYSIS
Collected data either numerically or arithmetically,
while qualitative data analysis is non-numeric or non-
arithmetic, its method is principally steered by the
actual material at hand.
Quantitative data analysis was used in this study
and can be categorised into various aspects which
include descriptive statistics, exploratory data
analysis, confirmatory data analysis and correlation
and regression data analysis. In this research,
descriptive data analysis was used to analyse the
collected data. Descriptive data analyses are used to
portray the fundamental highlights of the data in an
investigation or a research project and they offer basic
summaries about the sample and the measures
(Trochim, 2006). Descriptive data analyses are used to
present quantitative explanations in a convenient
structure. Descriptive data analysis also helps us to
condense huge amounts of data in a reasonable way
with simple graphics analysis.
There are numerous methods and software
packages available for data analysis. The appropriate
and most ideal procedure for data analysis is to collect
the data and check for validity and reliability before
entering it into Excel or any other data analysis
software. The procedure of data analysis also checked
for the variables of the analysed data before displaying
it, and a likely scale of point ranging from strongly no
to strongly yes was used in the research data analysis.
5.1 Demography
Demography can be referred to as the study of a
particular population for research based on things such
as age, race and sex, although, other areas can also be
involved in the demographics of research.
The demography for this research was based on
sex or gender, age and ethnicity. Below is a pie chart
depicting this.
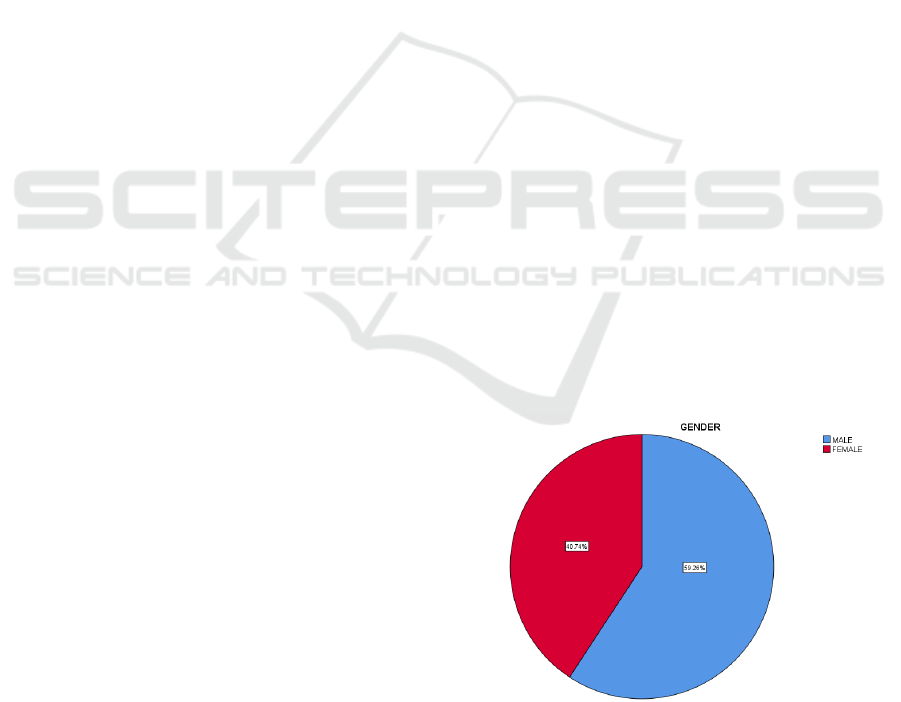
Figure 1: Gender.
CSEDU 2020 - 12th International Conference on Computer Supported Education
220
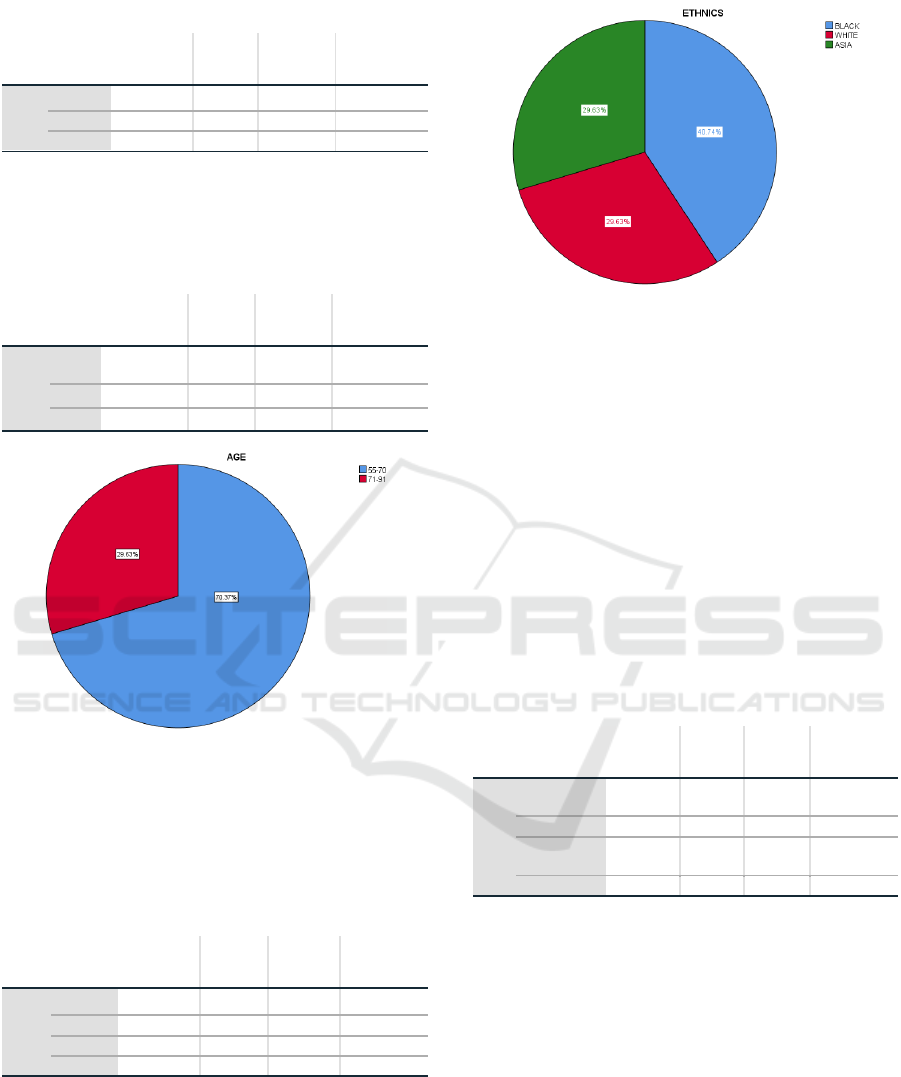
Table 1: Gender.
Frequency Percent
Valid
Percent
Cumulative
Percent
Valid Male 16 59.3 59.3 59.3
Female 11 40.7 40.7 100.0
Total 27 100.0 100.0
The analysis of gender data collection indicated that
male respondents were in the majority, being 59.2%
compared to the female respondents at 40.74%.
Table 2: Age.
Frequency Percent
Valid
Percent
Cumulative
Percent
Valid 55-70 19 70.4 70.4 70.4
71-91 8 29.6 29.6 100.0
Total 27 100.0 100.0
Figure 2: Age.
Adults were divided into two age groups, 55-70
and 71-91. There were 19 respondents in the age group
55-70 (70.37%), and 8 respondents in the 71-91 age
group (29.63%).
Table 3: Ethnicity.
Frequency Percent
Valid
Percent
Cumulative
Percent
Valid BLACK 11 40.7 40.7 40.7
WHITE 8 29.6 29.6 70.4
ASIAN 8 29.6 29.6 100.0
Total 27 100.0 100.0
Figure 3: Ethnicity.
The majority of adults who participated in this
research were black (40.74%), 29.63% were white,
and the remaining 29.63% were Asian. This analysis
allows us to know how many adults in each ethnic
group participated.
5.2 Answering the Research Questions
from the Collected Data
a) What is the importance of handheld
computing systems in adults: The findings from the
data analysis of the first research question which
involved the importance of handheld computing
systems in adults, are shown in the Tables below.
Table 4: Question 1.
Frequency Percent
Valid
Percent
Cumulative
Percent
Valid SLIGHTLY
YES
5 18.5 18.5 18.5
YES 11 40.7 40.7 59.3
STRONGL
Y YES
11 40.7 40.7 100.0
Total 27 100.0 100.0
Question 1: Have you ever accessed the Internet? The
majority of the respondents answered Yes meaning
100% of them have accessed the Internet by means of
handheld computing or other systems. However,
according to the literature reviewed, computing
systems with Internet access offer new methods of
communication which are available to all individuals
as well as to assist older adults in overcoming hurdles
in social interaction among themselves (Young & Lo,
2012).
Adult First-time User of Handheld Computer System: Challenges
221
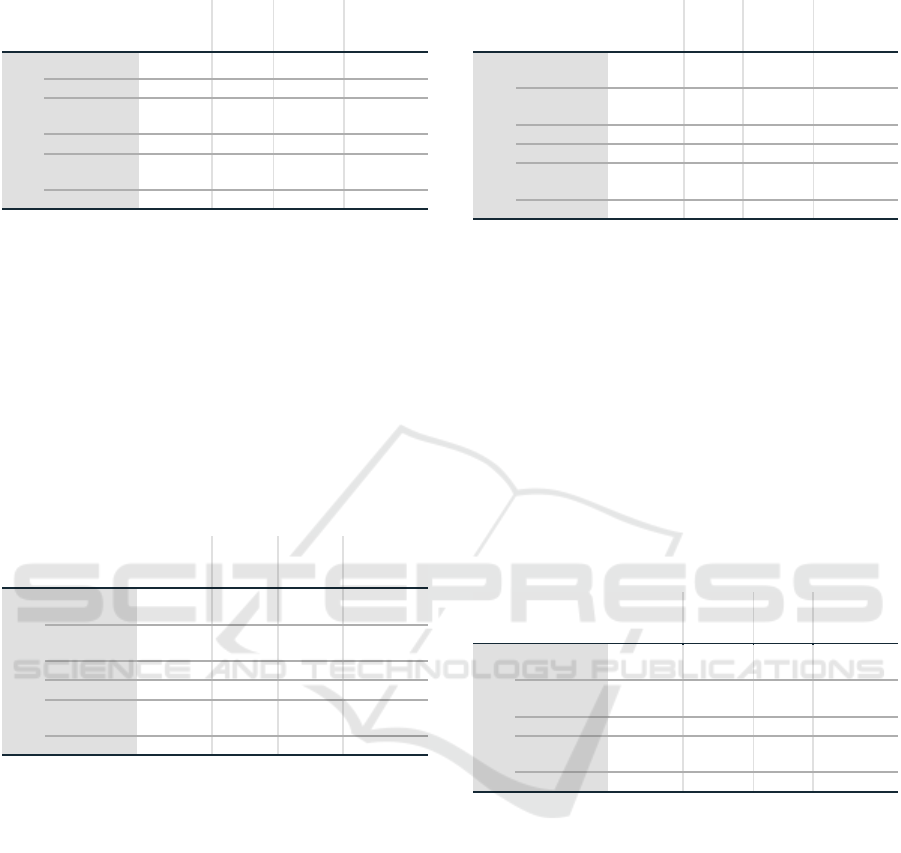
Table 5: Question 2.
Frequency Percent
Valid
Percent
Cumulative
Percent
Valid NO 5 18.5 18.5 18.5
NEUTRAL 2 7.4 7.4 25.9
SLIGHTLY
YES
8 29.6 29.6 55.6
YES 8 29.6 29.6 85.2
STRONGLY
YES
4 14.8 14.8 100.0
Total 27 100.0 100.0
Question 2: Have you ever used a handheld computing
system? Data analysis showed that a few respondents
(7.4%) answered ‘Neutral’ to this question; 18.5% of
them answered ‘No’ and 74% answered ‘Yes’. With
regard to this finding, a few scientists have shown that
adults are growing up progressively more acquainted
with innovation or technology (Matlabi, et al., 2012).
Nevertheless, adults usually have substantially more
diverse needs, concerns, capacities and capabilities
with technology or innovation compared to younger
people (Chen & Persson, 2002).
Table 6: Question 4.
Frequency Percent
Valid
Percent
Cumulative
Percent
Valid STRONGLY
NO
2 7.4 7.4 7.4
SLIGHTLY
NO
2 7.4 7.4 14.8
NO 6 22.2 22.2 37.0
NEUTRAL 9 33.3 33.3 70.4
SLIGHTLY
YES
8 29.6 29.6 100.0
Total 27 100.0 100.0
Question 4: Is a handheld computing system useful for
your daily tasks? Elements of effectiveness, efficiency
and fulfilment ought to be considered as discrete and
autonomous parts of understanding the usability of
handheld computing systems (Frøkjær, et al., 2000).
According to the data analysis, 33.3% of the
respondents answered ‘Neutral’, 37% answered ‘No’,
and 29.6% answered ‘Yes’ to this question. However,
the latest information demonstrates that older adults
utilise different types of technology such as automated
teller machines (ATMs) compared to the younger ones
(Czaja, et al., 2006). In addition, older adults are left
behind and are less independent if they do not have
access to and are not able to utilise technology. For
instance, handheld computing systems with Internet
access are quickly turning into a significant means of
communicating and distributing information about
wellbeing, society and government services.
Table 7: Question 5.
Frequency Percent
Valid
Percent
Cumulative
Percent
Valid STRONGLY
NO
2 7.4 7.4 7.4
SLIGHTLY
NO
2 7.4 7.4 14.8
NO 8 29.6 29.6 44.4
NEUTRAL 10 37.0 37.0 81.5
SLIGHTLY
YES
5 18.5 18.5 100.0
Total 27 100.0 100.0
Question 5: Does the handheld computing system
interface suit your lifestyle? Based on the outcome of
this particular question, the respondents said the
interface of handheld computing systems does not suit
them; 44.4% said ‘No’, 18.5% said ‘Yes’ and 37%
were ‘Neutral’. The result also showed that not much
has been done to make the handheld computing
system interface suitable to adult first-time users.
Technology may have some adverse impacts on well-
being, and it is vital to ensure that the introduction of
technology into the lives of older adults is done
analytically and with care to suit their lifestyles
(Dickinson & Gregor, 2006).
Table 8: Question 14.
Frequency Percent
Valid
Percent
Cumulative
Percent
Valid STRONGLY
NO
2 7.4 7.4 7.4
SLIGHTLY
NO
4 14.8 14.8 22.2
NEUTRAL 13 48.1 48.1 70.4
SLIGHTLY
YES
8 29.6 29.6 100.0
Total 27 100.0 100.0
Question 14: Will you use handheld computing
systems? The findings from this question indicated
that the majority of the respondents said they did not
know if they would use a handheld computing system,
48.1% were ‘Neutral’, 22.2% said ‘No’, and 29.6%
said ‘Yes’. The usability of handheld computing
systems has been explored for some time. Scientists
place emphasis on improving ease of use by
considering the impact of age-related physical
deterioration (Zhou, et al., 2012). The basic reason
that adults do not accept handheld computing systems
is, by all accounts, as a result of having difficulty in
using them. This means that, if ease of use improves,
they would more readily accept handheld computing
systems.
b) What are some of the challenges when it
comes to adopting handheld computing systems: The
CSEDU 2020 - 12th International Conference on Computer Supported Education
222
data collected from the respondent's answers to this
question were analysed and discussed in the Tables
below.
Table 9: Question 6.
Frequency Percent
Valid
Percent
Cumulative
Percent
Valid SLIGHTLY
NO
1 3.7 3.7 3.7
NO 1 3.7 3.7 7.4
NEUTRAL 7 25.9 25.9 33.3
SLIGHTLY
YES
9 33.3 33.3 66.7
YES 2 7.4 7.4 74.1
STRONGLY
YES
7 25.9 25.9 100.0
Total 27 100.0 100.0
Question 6: Do you have issues using a handheld
computing touch screen? Based on the feedback from
the respondents, 25.9% were ‘Neutral’, 7.4% said
‘No’ and 66.6% said ‘Yes’. Meaning they are having
issues using handheld computing system touch
screens. The literature reviewed of handheld
computing systems emphasises that adults, in general,
slowly lose fundamental physical capabilities which
makes their perspectives about technology such as
handheld computing systems change (Buckner, 2004).
Table 10: Question 7.
Frequency Percent
Valid
Percent
Cumulative
Percent
Valid STRONGLY
NO
1 3.7 3.7 3.7
SLIGHTLY
NO
6 22.2 22.2 25.9
NEUTRAL 3 11.1 11.1 37.0
SLIGHTLY
YES
8 29.6 29.6 66.7
YES 9 33.3 33.3 100.0
Total 27 100.0 100.0
Question 7: Can you see the display input on handheld
computing system? The respondents have different
views on this question. When it comes to seeing the
display, 11.1% of the respondents said they were
‘Neutral’, 25.9% said ‘No’, they cannot see the display
input and 62.9% said ‘Yes’ they can see it.
Table 11: Question 8.
Frequency Percent
Valid
Percent
Cumulative
Percent
Valid STRONGLY
NO
1 3.7 3.7 3.7
SLIGHTLY
NO
3 11.1 11.1 14.8
NO 3 11.1 11.1 25.9
NEUTRAL 10 37.0 37.0 63.0
SLIGHTLY
YES
9 33.3 33.3 96.3
YES 1 3.7 3.7 100.0
Total 27 100.0 100.0
Question 8: Can you navigate through handheld
computing system functions easily? The negative
views of adult first-time users can be attributed to
hurdles in accepting technology. The outcome of this
analysis indicated that 37.0% of them chose ‘Neutral’,
25.9% said ‘No’, and 37% said ‘Yes’. Weakness,
incapacity, distrust of technology, absence of
perceived value and trouble working out how to utilise
the device are the main challenges observed by adult
first-time users in endeavouring to accept new
technologies such as handheld devices (Czaja &
Sharit, 2016).
Table 12: Question 9.
Frequency Percent
Valid
Percent
Cumulative
Percent
Valid NEUTRAL 2 7.4 7.4 7.4
SLIGHTLY
YES
8 29.6 29.6 37.0
YES 14 51.9 51.9 88.9
STRONGLY
YES
3 11.1 11.1 100.0
Total 27 100.0 100.0
Question 9: Do you struggle to select a specific icon
because your thumb feels too big for the device? The
data analysis for this research question shows that
7.4% of the respondents chose ‘Neutral’, 92.6% and
chose ‘Yes’ meaning they are struggling to select a
specific icon on the device. Based on the review of the
literature, adults are sluggish in movement and make
more sub-movements in operating handheld
computing systems (Hertzum & Hornbæk, 2010).
This impacts content entry and pointing activities.
Adult First-time User of Handheld Computer System: Challenges
223
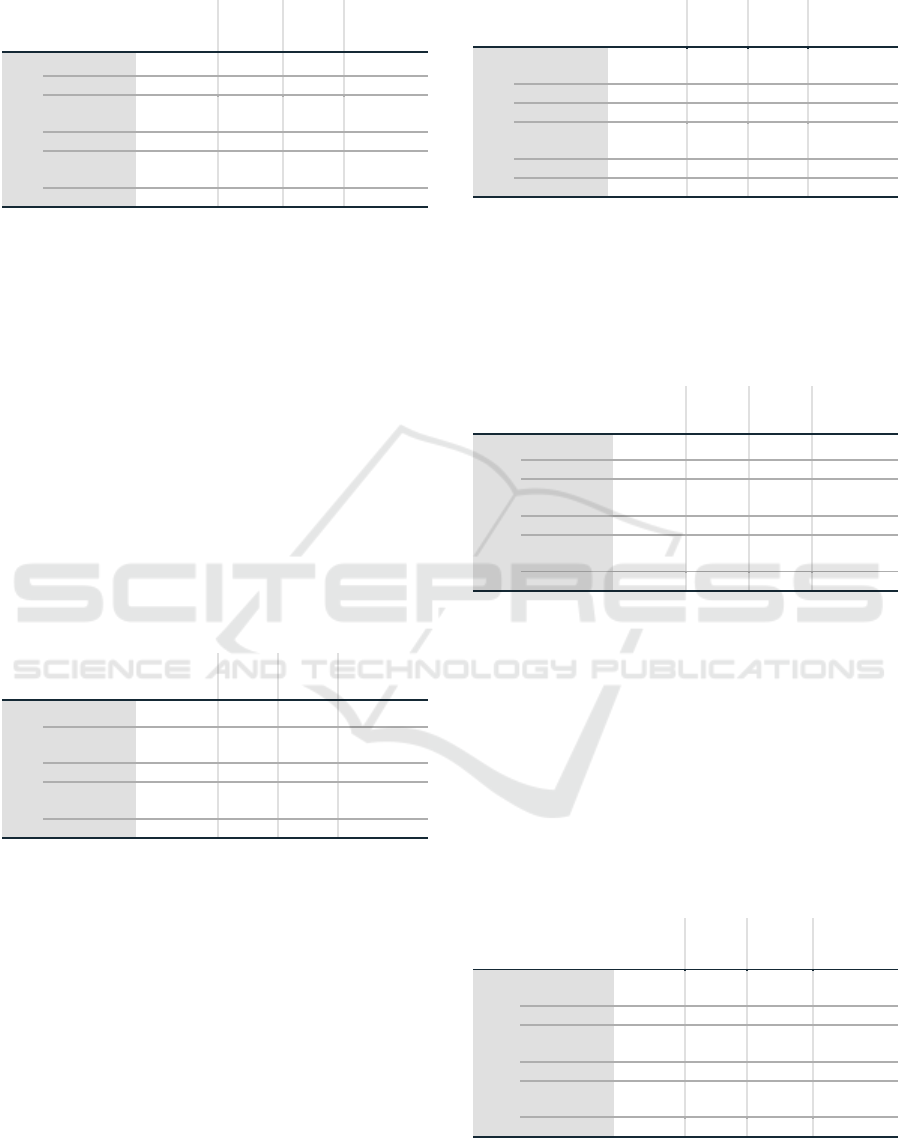
Table 13: Question 10.
Frequency Percent
Valid
Percent
Cumulative
Percent
Valid NO 1 3.7 3.7 3.7
NEUTRAL 10 37.0 37.0 40.7
SLIGHTLY
YES
5 18.5 18.5 59.3
YES 5 18.5 18.5 77.8
STRONGLY
YES
6 22.2 22.2 100.0
Total 27 100.0 100.0
Question 10: Do you feel that you have to remember
too many functions while using handheld computing
systems? Adult first-time users of handheld
computing systems felt that they have to remember too
many functions while using the device; 59.2% of them
said ‘Yes’, 37.0% were ‘Neutral’ and 3.7% said ‘No’.
On account of age-related, physiological weakening,
just as mental and social-ecological changes, it is
troublesome for adult first-time users to adjust to new
technology devices such as handheld computing
systems, and a large number of them quickly dismiss
new devices (Lee, et al., 2014).
c) What are the best mechanisms to have when
it comes to adopting handheld systems: Data
collected from the responses to this question were
analysed is discussed below for each of the questions.
Table 14: Question 3.
Frequency Percent
Valid
Percent
Cumulative
Percent
Valid NEUTRAL 6 22.2 22.2 22.2
SLIGHTLY
YES
5 18.5 18.5 40.7
YES 9 33.3 33.3 74.1
STRONGLY
YES
7 25.9 25.9 100.0
Total 27 100.0 100.0
Question 3: Can you afford any kind of handheld
computing system? The majority of the respondents
(77.7%) said ‘Yes’ and 22.2% chose ‘Neutral’. The
adoption of technology, such as a handheld computing
system, is influenced by two types of influence: direct
positive influence and direct negative influence
(Melenhorst, et al., 2006). Direct positive influence is
related to advantages, and lack of expense and direct
negative influence is related to expenses and lack of
advantages.
Table 15: Question 11.
Frequency Percent
Valid
Percent
Cumulative
Percent
Valid SLIGHTLY
NO
1 3.7 3.7 3.7
NO 3 11.1 11.1 14.8
NEUTRAL 8 29.6 29.6 44.4
SLIGHTLY
YES
11 40.7 40.7 85.2
YES 4 14.8 14.8 100.0
Total 27 100.0 100.0
Question 11: Did your previous experience as a
mobile device user help in accepting a handheld
computing system as a tool? The majority of
respondents (55.5%) answered ‘Yes’ to this question;
29.6% were neutral, and 14.8% said ‘No’.
Table 16: Question 12.
Frequency Percent
Valid
Percent
Cumulative
Percent
Valid NO 2 7.4 7.4 7.4
NEUTRAL 5 18.5 18.5 25.9
SLIGHTLY
YES
11 40.7 40.7 66.7
YES 7 25.9 25.9 92.6
STRONGLY
YES
2 7.4 7.4 100.0
Total 27 100.0 100.0
Question 12: Do you ask for help when using a
handheld computing system? The majority of the
respondents (74%) answered ‘Yes’, 7.4% said ‘No’
and 18.5% chose to be neutral. With regard to the
literature reviewed, help from relatives and non-
family members, social and cultural variables, identity
attributes, communication media conduct and
socioeconomic status have all been identified as
assisting adults in the adoption of technologies such as
handheld computing systems (Quan-Haase, et al.,
2016).
Table 17: Question 13.
Frequency Percent
Valid
Percent
Cumulative
Percent
Valid SLIGHTLY
NO
1 3.7 3.7 3.7
NEUTRAL 14 51.9 51.9 55.6
SLIGHTLY
YES
1 3.7 3.7 59.3
YES 4 14.8 14.8 74.1
STRONGLY
YES
7 25.9 25.9 100.0
Total 27 100.0 100.0
Question 13: Is a handheld computing system too
smart or fast for your liking? The data collected and
analysed from this question showed that 44.4% of the
CSEDU 2020 - 12th International Conference on Computer Supported Education
224
respondents said ‘Yes’ that a handheld device is too
smart for them, 51.9% were neutral, and 3.7% said
‘No’ to the question.
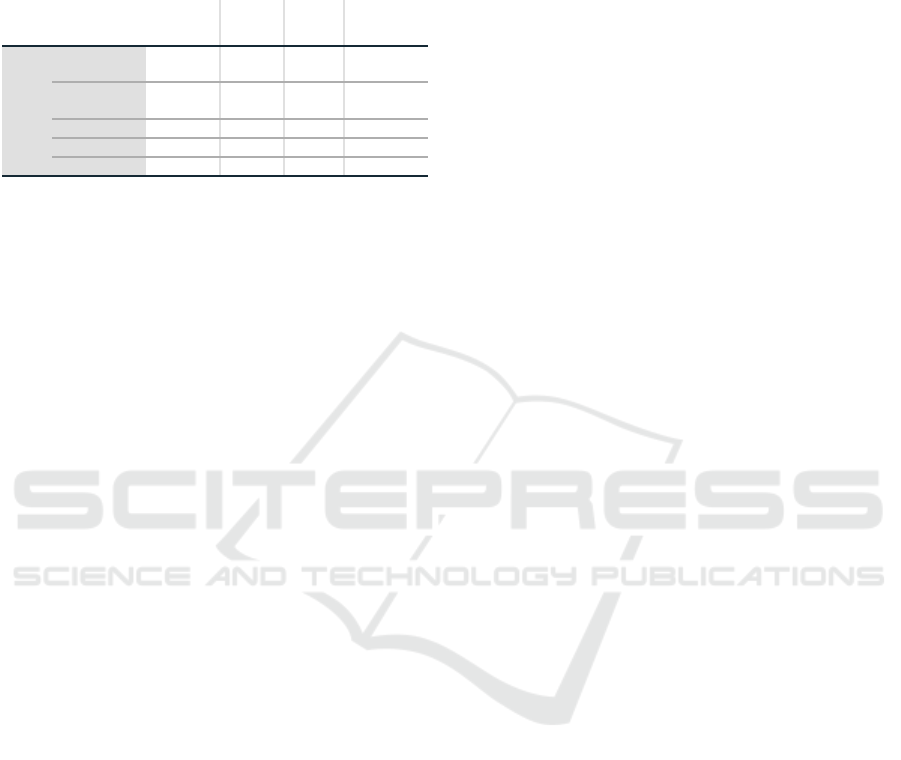
Table 18: Question 15.
Frequency Percent
Valid
Percent
Cumulative
Percent
Valid STRONGLY
NO
12 44.4 44.4 44.4
SLIGHTLY
NO
5 18.5 18.5 63.0
NO 7 25.9 25.9 88.9
NEUTRAL 3 11.1 11.1 100.0
Total 27 100.0 100.0
Question 15: Do you feel that your needs as an adult
first-time user were taken into consideration by
systems developers? This particular question was
designed for the developers to know what is needed in
developing handheld computing systems that will be
user-friendly for adult first-time users of handheld
devices. However, with the data collected and
analysed, 88.8% of respondents said ‘No’ to this
question, and 11.1% chose to be neutral.
6 CONCLUSION
The main aim of this research study was to gain an
understanding and knowledge of challenges being
faced by adult first-time users of handheld computing
systems. To provide solutions to these issues, a
literature review was carried out to find out the extent
of the challenges.
A few of the challenges faced by adult first-time
users of handheld computing systems can be described
as usability and acceptability of computing systems in
general. Adult first-time users have issues with the
design interface of handheld computing systems such
as screen displays and hieratical menus.
A broad literature review was done to gain full
knowledge and understanding of the importance of
computing systems in general. Computing systems
have changed our lifestyles in the way we live and do
things. They also allow us access to information when
required. Handheld computing systems can assist
adults, in particular, to overcome social exclusion,
keep contact and enable them to have free access to
information such as health and society information.
We also explored different kinds of handheld devices
and the value they add to the life of adult first-time
users.
A structured questionnaire and suitable population
sampling were used to gather data from the research
population. Probability sampling was considered to be
the best method of sampling to avoid sampling errors.
Validity and reliability were instruments used in
validating collected data and measuring the integrity
of data collected from the participants.
The research sample size was 50 adults between
the ages of 55 and 91 in Gauteng province, South
Africa and was not randomised. The outcome of the
research is only relevant to this sample and cannot be
generalised.
A large percentage of the data and information
originated from the point of view of the research
participants. The participants should not have had any
motivation to incorporate feelings in their answers, but
this does not guarantee the precision of the responses.
The participants may not be completely mindful of
their conduct or discard data that they have just
overlooked
The restricted time to accumulate information and
data from research participants impacted how much of
it could be assembled. The number, as well as the
nature of the questions in the research questionnaire,
needed to be completed within a short time, which
meant the scope of the questions was limited.
Lastly, adoption and usability of handheld devices
by adult first-time users can be seen as a big issue.
However, a proper design interface such as
considering age-related issues like a decline in vision,
hearing and movement should be considered for adult
users in general when any technology interface is
developed.
REFERENCES
Barnard, Y., Bradley , M. D., Hodgson, F. & Lloyd, A. D.,
2013. Learning to use new technologies by older adults:
Perceived difficulties, experimentation behaviour and
usability. Computers in Human Behavior, 29(4), pp.
1715-1724.
Becta, 2003. webarchive.nationalarchives.gov.uk. [Online]
Available at: http://foi.becta.org.uk/content_files/
corporate/resources/technology_and_education_resear
ch/handheld_computers. [Accessed 18 April 2019].
Bryman, A., 2012. Social research methods. 4th ed. New
York: Oxford press.
Buckner, R. L., 2004. Memory and executive function in
aging and AD: multiple factors that cause decline and
reserve factors that compensate. Neuron, 44(1), pp.
195-208.
Castro, F. G., Kellison, J. G., Boyd, S. J. & Kopa, A., 2010.
A methodology for conducting integrative mixed
methods research and data analyses. Journal of mixed
methods research, 4(4), pp. 342-360.
Adult First-time User of Handheld Computer System: Challenges
225

Chen, Y. & Persson, A., 2002. Internet use among young
and older adults: Relation to psychological well-being.
Educational Gerontology, 28(9), pp. 731-744.
Choi, N. G. & DiNitto, D. M., 2013. The digital divide
among low-income homebound older adults: Internet
use patterns, eHealth literacy, and attitudes toward
computer/Internet use. Journal of medical Internet
research, 15(5), p. 93.
Czaja, S. J. et al., 2006. Factors predicting the use of
technology: findings from the Center for Research and
Education on Aging and Technology Enhancement
(CREATE). Psychology and aging, 21(2), p. 333.
Czaja, S. J. & Sharit, J., 2016. Designing training and
instructional programs for older adults. s.l.:CRC Press.
Depoy, E. & Gitlin, L. N., 2005. Introduction to Research:
Understanding and Applying Multiple Strategies. St.
Louis, MO: Elsevier.
Dickinson, A. & Gregor, P., 2006. Computer use has no
demonstrated impact on the well-being of older adults.
International Journal of Human-Computer Studies,
64(8), pp. 744-753.
Frøkjær, E., Hertzum, M. & Hornbæk, K., 2000. Measuring
usability: are effectiveness, efficiency, and satisfaction
really correlated?. In Proceedings of the SIGCHI
conference on Human Factors in Computing Systems,
pp. 345-352.
Graeme, H., Paulo, R. & Luiz, M., 2006. Advances in
Doctoral Research in Management (Vol. 1). s.l.:World
Scientific.
Guo, S., 2015. Shaping social work science: What should
quantitative researchers do?. Research on Social Work
Practice, 25(3), pp. 370-381.
Hawe, P. & Potvin, L., 2009. What is population health
intervention research?. Canadian journal of public
health, 100(1), pp. 18-114.
Hertzum, M. & Hornbæk, K., 2010. How age affects
pointing with mouse and touchpad: A comparison of
young, adult, and elderly users. Intl. Journal of Human–
Computer Interaction, 26(7), pp. 703-734.
Ishak, I. S. & Alias, R. A., 2005. Designing a strategic
information system planning methodology For
Malaysian institutes of higher learning (ISP-IPTA),
Malaysia: Universiti Teknologi Malaysia.
Judd, C. M., McClelland, G. H. & Ryan, C. S., 2011. Data
analysis: A model comparison approach. 2nd ed. New
York: Routledge.
Kang, N. E. & Yoon, W. C., 2008. Age-and experience-
related user behavior differences in the use of
complicated electronic devices. International Journal
of Human-Computer Studies, 66(6), pp. 425-437.
Kaplan, D., 2004. The Sage handbook of quantitative
methodology for the social sciences. s.l.:Sage.
Karavidas, M., Lim, N. K. & Katsikas, S. L., 2005. The
effects of computers on older adult users. Computers in
human behavior, 21(5), pp. 697-711.
Kleinberger, T., Becker, M., Ras, E. & Holzinger, A., 2007.
Ambient intelligence in assisted living: enable elderly
people to handle future interfaces. International
conference on universal access in human-computer
interaction, pp. 103-112.
KPMG, 2010. From hype to future: KPMG’s 2010 Cloud
Computing survey. [Online] Available at: http://
www.techrepublic.com/whitepapers/from-hype-to-
future-kpmgs-2010-cloud-computing-survey
[Accessed 5 May 2019].
Lee, E., Han, S. & Chung, Y., 2014. Internet use of
consumers aged 40 and over: Factors that influence full
adoption. Social Behavior and Personality: an
international journal, 42(9), pp. 1563-1574.
Marczyk, G., DeMatteo, D. & Festinger, D., 2005.
Essentials of research design and methodology.
s.l.:John Wiley & Sons Inc.
Marquié, J. C., Jourdan-Boddaert, L. & Huet, N., 2002. Do
older adults underestimate their actual computer
knowledge?. Behaviour & Information Technology,
21(4), pp. 273-280.
Matlabi, H., Parker, S. G. & McKee, K., 2012. Experiences
of extra care housing residents aged fifty-five and over
with home-based technology. Social Behavior and
Personality: an international journal, 40(2), pp. 293-
300.
Mayhorn, C. B., Lanzolla, V. R., Wogalter, M. S. &
Watson, A. M., 2005. Personal digital assistants
(PDAs) as medication reminding tools: Exploring age
differences in usability. Gerontechnology, 4(3), pp.
128-140.
Melenhorst, A. S., Rogers, W. A. & Bouwhuis, D. G., 2006.
Older adults' motivated choice for technological
innovation: Evidence for benefit-driven selectivity.
Psychology and aging, 21(1), p. 190.
Morrel, R. W., Mayhorn, C. B. & Bennett, J., 2000. A
survey of World Wide Web use in middle-aged and
older adults. Human Factors, 42(2), pp. 175-182.
Morris, A., Goodman, J. & Brading, H., 2007. Internet use
and non-use: views of older users. Universal access in
the information society, 6(1), pp. 43-57.
Quan-Haase, A., Martin, K. & Schreurs, K., 2016.
Interviews with digital seniors: ICT use in the context
of everyday life. Information, Communication &
Society, 19(5), pp. 691-707.
Reiss, E., 2012. Usable usability: simple steps for making
stuff better. s.l.:John Wiley & Sons.
Schewe, C. D., 1998. Marketing to our aging population:
Responding to physiological changes. Journal of
Consumer Marketing, 5(3), pp. 61-73.
Shamoo, A. E. & Resnik, B. R., 2003. Responsible Conduct
of Research. s.l.:Oxford University Press.
Shaughnessy, J., Zechmeister, E. & Jeanne, Z., 2011.
Research methods in psychology. New York: McGraw
Hill.
Singer, E., 2003. Exploring the meaning of consent:
participation in research and beliefs about risks and
benefits. Journal of Official Statistics, 19(3), p. 273.
Thyer, B. A., 2001. The handbook of social work research
methods. s.l.:Sage.
Toko, G. R., 2017. Closing the digital gap: handheld
computing, adult first-time users, and a user experience
metric model,
Pretoria: Unisa.
Trochim, W. M., 2006. The Research Methods Knowledge
Base. [Online] Available at: http://
CSEDU 2020 - 12th International Conference on Computer Supported Education
226

www.socialresearchmethods.net/kb/ [Accessed 21
August 2019].
Tukey, J. W., 1962. The future of data analysis. The annals
of mathematical statistics, 33(1), pp. 1-67.
Ventä, L., Isomursu, M., Ahtinen, A. & Ramiah, S., 2008.
“My phone is a part of my soul”–How People Bond
with Their Mobile Phones. The Second International
Conference on Mobile Ubiquitous Computing, Systems,
Services and Technologies, pp. 311-317.
Weiss, S., 2003. Handheld usability. s.l.:John Wiley &
Sons.
Yogesh, K. S., 2006. Fundamental Of Research
Methodology And Statistics. India: New Age
International.
Young, C. M. Y. & Lo, B. C. Y., 2012. Cognitive appraisal
mediating relationship between social anxiety and
internet communication in adolescents. Personality and
Individual Differences, 52(1), pp. 78-83.
Yuan, S., Hussain, S. A., Hales, K. D. & Cotten, S. R., 2016.
What do they like? Communication preferences and
patterns of older adults in the United States: The role of
technology. Educational Gerontology, 42(3), pp. 163-
174.
Zhou, J., Rau, P. L. P. & Salvendy, G., 2012. Use and
design of handheld computers for older adults: A
review and appraisal. International Journal of Human-
Computer Interaction, 28(12), pp. 799-826.
Adult First-time User of Handheld Computer System: Challenges
227
